Ocean Carbon & Biogeochemistry
Studying marine ecosystems and biogeochemical cycles in the face of environmental change
  • Home
  • About OCB
    • About Us
    • Scientific Breadth
      • Biological Pump
      • Changing Marine Ecosystems
      • Changing Ocean Chemistry
      • Estuarine and Coastal Carbon Fluxes
      • Ocean Carbon Uptake and Storage
      • Ocean Observatories
    • Code of Conduct
    • Get Involved
    • Project Office
    • Scientific Steering Committee
    • OCB committees
      • Ocean Time-series
      • US Biogeochemical-Argo
      • Ocean-Atmosphere Interaction
  • Activities
    • Summer Workshop
    • OCB Webinars
    • Guidelines for OCB Workshops & Activities
    • Topical Workshops
      • CMIP6 Models Workshop
      • Coastal BGS Obs with Fisheries
      • C-saw extreme events workshop
      • Ecological Forecasting – North American Coastlines
      • Expansion of BGC-Argo and Profiling Floats
      • Fish, fisheries and carbon
      • Future BioGeoSCAPES program
      • GO-BCG Scoping Workshop
      • Lateral Carbon Flux in Tidal Wetlands
      • Marine CDR Workshop
      • Ocean Nucleic Acids ‘Omics
      • Ocean-Atmosphere Interactions
      • Oceanic Methane & Nitrous Oxide
    • Small Group Activities
      • Aquatic Continuum OCB-NACP Focus Group
      • Arctic-COLORS Data Synthesis
      • BECS Benthic Ecosystem and Carbon Synthesis WG
      • Carbon Isotopes in the Ocean Workshop
      • CMIP6 WG
      • Filling the gaps air–sea carbon fluxes WG
      • Fish Carbon WG
        • Fish Carbon WG Workshop
        • Fish carbon workshop summary
      • Marine carbon dioxide removal
      • Metaproteomic Intercomparison
      • Mixotrophs & Mixotrophy WG
      • N-Fixation WG
      • Ocean Carbonate System Intercomparison Forum
      • Ocean Carbon Uptake WG
      • OOI BGC sensor WG
      • Operational Phytoplankton Observations WG
      • Phytoplankton Taxonomy WG
    • Other Workshops
    • Science Planning
      • Coastal CARbon Synthesis (CCARS)
      • North Atlantic-Arctic
    • Ocean Acidification PI Meetings
    • Training Activities
      • PACE Training Activity
  • Science Support
    • Data management and archival
    • Early Career
    • Funding Sources
    • Jobs & Postdocs
    • Meeting List
    • OCB Topical Websites
      • Ocean Fertilization
      • Trace gases
      • US IIOE-2
    • Outreach & Education
    • Promoting your science
    • Student Opportunities
    • OCB Activity Proposal Solicitations
      • Guidelines for OCB Workshops & Activities
    • Travel Support
  • Publications
    • Ocean Carbon Exchange
    • OCB Workshop Reports
    • Science Planning and Policy
    • Newsletter Archive
  • OCB Science Highlights
  • News

Archive for Reports-Proposals

New Trace Gases Standard Operating Protocols (SOPs) and paper from OCB Workshop

Posted by mmaheigan 
· Tuesday, December 1st, 2020 

A number of laboratories throughout the world measure dissolved methane (CH4) and nitrous oxide (N2O) to quantify their spatial and temporal distributions, determine the rates of production and consumption, and also derive emissions to the overlying atmosphere. To maximize the scientific value of these studies, dissolved CH4 and N2O measurements made by all laboratories should be intercomparable and of the highest possible accuracy and precision. An important component to achieving community-wide intercomparability for dissolved CH4 and N2O measurements is the production of Standard Operating Protocols (SOPs). The SOPs need to contain clear and agreed upon guidelines for achieving high quality measurements. This webpage lists seven draft SOPs for dissolved CH4 and N2O. Thanks to the efforts of several members of the trace gas community, draft SOPs for CH4 and N2O sampling, analysis, and data reporting are available for public comment from December 2020 to March 31, 2021. Please visit https://web.whoi.edu/methane-workshop/sops/ for more information.


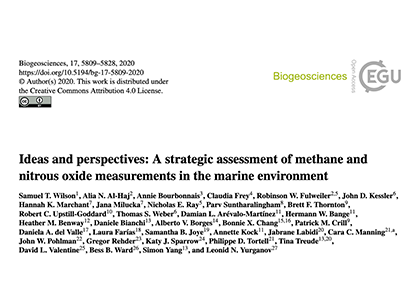
New paper inspired by discussions at OCB workshop on oceanic methane and nitrous oxide: Ideas and perspectives: A strategic assessment of methane and nitrous oxide measurements in the marine environment

Wilson, S. T., Al-Haj, A. N., Bourbonnais, A., Frey, C., Fulweiler, R. W., Kessler, J. D., Marchant, H. K., Milucka, J., Ray, N. E., Suntharalingham, P., Thornton, B. F., Upstill-Goddard, R. C., Weber, T. S., Arévalo-Martínez, D. L., Bange, H. W., Benway, H. M., Bianchi, D., Borges, A. V., Chang, B. X., Crill, P. M., del Valle, D. A., Farías, L., Joye, S. B., Kock, A., Labidi, J., Manning, C. C., Pohlman, J. W., Rehder, G., Sparrow, K. J., Tortell, P. D., Treude, T., Valentine, D. L., Ward, B. B., Yang, S., and Yurganov, L. N.: Ideas and perspectives: A strategic assessment of methane and nitrous oxide measurements in the marine environment, Biogeosciences, 17, 5809–5828, https://doi.org/10.5194/bg-17-5809-2020, 2020.

 

A new approach for calculating chemical speciation in aquatic systems

Posted by mmaheigan 
· Thursday, August 22nd, 2019 

By Simon Clegg and Matthew Humphreys (UEA)

Members of a funded NERC/NSF project A Thermodynamic Chemical Speciation Model for the Oceans, Seas, and Estuaries are working to develop new tools for the calculation of chemical speciation in seawater and other natural waters. After seeking feedback from the oceanographic community via a Town Hall at the 2016 Ocean Sciences Meeting and an online survey, Matthew Humphreys and Simon Clegg at the University of East Anglia (UK) are developing a draft software package that will be able to:

  • Adjust the stability constants for the ocean carbonate system for deviations of water composition from seawater stoichiometry
  • Make similar adjustments for composition effects on pH, and on the buffer used to define the total pH scale
  • Quantify the effects of the ionic components of natural waters on equilibrium constants and pH and subsequently identify those chemical systems for which new measurements are needed in order to improve the accuracy of predictions

Calculations for Tris pH buffer in S = 35 artificial seawater, showing that the largest contribution to the total uncertainty in pHT (±0.007, calculated using a speciation model) is from the thermodynamic equilibrium constant for bisulfate (HSO4-) dissociation. This is followed by the influence of Cl- on H+ ions (HCl), and on TrisH+ ions (TrisHCl). The uncertainty contributions of the TrisH+ equilibrium constant, and Na+ interactions on SO42- are both small.

This work is part of a larger effort by members of Scientific Committee on Oceanic Research (SCOR) Working Group 145 to inform and facilitate the development of chemical speciation models that quantify uncertainties and are applicable across a broader range of natural waters.

Participants of this project and SCOR Working Group 145 (Matthew Humphries, Simon Clegg, David Turner, Andrew Dickson, Heather Benway) will attend the 2020 Ocean Sciences Meeting in San Diego and provide several opportunities to share new scientific results on chemical speciation and showcase the new speciation model. You can learn more as follows:

  • View presentations of our methods and initial results in session CT003 – Chemical Speciation and Biogeochemistry in a Changing Ocean (abstracts due Sept. 11)
  • Participate in a hands-on demonstration of our draft tools for speciation calculations at a special workshop side event (more details will be provided via the OCB, SCOR, and GEOTRACES email lists/websites)
  • Visit the SCOR exhibit booth (booth 341 in the exhibit hall) to chat and work one-on-one with the speciation model on a dedicated PC

Towards a better understanding of fish contribution to carbon flux OCB workshop summary

Posted by mmaheigan 
· Thursday, August 8th, 2019 

Summary

This workshop, held March 4-5, 2019 at Rutgers University, was attended by 14 researchers from 11 different institutions. The workshop focused on synthesizing the existing research on fish carbon flux, discussing challenges in measuring fish carbon flux, and determining approaches for estimating fish contribution to carbon flux on variable scales. Presentations interspersed with group discussions were specifically targeted toward best approaches for determining: fish biomass on regional and global scales, relative amounts of carbon forms produced from fish (i.e., release of sinking fecal pellets, excretion of particulate inorganic carbon and dissolved organic carbon, respiration of carbon dioxide), and carbon flux estimates from fish biomass (i.e., bioenergetics, size-based allometric relationships, stable isotopes).

Participants

Workshop participants: Standing from L to R – Clive Trueman, Rod Wilson, Santiago Hernández-León, Kenneth Rose, Adrian Burd, John Dunne, Angela Martin; Sitting from L to R – Grace Saba, Deborah Steinberg, Stephanie Wilson. Other Fish Carbon working group participants that were unable to attend the meeting include: Nicola Beaumont, Joe Salisbury; Guest presenters at the workshop (not pictured): Olaf Jensen, Charles Stock


Monday, March 4, 2019

Overview of Project and Workshop Goals
Presentation by Grace Saba, Fish Carbon Work Group Lead

From Turner 2015

The ‘biological pump’, the vertical transport of biologically generated dissolved or particulate organic matter from the surface to the ocean’s interior, plays a key role in ocean biogeochemistry and food webs. Active transport of carbon via diel vertically migrating (DVM) organisms as well as passive transport via their rapidly sinking fecal pellets are major contributors to the ‘biological pump’. With more than 500 studies measuring zooplankton flux, there is a wealth of knowledge of zooplankton active and passive transport and their contributions to carbon flux. However, fish contribution to the biological pump is a complete unknown. To our knowledge, less than ten studies have estimated active transport in DVM fish and only five studies focused on direct measurements of fish passive flux. Mesopelagic DVM fishes from these few studies can contribute ~30- 40% of total carbon flux through respired and excreted carbon byproducts. Furthermore, all reports on fish fecal pellets thus far have demonstrated the formation of cohesive, durable, rapidly sinking fecal pellets. Additionally, two studies revealed that fish contribute up to 15% of total oceanic carbonate production (inorganic C) via the formation and excretion of various forms of precipitated (non-skeletal) calcium carbonate from their guts.

This information is essential to not only determine its potential for a food source for benthic organisms, but also to improve parameterization of key processes affecting the biological pump and to develop more accurate regional and global carbon models. Only then can we begin to understand interannual and seasonal/spatial variability and long-term changes of fish fecal flux, food web regulation of carbon flux, and evaluate the potential role of environmental factors and climate change on fish carbon flux. This working group is aimed at synthesizing existing knowledge of fish carbon flux, investigating the challenges associated with estimating fish contribution to the biological pump, and paving a path forward to develop approaches to begin filling some of the gaps in this much needed research. The overarching goals of the working group are to synthesize the existing research on fish carbon flux, recognize the challenges in measuring fish carbon flux and discuss approaches to resolve them, develop research priorities to fill the large gaps in understanding fish carbon flux, and identify opportunities to obtain resources needed to move this research forward. Since its inception, this working group has been meeting virtually, on average, every three months to assign tasks to complete in between calls in order to address these goals. The in-person workshop was aimed at completing some tasks and making significant progress on the more challenging aspects of some of these tasks. The specific goals for the workshop were as follows:

  • Finalize Paper 1: Synthesis, Challenges, Gaps, Research Priorities, Assign specific tasks with deadlines for completion
  • Make as much progress as possible on Paper 2: Outline emerging methods, and first attempt at estimating global and/or regional carbon contributions
    • Finalize Approaches for Fish Biomass Estimates, Passive and Active Fish Carbon Fluxes, Comparisons to Total Carbon Flux and Zooplankton Flux
    • Assign specific tasks with deadlines to complete Paper 2
  • Discuss Potential Proposals for Filling Gaps

Fish Carbon Synthesis, Challenges, Gaps, and Research Priorities
Presentation by Angela Martin followed by Group Discussion

Through web conference calls and ongoing iterations of a draft manuscript, the group has conducted a synthesis of knowledge on fish carbon flux and has developed a list of research challenges and research priorities. This is still an ongoing process, and the group is still working on incorporating thoughtful content for the manuscript. Specifically, the group is currently in the process of completing a summary of available methods for flux measurements to highlight the gaps, an approach to overcoming identified research challenges, and a prioritized list of the research needs.


Fish Biomass: Challenges and Best Approaches
Presentations by Olaf Jensen and Charles Stock followed by discussion

Dr. Olaf Jensen summarized four approaches to estimate fish biomass. These include:

  • Scaling up density estimates: Estimate an areal density from data collected from trawl or hydroacoustic surveys and multiplying by area. However, challenges exist in making these estimates. Catch efficiency from trawl surveys has uncertainty due to herding effects or escapes, and bias in scaling up hydroacoustic surveys caused by scattering other types of organisms (i.e., siphonophores) can occur.
  • Energetic approach: From primary production measurements, scale up energy movement through food chain to fish biomass using an estimated value of trophic transfer efficiency (i.e., 10%). This approach is currently used in EcoPath and EcoSym models, and has also been described previously in Ryther 1969 and Pauly and Christensen 1995. However, uncertainty in this approach occurs when making required assumptions as to what proportions of biomass of each trophic level is fish and the trophic transfer efficiency.
  • Size-based models: Using size-based relationships between trophic levels such that the slope of the size spectrum is predictable and the proportion of fish at each size in the size spectrum can be estimated (Jennings and Collingridge 2015). This approach assumes predation is size-structured, but not all predation follows this pattern.
  • Stock assessment data: Mathematical models used to estimate the size and productivity of fish or invertebrate stocks using index of abundance (i.e., trawl surveys) and how much is removed to see if the amount harvested is making an impact on the annual reproduction of stocks. However, this is limited because stock assessments are used only for specific targeted fish and, although there are some global stock assessment data bases (i.e., RAM), the tropics do not have good stock assessment data because of the operational cost. Additionally, productivity and standing stock are confounded and not equal.

All of these different approaches incorporate a modeling aspect of variable scale, and they can produce very different estimates by an order of magnitude that could be used to bound the estimates of biomass, and subsequently fish carbon contribution. Using a snapshot of biomass is valuable, but for estimating the role of fish in carbon flux, information about the flux of fish biomass over some time interval is also necessary information. Following the presentation, the group discussed potential spatial and vertical scales at which fish biomass and carbon flux could be determined and approaches that were most appropriate for global vs regional analysis.

The presentation by Dr. Charles Stock focused on the challenges of incorporating fish in biogeochemical models as well as past and ongoing efforts to do so. Energy flows decay very rapidly from phytoplankton to fish, so using net primary productivity to estimate fish biomass or abundance is not sufficient. Incorporating trophodynamics (i.e., trophic transfer efficiency) is a necessary step and there is high uncertainty in these estimations. Uncertainties in biomass estimation at each trophic level can greatly impact the biomass estimate at the highest trophic levels.

Modified from Dr. Olaf Jensen presentation “Estimating Global Fish Biomass” available on this project’s website.

Furthermore, regionally the trophodynamics vary greatly and will likely cause sharp spatial and vertical gradients in fish importance with respect to carbon flux. Newly developed models such as those that include fish size and functional type (Petrik et al. 2019) are promising for mechanistically resolving fish biomass at different trophic levels. From a discussion following the presentation, the group decided that a review of available models for estimating fish biomass should be included in the synthesis paper and should discuss strengths and weaknesses for each.


Tuesday, March 5, 2019

Getting Carbon Estimates from Fish Biomass
Presentations by Kenneth Rose and Clive Trueman

Dr. Rose described several model options to estimate carbon production from fish. These include the classical bioenergetic models (Wisconsin [Kitchell] and Dynamic Energy Budget [DEB]) and an Aquaculture model. The Wisconsin (Kitchell) model considers consumption, respiration, specific dynamic action, egestion, excretion, and egg production. Growth is typically estimated from the model.

Bioenergetics Model: Venfish, 2002 PICES Model/REX Task Team.

It does not incorporate mortality and reproduction. The inclusion terms are not independent as patterns in consumption effect all other parameters in the model equation. The terms of this model relate to Cmax, or the maximum the fish can eat; however, fish are likely not always eating at their full capacity and could bias model output. There are ongoing efforts to uncouple the models and incorporate food availability to reflect more realistic conditions. The model is daily time-stepped, and all processes are temperature and size dependent. Although there are many versions of the equation, typically consumption is the only thing that is changed and the waste product is usually 0.7.

Dynamic Energy Budget: Jusup et al. 2011.

The DEB approach was developed to model energy inputs, storage, energy allocation (to growth, somatic maintenance, reproduction), and waste outputs in individual fish. The big difference between the Wisconsin (Kitchell) and a DEB model is that in a DEB, the energy allocated towards growth and reproduction can be adjusted according to fish species and size.

Aquaculture Model (AQUA): Rensel et al. 2006.
(Above) Three model examples presented by Dr. Kenneth Rose.

Models have recently been developed to determine the fate of aquaculture waste products and potential impacts on local benthic areas and downstream. The models look similar to the bioenergetic models; however, in this case the biomass (fish weight), growth rate, and food availability terms are known and the model incorporates a benthic component. DEPOMOD models the deposition and biological effects of solid wastes by tracking the waste as particles to see the fate of the waste (i.e. advection, settling, resuspension, etc.), and then incorporates a benthic component. The AQUA model incorporates different kinds of waste, and once solid waste reaches the bottom, the benthic community response is modeled.

Dr. Trueman gave two presentations focused on estimating carbon from fish – the first on using size-based macroecological models to estimate fish biomass and the second on using stable isotopes to estimate carbon from fish biomass estimates. First, the aim of size-based models is to predict biomass/abundance through an ecosystem as a function of body size and primary production. Using this model, you can estimate how energy is divided between trophic levels assuming community is size-structured. The advantages for using this method include simplification (easy to understand), ease of coupling to GCM models, and there are large data sets of body size to validate against. The key variables can be constrained a bit with relatively simple field data, and these include available primary production, temperature-dependent consumer metabolic rate, predator prey mass ratio (PPMR), and trophic transfer efficiency (TE). Typically, consumer production depends on body size and temperature. Additionally, biomass size spectrum depends on PPMR and transfer efficiency, whereby at high PPMR/constant TE and High TE/constant PPMR, there is a short food chain and a lot of energy goes through small low trophic animals. Some examples using these types of models include Jennings and Collingridge 2015 and Blanchard et al. 2008. However, as described earlier, TE and PPMR are relatively poorly constrained and cause high uncertainty in the model. But these models can be used to get approximate or range of carbon flux estimates. The models essentially track the remaining carbon after respiratory loss, and the 1-TE term in the model effectively sets available carbon for storage.

One other potential method for estimating carbon flux from fish biomass is via stable isotopes. Isotopes useful for tracking movement of carbon where this occurs across natural isotopic gradients. Isotopes can be used to determine the PPMR due to the effect of isotopes in eating vs. waste products. And then if biomass size spectrum is known, we can infer the TE or ask if the TE can link the measured PPMR. Community level analyses can also recover PPMR. Additionally, isotope analysis on fish otoliths can be used to measure metabolic rates in the field. Carbonate in the aragonite is sourced from DIC from surrounding water or from carbon respired, and the rate at which respiring dietary carbon is influenced on the isotopic ratio. Additionally, oxygen isotopes in the otolith can be used to derive temperature (thermal history) and therefore metabolic rates. This method is beneficial in estimating field metabolic rates in fish that are difficult to collect and maintain in the laboratory for traditional metabolic experiments (i.e., DVM mesopelagic fish). Combined with biomass data, isotopes could be used to quantify C flux.


Forms of Carbon
Presentations by Joe Salisbury, Rod Wilson, Grace Saba, and Santiago Hernández-León

Dr. Salisbury’s presentation was focused on whether or not the carbon removed from fishing/harvesting activities is a significant loss of carbon. The particulate organic carbon (POC) in ocean fish is brought onto land where it oxidizes relatively quickly. Similarly, consumption of fish stocks by birds is on the same order of magnitude as global fishing effort. Once consumed, they respire this POC directly into the atmosphere, potentially lowering seawater dissolved inorganic carbon and pCO2. However, bird feces released back into the water may add some of this carbon back but at a lower carbon-to-nitrogen ratio. Preliminary simplified calculations of this potential carbon loss from wild fish and aquacultured products is comparable to about ~10-15% of the coastal air-sea flux (0.2-0.4 Pg/yr vs. ~0.3-0.4 Pg/yr).

From Wilson et al. 2009.

Dr. Rod Wilson suggests that fish are a major producer of new calcium carbonate, CaCO3. Fish calcium carbonate is not skeletal in origin (bone is actually calcium phosphate), but is instead produced in the gut via osmoregulation physiology. They live in a very salty environment but they have a blood osmolarity of ~330 mOsm/kg. Marine teleosts are constantly suffering or tending towards dehydration, and the only thing they can drink is seawater. Seawater ions are high in magnesium and calcium. As these ions are moving through the fish intestine, they are secreting bicarbonate which promotes calcium carbonate production. The calcium carbonate gets wrapped in a mucus coating and then excreted, along with some magnesium precipitates. Conservative estimates of fish CaCO3 production equal 40-110 million tonnes/year (0.04-0.11 Pg CaCO3-c/year = 3 to 15% of global CaCO3 production. Less conservative, but likely more realistic estimates are 3x greater (9-45% of global CaCO3 production). And in a warmer, higher CO2 future (+ 4C/1000uatm CO2), fish CaCO3 production could be >70% higher. The rate at which calcium carbonate is produced is proportional to feeding rates, whereby the mean production rate of CaCO3 in feeding fish is 10x higher than starved fish. Additionally, fecal CaCO3 content can affect the sinking rate of fecal pellets, whereby higher CaCO3 content leads to faster sinking rates. But once excreted, the fish carbonates dissolve rapidly, which can add alkalinity to seawater and as such may explain the reason why surface ocean alkalinity is higher than would be expected based solely on salinity estimates. Furthermore, DVM mesopelagic fish may drive an “alkalinity pump” through their vertical movements while excreting CaCO3.

Northern anchovy fecal pellets collected in Santa Barbara Channel sink up to 1370 m d-1 (from Saba & Steinberg 2012).

Dr. Saba described the body of work focused on fecal pellet flux measurements in zooplankton, and that lessons learned here can be applied to fish flux measurements. There has been much work focused on many different types of zooplankton, and the surface zooplankton community composition plays a big role in the types and sizes of pellets produced and how much carbon is entrained in them. For instance, gelatinous salps produce pellets that are larger and sink more rapidly compared to those produced from other zooplankton such as krill and copepods. The quality of pellets also depend on what the zooplankton were feeding on. There has been much less research focused on fish fecal pellet production and carbon flux. However, fish likely are important exporters too (i.e., northern anchovy fecal pellet sinking rates of 458 – 1370 m/d). Fish create very distinctive and well-packed fecal pellets (high in carbon and nitrogen) likely with minimal remineralization as they sink. Approaches used and challenges in measuring fecal pellet flux were also discussed. Sediment traps can directly collect sinking material in a location, but they miss most of the fish flux due to the heterogeneity of fish movements and distributions. Lab and field studies can directly measure pellet production and sinking rates, but likely fail to reflect in situ feeding conditions and may bias rate measurements. Bioenergetic and allometric modeling techniques can be used, but assumptions have to be made to constrain measurements.

Dr. Hernandez-Leon’s presentation focused on the relationship between respiration rates and electron transfer system (ETS) activity in fishes in relation to swimming activity. ETS activity is used as a proxy for respiration and is used for deep sea fish because it is experimentally difficult to measure true respiration in these fishes from laboratory experiments conducted at surface conditions. However, initial laboratory experiments need to be carried out to determine relationships between respiration and swimming speed. From acoustic approaches, the upward and downward velocities of DVM can be determined for a migration time (1-2 hours). And using an example species in the lab with swim flume techniques, the repiratory/ETS ratios can be determined at different swimming speeds.


Approach for comparisons of Fish C Flux to Total and Zooplankton Flux
Presentations by Deborah Steinberg, Santiago Hernández-León, and John Dunne followed by discussion

From Steinberg and Landry 2017.

Dr. Debbie Steinberg presented recent research focused on zooplankton and the biological carbon pump as a basis to start thinking about comparisons with fish. She pointed to a recent review paper that reviews what we know so far regarding zooplankton and their role in the biological pump (Steinberg and Landry 2017). Recent zooplankton research suggests carcasses play an important role in carbon flux, but it is difficult to measure so there are a lot of unknowns. Active transport through vertical migration is also an important mode of bringing excreted DOC, egested POC/PIC, and respired CO2 to depths after feeding at the surface during the nighttime. The magnitude of active transport in DVM zooplankton can also be estimated because we can directly determine biomass (net tows, acoustics, etc.) and then derive carbon flux through respiration measurements (direct, ETS, Allometric/size-based algorithms of metabolism) and POC/PIC flux estimates. With respect to the fecal pellets, community size structure is very important in determining the magnitude. And recent work using long-term data sets suggests that temperature and changing zooplankton distributions and diversity play important roles in regulating carbon flux. As ocean warms, smaller tropical/subtropical species move poleward, increasing diversity. These smaller zooplankton produce pellets that have long residence times in the surface, effectively decreasing the flux of particulate C to the deep. In regions such as BATS, however, there have been observed increases in zooplankton active transport and fecal pellet production as a result of increases in biomass.

In order to make comparisons between zooplankton and fish, we need more information on fish fecal material (classify for taxa, measure production and sinking rates with respect to feeding rates and size, respectively), fish respiration rates, PIC production/dissolution rates. We will also need global carbon export models that can be used to look at relative contributions of fish and zooplankton fluxes.

From Dr. Hernández-León presentation “Zooplankton and Micronekton Active Flux” available on this project’s website (Sourced from Ariza et al. 2015).

Dr. Santiago Hernández-León presented work from recent cruises that compared zooplankton and micronekton active flux. There are currently very few studies (two published) with direct zooplankton and fish comparisons. Their research team employed net tows to measure biomass and abundance and ETS activity for respiration measurement of zooplankton and micronekton in the Atlantic Ocean from coast of Brazil to the Canary Islands and get a gradient from oligotrophic to eutrophic zones (MAFIA cruise). Through these methods, they determined the proportion of respiratory flux to migrant biomass. However, he noted that capture efficiency of micronekton trawls likely underestimated active flux contributions.

Particle export ratio (ratio of sinking particle flux at the base of the euphotic zone to the Net Primary Productivity from Devries and Weber 2017.

Dr. John Dunne presented past and current efforts of modeling primary production to ecosystems and particle export. His work used empirical and mechanistic models to determine particle export ratio (Dunne et al. 2005). He suggested that any of these methods are considered successful if they come out with 50% or less uncertainty particle export. Additionally, Dunne et al. 2007 conducted a synthesis of global particle export from the surface ocean and cycling through the ocean interior and on the seafloor. The particle export estimates converge quite a bit because uncertainty has to do with temperature and microbial activity. An effort by Laws et al. 2011 used simplified equations to estimate ratios and produced better estimates in the tropics. Finally, Devries and Weber 2017 combined data simulation with geochemistry and satellite estimates through an ecosystem model and came up with a cross calibrated representation to account for sinking particle flux and attenuation.


Next Steps:

Planned products resulting from this workshop and ongoing working group efforts include two peer-reviewed manuscripts focused on the synthesis of fish carbon flux research and a quantitative analysis of fish carbon flux.

Filter by Keyword

234Th disequilibrium abundance acidification africa air-sea flux air-sea interactions air-sea interface algae alkalinity allometry ammonium AMOC anoxia anoxic Antarctic anthro impacts anthropogenic carbon aquaculture aragonite saturation arctic Argo argon arsenic artificial seawater Atlantic Atlantic modeling atmospheric carbon atmospheric CO2 atmospheric nitrogen deposition authigenic carbonates autonomous platforms bacteria BATS BCG Argo benthic bgc argo bio-go-ship bio-optical bioavailability biogeochemical cycles biogeochemical cycling biogeochemical models biogeochemistry Biological Essential Ocean Variables biological pump biological uptake biophysics bloom blooms blue carbon bottom water boundary layer buffer capacity C14 CaCO3 calcification calcite calcium carbonate carbon carbon-climate feedback carbon-sulfur coupling carbon budget carbon cycle carbon dioxide carbon export carbon sequestration carbon storage Caribbean CCA CCS changi changing marine ecosystems changing marine environments changing ocean chemistry chemical oceanographic data chemical speciation chemoautotroph chesapeake bay chl a chlorophyll circulation climate change climate variability CO2 CO2YS coastal darkening coastal ocean cobalt Coccolithophores community composition conservation cooling effect copepod coral reefs CTD currents cyclone data data access data management data product Data standards DCM dead zone decadal trends decomposers decomposition deep convection deep ocean deep sea coral deoxygenation depth diagenesis diatoms DIC diel migration diffusion dimethylsulfide dinoflagellate discrete measurements dissolved inorganic carbon dissolved organic carbon DOC DOM domoic acid dust DVM earth system models ecology ecosystems ecosystem state eddy Education Ekman transport emissions ENSO enzyme equatorial regions error ESM estuarine and coastal carbon estuarine and coastal carbon fluxes estuary euphotic zone eutrophication evolution export export fluxes export production EXPORTS extreme events extreme weather events faecal pellets filter feeders filtration rates fire fish Fish carbon fisheries floats fluid dynamics fluorescence food webs forage fish forams freshening freshwater frontal zone fronts functional role future oceans geochemistry geoengineering geologic time GEOTRACES glaciers gliders global carbon budget global ocean global warming go-ship grazing greenhouse gas Greenland groundwater Gulf of Maine Gulf of Mexico Gulf Stream gyre harmful algal bloom high latitude human food human impact hurricane hydrogen hydrothermal hypoxia ice age ice cores ice cover industrial onset inverse circulation ions iron iron fertilization isotopes jellies katabatic winds kelvin waves krill kuroshio laboratory vs field land-ocean continuum larvaceans lateral transport LGM lidar ligands light light attenuation lipids mangroves marine carbon cycle marine heatwave marine particles marine snowfall marshes Mediterranean meltwater mesopelagic mesoscale metagenome metals methane methods microbes microlayer microorganisms microscale microzooplankton midwater mixed layer mixed layers mixing mixotrophy modeling models mode water molecular diffusion MPT multi-decade n2o NAAMES NASA NCP net community production net primary productivity new ocean state new technology Niskin bottle nitrate nitrogen nitrogen cycle nitrogen fixation nitrous oxide north atlantic north pacific nuclear war nutricline nutrient budget nutrient cycling nutrient limitation nutrients OA ocean-atmosphere ocean acidification ocean acidification data ocean carbon uptake and storage ocean color ocean observatories ocean warming ODZ oligotrophic omics OMZ open ocean optics organic particles oscillation overturning circulation oxygen pacific paleoceanography particle flux particles pCO2 PDO peat pelagic PETM pH phenology phosphorus photosynthesis physical processes physiology phytoplankton PIC plankton POC polar regions pollutants precipitation predation prediction primary production primary productivity Prochlorococcus proteins pteropods pycnocline radioisotopes remineralization remote sensing repeat hydrography residence time resource management respiration resuspension rivers rocky shore Rossby waves Ross Sea ROV salinity salt marsh satell satellite scale seafloor seagrass sea ice sea level rise seasonal patterns seasonal trends sea spray seaweed sediments sensors shelf system shells ship-based observations shorelines silicate silicon cycle sinking particles size SOCCOM soil carbon southern ocean south pacific spatial covariations speciation SST stoichiometry subduction submesoscale subpolar subtropical sulfate surf surface surface ocean Synechococcus teleconnections temperate temperature temporal covariations thermocline thermodynamics thermohaline thorium tidal time-series time of emergence top predators total alkalinity trace elements trace metals trait-based transfer efficiency transient features Tris trophic transfer tropical turbulence twilight zone upper ocean upper water column upwelling US CLIVAR validation velocity gradient ventilation vertical flux vertical migration vertical transport volcano warming water clarity water quality waves western boundary currents wetlands winter mixing world ocean compilation zooplankton

Copyright © 2023 - OCB Project Office, Woods Hole Oceanographic Institution, 266 Woods Hole Rd, MS #25, Woods Hole, MA 02543 USA Phone: 508-289-2838  •  Fax: 508-457-2193  •  Email: ocb_news@us-ocb.org

link to nsflink to noaalink to WHOI

Funding for the Ocean Carbon & Biogeochemistry Project Office is provided by the National Science Foundation (NSF) and the National Aeronautics and Space Administration (NASA). The OCB Project Office is housed at the Woods Hole Oceanographic Institution.