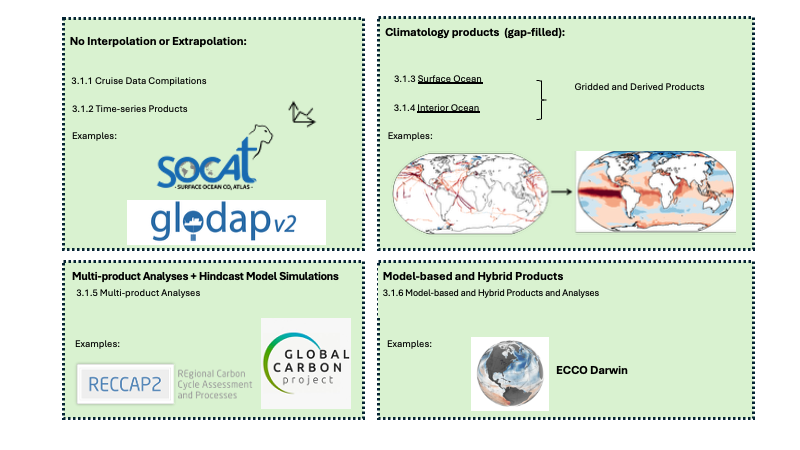
Ocean Carbon & Biogeochemistry
Studying marine ecosystems and biogeochemical cycles in the face of environmental change
  • Home
  • About OCB
    • About Us
    • Get Involved
    • Project Office
    • Code of Conduct
    • Scientific Steering Committee
    • OCB committees
      • Ocean Time-series
      • US Biogeochemical-Argo
      • Ocean-Atmosphere Interaction
    • Scientific Breadth
      • Biological Pump
      • Changing Marine Ecosystems
      • Changing Ocean Chemistry
      • Estuarine and Coastal Carbon Fluxes
      • Ocean Carbon Uptake and Storage
      • Ocean Observatories
  • Activities
    • OCB Webinar Series
    • Summer Workshops
    • Scoping Workshops
      • Ecological Forecasting – North American Coastlines
      • Expansion of BGC-Argo and Profiling Floats
      • Future BioGeoSCAPES program
      • Ocean-Atmosphere Interactions
      • Oceanic Methane & Nitrous Oxide
    • Other Workshops
      • GO-BCG Scoping Workshop
    • Science Planning
      • Coastal CARbon Synthesis (CCARS)
      • North Atlantic-Arctic
    • Ocean Acidification PI Meetings
    • Training Activities
      • PACE Training Activity
  • Small Group Activities
    • Aquatic Continuum OCB-NACP Focus Group
    • Arctic-COLORS Data Synthesis
    • Carbon Isotopes in the Ocean Workshop
    • CMIP6 WG
      • CMIP6 Models Workshop
    • Coastal BGS Obs with Fisheries
    • C-saw extreme events workshop
    • Filling the gaps air–sea carbon fluxes WG
    • Fish, fisheries and carbon
    • Fish Carbon WG
      • Fish Carbon WG Workshop
      • Fish carbon workshop summary
    • Lateral Carbon Flux in Tidal Wetlands
    • Marine carbon dioxide removal
      • Marine CDR Workshop
    • Metaproteomic Intercomparison
    • Mixotrophs & Mixotrophy WG
    • N-Fixation WG
    • Ocean Carbonate System Intercomparison Forum
    • Ocean Carbon Uptake WG
    • Ocean Nucleic Acids ‘Omics
    • OOI BGC sensor WG
    • Phytoplankton Taxonomy WG
  • Science Support
    • Data management and archival
    • Early Career
    • Funding Sources
    • Jobs & Postdocs
    • Meeting List
    • OCB topical websites
      • Ocean Fertilization
      • Trace gases
      • US IIOE-2
    • Outreach & Education
    • Promoting your science
    • Student Opportunities
    • OCB Activity Proposal Solicitations
    • Travel Support
  • Publications
    • Ocean Carbon Exchange
    • Newsletter Archive
    • Science Planning and Policy
    • OCB Workshop Reports
  • OCB Science Highlights
  • News

Archive for time-series

Partitioning carbon export into particulate and dissolved pools from biogeochemical profiling float observations

Posted by mmaheigan 
· Thursday, December 17th, 2020 

Carbon export from the surface into the deep ocean via the biological pump is a significant sink for atmospheric carbon dioxide. The relative contributions of sinking particles—particulate organic carbon (POC) and dissolved organic carbon (DOC)—to the total export affect the efficiency of carbon export.

In a recent study published in Global Biogeochemical Cycles, the authors used measurements from biogeochemical profiling floats in the Northeast Pacific from 2009 to 2017 to estimate net community production (NCP), an analog for carbon export. In order to close three tracer budgets (nitrate, dissolved inorganic carbon, and total alkalinity), the authors combined these float measurements with data from the Ocean Station Papa mooring and recently developed algorithms for carbonate system parameters. By constraining end-member nutrient ratios of the POC and DOC produced, this multi-tracer approach was used to estimate regional NCP across multiple depth horizons throughout the annual cycle, partition NCP into the POC and DOC contributions, and calculate particulate inorganic carbon (PIC) production, a known ballast material for sinking particles (Figure 1). The authors also estimated POC attenuation with depth, POC export across deeper horizons, and in situ export efficiency via a particle backscatter-based approach.

With the advent of “fully-loaded” biogeochemical profiling floats equipped with nitrate, oxygen, pH and bio-optical sensors, this approach may be used to assess the magnitude and efficiency of carbon export in other ocean regions from a single platform, which will greatly reduce the risks and costs associated with traditional ship-based measurements, while broadening the spatiotemporal scales of observation.

Figure caption: Climatological mean NCP (blue line) over the entire study period (2009-2017); the POC portion of NCP (filled blue area), the DOC portion (white space) and PIC production rate (red line), in the mixed layer (left), and the euphotic zone (right). The numbers in parentheses are the integrated annual NCP rates for each curve and uncertainty reported was determined using a Monte Carlo approach.


Authors:
William Haskell (MBARI, now Mote Marine Laboratory)
Andrea Fassbender (MBARI, now PMEL)
Jacki Long (MBARI)
Joshua Plant (MBARI)

How zooplankton control carbon export in the Southern Ocean

Posted by mmaheigan 
· Thursday, December 3rd, 2020 

The Southern Ocean exhibits an inverse relationship between surface primary production and export flux out of the euphotic zone. The causes of this production-export decoupling are still under debate. A recently published mini review in Frontiers in Marine Science focused on zooplankton, an important component of Southern Ocean food webs and the biological pump. The authors compared carbon export regimes from the naturally iron-fertilised Kerguelen Plateau (high surface production, but generally low export) with the iron-limited and less productive high nutrient, low chlorophyll (HNLC) waters south of Australia, where carbon export is relatively high.

Figure 1: The role of zooplankton in establishing the characteristic export regimes at two sites in the Southern Ocean, (a) the highly productive northern Kerguelen Plateau, which exhibits low export, and (b) the iron-limited waters south of Australia with low production, but relatively high carbon export.

Size structure and zooplankton grazing pressure are found to shape carbon export at both sites. On the Kerguelen Plateau, a large size spectrum of zooplankton acts as “gate-keeper” to the mesopelagic by significantly reducing the sinking flux of phytoaggregates, which establishes the characteristic low export regime. In the HNLC waters, however, the zooplankton community is low in biomass and grazes predominantly on smaller particles, which leaves the larger particles for export and leads to relatively high export flux.

Gaps in knowledge related to insufficient seasonal data coverage, understudied carbon flux pathways, and associated mesopelagic processes limit our current understanding of carbon transfer through the water column and export. More integrated data collection efforts, including the use of autonomous profiling floats (e.g., BGC-Argo), stationary moorings, etc., will improve seasonal carbon flux data coverage, thus enabling more reliable estimation of carbon export and storage in the Southern Ocean and improved projection of future changes in carbon uptake and atmospheric carbon dioxide levels.


Authors:
Svenja Halfter (University of Tasmania)
Emma Cavan (Imperial College London)
Ruth Eriksen (CSIRO)
Kerrie Swadling (University of Tasmania)
Philip Boyd (University of Tasmania)

South Pacific particulate organic carbon fate challenges Martin’s Law

Posted by mmaheigan 
· Tuesday, May 14th, 2019 

Joint science highlight with GEOTRACES

Carbon storage in the ocean is sensitive to the depths at which particulate organic carbon (POC) is respired back to CO2 within the twilight zone (100-1000m). For decades, it has been an oceanographic priority to determine the depth scale of this regeneration process. To investigate this, GEOTRACES scientists are deploying new isotopic tools that provide a high-resolution snapshot of POC flux and regeneration across steep biogeochemical gradients in the South Pacific Ocean.

A recent paper in PNAS reported on particulate organic carbon (POC) fluxes throughout the water column (focusing on the upper 1000 m) along the GP16 GEOTRACES section between Peru and Tahiti (Figure 1A).  POC fluxes (Figure 1B) were derived by normalizing concentrations of POC to 230Th following analysis of samples collected by in situ filtration. This work builds on a research theme initiated at the GEOTRACES-OCB synthesis workshop held at Lamont-Doherty Earth Observatory in 2016.

Figure caption: Site map and POC flux characteristics from GEOTRACES GP16 section. Plot A) shows the GP16 station locations as white circles, with nearby sediment trap deployments as black stars, with 2013 MODIS satellite-derived net primary productivity in the background. Plot B) shows POC fluxes from particulate 230Th-normalization from selected stations spanning the zonal extent of the GP16 section. Plot C) shows power law exponent b values for each GP16 station (blue), compared to estimates from bottom-moored sediment traps in the South Pacific (black and red dashed lines), a compilation of sediment traps in the North Pacific (green dashed line), and neutrally buoyant sediment traps in the subtropical North Pacific (yellow shaded band). GP16 regeneration length scales from 230Th-normalization agree most closely with the estimates from neutrally buoyant sediment traps.

The study results show that POC regeneration depth is shallower than anticipated, especially in warm stratified waters of the subtropical gyre. Regeneration depth—expressed in terms of the Martin-curve power-law exponent “b” (Figure 1C)—is shown to be greater than previous estimates (horizontal dashed lines), but similar to values obtained using neutrally buoyant sediment traps at the Hawaii Ocean Time-series Station Aloha. In contrast to the rapid regeneration of POC in warm stratified waters, POC regeneration within the ODZ is below our detection limits. Models have shown that shallower regeneration of POC leads to less efficient carbon storage in the ocean, making the authors speculate that global warming, yielding expanded and more stratified gyres, may induce a reduction of the ocean’s efficacy for carbon storage via the biological pump.


Authors:
Frank J. Pavia, Robert F. Anderson, Sebastian M. Vivancos, Martin Q. Fleisher (Columbia University)
Phoebe J. Lam (University of California Santa Cruz)
B.B. Cael (now at University of Hawai’i Manoa, formerly at MIT)
Yanbin Lu, Pu Zhang, R. Lawrence Edwards (University of Minnesota)
Hai Cheng (University of Minnesota and Xi’an Jiaotong University)

Northeast Pacific time-series reveals episodic events as major player in carbon export

Posted by mmaheigan 
· Tuesday, April 16th, 2019 

Temporal fluctuations in the oceanic carbon budget play an important role in the cycling of organic matter from production in surface waters to consumption and sequestration in the deep ocean. A 29-year time-series (1989-2017) of particulate organic carbon (POC) fluxes and seafloor measurements of oxygen consumption in the abyssal northeast Pacific (Sta. M, 4,000 m depth) recently revealed an increasing proportional contribution from episodic events over the past seven years. From 2011 to 2017, 43% of POC flux arrived during high-magnitude (≥ mean + 2 σ) episodic events. Time lags between changes in satellite-estimated export flux (EF), POC flux to the seafloor, and seafloor oxygen consumption varied from 0 to 70 days among six flux events, which could be attributed to variable remineralization rates and/or particle sinking speeds. The Martin equation, a commonly used model to estimate carbon flux, predicted background fluxes well but missed episodic fluxes, subsequently underestimating the measured fluxes by almost 50% (Figure 1). This study reveals the potential importance of episodic POC pulses into the deep sea in the oceanic carbon budget, which has implications for observing infrastructure, model development, and field campaigns focused on quantifying carbon export.

Figure Caption: (A) Station M POC flux measured from sediment traps compared to Martin model estimates, from 1989 to 2017. (B) Model performance for years with >50% sampling coverage: (POC fluxMartin − POC fluxtrap)/POC fluxtrap 100.


Authors:
Kenneth Smith (MBARI)
Henry Ruhl (MBARI, NOC)
Christine Huffard (MBARI)
Monique Messié (MBARI, Aix Marseille Université)
Mati Kahru (Scripps)


See also https://www.mbari.org/carbon-pulses-climate-models/

Pteropod populations stable or increasing according to long-term study along the Western Antarctic Peninsula

Posted by mmaheigan 
· Thursday, March 21st, 2019 

Shelled pteropods (pelagic snails) are abundant planktonic predators and prey, linking grazers and higher trophic levels and contributing to the carbon cycle via consumption and excretion. Pteropods have been heralded as bioindicators of ocean acidification, given their aragonitic shell’s susceptibility to dissolution, which could ultimately lead to declining abundance. However, pteropod population dynamics are understudied, particularly in the Southern Ocean, a region predicted to be highly impacted by both warming and ocean acidification. In a recent publication in Limnology and Oceanography, long-term data sets from the Western Antarctic Peninsula show that while there is considerable interannual variability in pteropod abundance, populations have remained stable over the past 25 years, with some pteropod species (gymnosomes (non-shelled pteropod) overall, L. antarctica and C. pyramidata (shelled pteropods) regionally) even increasing during this period (Figure 1).


Figure 1. Annual pteropod abundance anomalies for the entire Palmer Antarctica Long-Term Ecological Research (LTER) study region along the Western Antarctic Peninsula. (a) Limacina helicina antarctica (shelled pteropod), (b) Gymnosomes – nonshelled pteropods that prey on shelled pteropods (p = 0.007, r2 = 0.27), and (c) Clio pyramidata (shelled pteropod). Effect of environment on pteropod abundance. (d) SST vs. L. antarctica abundance, e) Sea ice advance vs. L. antarctica and Gymnosome abundance, (f) Sea ice retreat vs. C. pyramidata abundance. Data plotted are annual anomalies for each year of the time series (1993–2017). Sea ice advance is lagged 2-yr behind pteropod abundance (e.g., 2017 pteropod annual anomaly is plotted against 2015 sea ice advance annual anomaly) SST are lagged 1-yr behind L. antarctica abundance (e.g., 2017 L. antarctica annual anomaly is plotted against 2016 SST). Regression lines for significant linear relationships are shown, regression statistics are as follows: (d) SST vs. L. antarctica (circles): n = 25, p = 0.006, r2 = 0.25 (e) sea ice advance vs. L. antarctica (filled-circles) and Gymnosomes (empty-circles): n = 25, p = 0.003, r2 = 0.30 (dashed line); (f) sea ice retreat vs. C. pyramidata (squares): n = 14, p = 0.0003, r2 = 0.64.

There was no significant influence of carbonate chemistry parameters (e.g., aragonite saturation state) on pteropod abundance, since the Western Antarctic Peninsula has yet to experience prolonged conditions characteristic of ocean acidification. However, other environmental factors such as warming and associated sea ice retreat were more influential. For example, warmer, ice-free waters in one year typically led to higher pteropod abundances the following year, suggesting that pteropods may be better adapted than expected to warming conditions due to climate change. The authors propose that earlier sea ice retreat promotes recruitment and subsequent expansion of pteropods further South, which could explain their increased abundance in this subregion. These results increase our understanding of pteropod responses to environmental variability, which is important for predicting future effects of climate change on regional carbon cycling and plankton trophic interactions in the Southern Ocean.


Authors:
Patricia S. Thibodeau (VIMS)
Deborah K. Steinberg (VIMS)
Sharon E. Stammerjohn (University of Colorado at Boulder)
Claudine Hauri (University of Alaska Fairbanks)

Rapid warming and salinity changes mask acidification in Gulf of Maine waters

Posted by mmaheigan 
· Wednesday, February 20th, 2019 

Why don’t we see ocean acidification in over a decade of high-frequency observations in the Gulf of Maine? The answer lies in a recent decade of changes that raised sea surface temperature and salinity, and in turn dampened the expected acidification signal and caused the saturation states of calcite minerals to increase. From 2004 to 2014, sea surface temperatures in the Gulf of Maine were higher than any observations recorded in the region over the past 150 years. This greatly impacted both CO2 solubility and the sea surface carbonate system, as detailed in a recent paper in Biogeochemistry.

Over the 34 years of the time-series, the recent event is extreme, but interannual and decadal salinity and temperature variability also influenced carbonate system parameters, which makes it difficult to isolate and quantify an anthropogenic ocean acidification signal, especially if relying on shorter-term observations (Figure 1).

Figure 1: Modeled ΩAragonite (top panel) and pH (bottom panel) anomalies relative to monthly 2004 data. The red lines show trends prior to and after 2004, after which warming accelerated.

For those with a stake in profiting from or managing extractive resources that are susceptible to ocean acidification such as commercially important lobster and bivalves, understanding how ecosystems will be affected is critical. These analyses clearly demonstrate how physical processes can either accelerate or mitigate ocean carbonate system changes, thus confounding the detection of ocean acidification that is expected from increasing atmospheric carbon dioxide. To assess whether an ecosystem or species is at risk or aided by such processes, it is important to observe, understand, and be able to model all sources of carbonate system variability.

Authors:
Joe Salisbury and Bror Jönsson (Both at Ocean Processes Analysis Laboratory, University of New Hampshire)

Investigating variability and change in subpolar Southern Ocean pCO2 via time-series and float data

Posted by mmaheigan 
· Tuesday, November 6th, 2018 

The Southern Ocean dominates the mean global ocean sink for anthropogenic carbon, but its sparse sampling relative to other basins limits our capacity to quantify carbon uptake and accompanying seasonal to interannual variability, which is critical to predicting future ocean carbon uptake and storage. Since 2002, underway pCO2 measurements collected as part of the Drake Passage Time-series (DPT) Program have informed our understanding of seasonally varying air-sea pCO2 gradients and by inference, the carbon fluxes in this region. Understanding whether Drake Passage air-sea fluxes are representative of the broader subpolar Southern Ocean was the focus of a recent study in Biogeosciences.

Top left panel: Mean surface ocean seasonal pCO2 cycle estimate for datasets from the Surface Ocean CO2 Atlas (SOCAT) in the subpolar Southern Ocean: black- SOCAT within the Drake Passage (DP) region; green- SOCAT outside the DP region; blue- all SOCAT in Southern Ocean Subpolar Seasonally Stratified (SPSS) biome; red- Self Organizing Map Feed-forward Network (SOM-FFN) product. Shading represents 1 standard error for biome-scale monthly means driven by interannual variability. Bar plot indicates the number of years containing observations in a given month (maximum of 15 years).
Top right panel: Mean surface ocean pCO2 seasonal cycle estimate for black: underway Drake Passage Time-series data for years 2002–2016; purple: DPT for years 2016–2017 to match years covered by the floats; and orange: SOCCOM floats. Seasonal cycles are shown on an 18-month cycle, calculated from a monthly mean time series with the atmospheric correction to year 2017. Shading represents 1 standard error accounting for the spatial and temporal heterogeneity of the sample and the measurement error (2.7 % or ±11 µatm at a pCO2 of 400 µatm for floats; ±2 µatm for DPT data) combined using the square root of the sum of squares.

An analysis of available Southern Ocean pCO2 data from inside vs. outside the Drake Passage showed agreement in the timing and amplitude of seasonal pCO2 variations, suggesting that the seasonality so carefully recorded by DPT is in fact representative of the broader subpolar Southern Ocean. DPT’s high temporal resolution sampling is critical to constraining estimates of the seasonal cycle of surface pCO2 in this region, as wintertime underway pCO2 data remain sparse outside the Drake Passage. Comparisons of the DPT data to an emerging dataset of float-estimated pCO2 from the SOCCOM (Southern Ocean Carbon and Climate Observations and Modeling) project showed that both shipboard and autonomous platforms capture the expected seasonal cycle for the subpolar Southern Ocean, with an austral wintertime peak driven by deep mixing and a summertime low driven by biological uptake. However, the seasonal cycle derived from float-estimated pCO2 has a larger seasonal amplitude compared to the DPT data due to an earlier and much lower observed summertime minimum.

The Drake Passage Time-series illustrates the large variability of surface ocean pCO2 in the Southern Ocean and exemplifies the value of sustained observations for understanding changing ocean carbon uptake in this dynamic region. Coordinated monitoring efforts that combine a robust ship-based observational network with a well-calibrated array of autonomous biogeochemical floats will improve and expand our understanding of the Southern Ocean carbon cycle in the future.

Authors:
Amanda R. Fay (Lamont Doherty Earth Observatory)
Nicole S. Lovenduski (University of Colorado)
Galen A. McKinley (Lamont Doherty Earth Observatory)
David R. Munro (University of Colorado)
Colm Sweeney (University of Colorado, NOAA Earth System Research Laboratory)
Alison R. Gray (University of Washington)
Peter Landschützer (Max Planck Institute for Meteorology, Germany)
Britton B. Stephens (National Center for Atmospheric Research)
Taro Takahashi (Lamont Doherty Earth Observatory)
Nancy Williams (Oregon State University)

Shipboard LiDAR: A powerful tool for measuring the distribution and composition of particles in the ocean

Posted by mmaheigan 
· Tuesday, October 23rd, 2018 

Despite major advances in ocean observing capabilities, characterizing the vertical distribution of materials in the ocean with high spatial resolution remains challenging. Light Detection and Ranging (LiDAR), a technique that relies on measurement of the “time-of-flight” of a backscattered laser pulse to determine the range to a scattering object, could potentially fill this critical gap in our sampling capabilities by providing remote estimates of the vertical distribution of optical properties and suspended particles in the ocean.

A recent article in Remote Sensing of Environment details the development of a portable shipboard LiDAR and its capabilities for extending high-frequency measurements of scattering particles into the vertical dimension. The authors deployed the experimental system (shown in Figure 1a) during research cruises off the coast of Virginia and during a passenger ferry crossing of the Gulf of Maine (associated with the Gulf of Maine North Atlantic Time Series program-GNATS). Remote measurements of LiDAR signal attenuation corresponded well with simultaneous in situ measurements of water column optical properties and proxies for the concentration of suspended particles. Interestingly, the researchers also observed that the extent to which the return signal was depolarized (also known as the LiDAR depolarization ratio) may provide information regarding the composition of particles within the scattering volume. This is evidenced by the strong relationship between the depolarization ratio and the backscattering ratio, an indicator of the bulk composition (mineral vs. organic) of the particles within a scattering medium (Figure 1b).

Figure 1. a) LiDAR system deployed to look through a chock at the bow of the M/V Nova Star. b) Relationship between the LiDAR linear depolarization ratio (ρ) and coincident measurements of the particulate backscattering ratio (bbp/bp). The black line represents a least-squares exponential fit to the data.

As LiDAR technology becomes increasingly rugged, compact, and inexpensive, the regular deployment of oceanographic LiDAR on a variety of sampling platforms will become an increasingly practical method for characterizing the vertical and horizontal distribution of particles in the ocean. This has the potential to greatly improve our ability to investigate the role of particles in physical and biogeochemical oceanographic processes, especially when sampling constraints limit observations to the surface ocean.


Authors:
Brian L. Collister (Old Dominion University)
Richard C. Zimmerman (Old Dominion University)
Charles I. Sukenik (Old Dominion University
Victoria J. Hill (Old Dominion University)
William M. Balch (Bigelow Laboratory for Ocean Sciences)

Primary productivity à la mode

Posted by mmaheigan 
· Wednesday, October 10th, 2018 

The presence of large-scale Ekman downwelling is the textbook explanation for low nutrient concentrations, and hence low productivity, in subtropical gyres. However, recent research has suggested that mesoscale eddies oppose and substantially reduce this downwelling, a process known as eddy cancellation (Doddridge et al, 2016). Eddy cancellation represents a substantial alteration to the widely accepted notion of large-scale Ekman downwelling in subtropical gyres, and motivates our study of the processes that determine nutrient concentration within subtropical gyres.

Figure 1: Sensitivity experiments for mode water thickness (hmode) with two values of residual Ekman pumping. a) With no residual Ekman pumping, phosphate concentration responds strongly to mode water thickness. b) When Ekman pumping is strong, phosphate concentration does not depend on mode water thickness. The dashed lines represent transects of climatological phosphate concentration in the euphotic zone of the North Atlantic subtropical gyre (Garcia et al., 2013).

A recent paper published in the Journal of Geophysical Research: Oceans and featured in an MIT News article describes an idealized model for nutrient concentration in subtropical gyres that can account for this reduction in Ekman pumping. The model predicts that surface productivity is sensitive to the thickness of the underlying subtropical mode water layer, provided that the residual Ekman pumping is small (Figure 1). Comparison of this prediction with observations from the Bermuda Atlantic Time series Study (BATS) shows that surface productivity increases as the thickness of the underlying mode water increases (Figure 2), as predicted by the idealized model in the absence of substantial Ekman pumping.

Figure 2: Annually averaged primary productivity and mode water thickness from the BATS dataset. The linear fit between mode water thickness and primary productivity is statistically significant (p ≈ 0.027) and explains 19.5% of the variance in primary productivity.

The observed relationship between productivity and mode water thickness at BATS is consistent with a small residual Ekman pumping, indicating highly effective eddy cancellation in the subtropical North Atlantic. Previous research (Palter et al., 2005) has suggested that as the subtropical mode water layer thickens, it blocks nutrient entrainment from below, resulting in lower productivity in the euphotic zone. However, this study suggests that a thicker subtropical mode water layer actually increases the surface nutrient concentrations by promoting more effective recycling of nutrients within the gyre. With a thicker mode water layer, more of the nutrients in the particulate flux are remineralized before they pass through the thermocline and become isolated from the surface ocean. This means that a thicker mode water layer leads to higher nutrient concentrations and supports primary productivity in subtropical gyres. This represents a fundamental change in our understanding of how nutrients are supplied to the surface waters of subtropical gyres.

Authors:
Edward Doddridge (Department of Earth, Atmospheric and Planetary Sciences, MIT)
David Marshall (Atmospheric, Oceanic & Planetary Physics, University of Oxford)

See the Eos spotlight on this research

Shelf-wide pCO2 increase across the South Atlantic Bight

Posted by mmaheigan 
· Thursday, August 2nd, 2018 

Relative to their surface area, coastal regions represent some of the largest carbon fluxes in the global ocean, driven by numerous physical, chemical and biological processes. Coastal systems also experience human impacts that affect carbon cycling, which has large socioeconomic implications. The highly dynamic nature of these systems necessitates observing approaches and numerical methods that can both capture high-frequency variability and delineate long-term trends.

Figure 1: The South Atlantic Bight (SAB) was divided into four sections using isobaths: the coastal zone (0 to 15 m), the inner shelf (15 to 30 m), the middle shelf (30 to 60 m), and the outer shelf (60 m and beyond). The X’s indicate the locations of the Gray’s Reef mooring (southern X) and the Edisto mooring (northern X).

In two recent studies using mooring- and ship-based ocean CO2 system data, authors observed that pCO2 is increasing from the coastal zone to the outer shelf of the South Atlantic Bight at rates greater than the global average oceanic and atmospheric increase (~1.8 µatm y-1). In recent publications in Continental Shelf Research and JGR-Oceans, the authors analyzed pCO2 data from 46 cruises (1991-2016) using a novel linear regression technique to remove the seasonal signal, revealing an increase in pCO2 of 3.0-3.7 µatm y-1 on the outer and inner shelf, respectively. Using a Generalized Additive Mixed Model (GAMM) approach for trend analysis, authors observed that the rates of increase were slightly higher than the deseasonalization technique, yielding pCO2 increases of 3.3 to 4.5 µatm y-1 on the outer and inner shelf, respectively. The reported pCO2 increases result in potential pH decreases of -0.003 to -0.004 units y-1.

Figure 2: The time series of fCO2 in the four regions of the SAB (cruise observations) and from the Gray’s Reef mooring on the inner shelf indicate an increase across the shelf. These data are the observed values, however, the trend lines for each time series are calculated using deseasonalized values using the reference year method.

Analysis of the pCO2 time-series from the Gray’s Reef mooring (using a NOAA Moored Autonomous pCO2 system from July 2006 -July 2015) yielded a rate of increase (3.5 ± 0.9 µatm y-1) that was comparable to the cruise data on the inner shelf (3.7 ± 2.2 and 4.5 ± 0.6 µatm y-1, linear and GAMM methods, respectively). Validation data collected at the mooring suggest that underway data from cruises and the moored data are comparable. Neither thermal processes nor atmospheric dissolution (the primary driver of oceanic acidification) can explain the observed pCO2 increase and concurrent pH decrease across the shelf. Unlike the middle and outer shelves, where an increase in SST could account for up to 1.1 µatm y-1 of the observed pCO2 trend, there is no thermal influence in the coastal zone and inner shelf. While 1.8 µatm y-1 could be attributed to the global average atmospheric increase, the remainder is likely due to transport from coastal marshes and in situ biological processes.  As the authors have shown, the increasing coastal and oceanic trend in pCO2 can lead to a decrease in pH, especially if there is no increase in buffering capacity.  More acidic waters can have a long term affect on coastal ecosystem services and biota.

Also see Eos Editor’s Vox on this research by Peter Brewer https://eos.org/editors-vox/coastal-ocean-warming-adds-to-co2-burden

Authors:

Multidecadal fCO2 Increase Along the United States Southeast Coastal Margin (JGR-Oceans)
Janet J. Reimer (University of Delaware)
Hongjie Wang (Texas A &M University – Corpus Christi)
Rodrigo Vargas (University of Delaware)
Wei-Jun Cai (University of Delaware)

And

Time series pCO2 at a coastal mooring: Internal consistency, seasonal cycles, and interannual variability (Continental Shelf Research)
Janet J. Reimer (University of Delaware)
Wei-Jun Cai (University of Delaware; University of Georgia)
Liang Xue (University of Delaware; First Institute of Oceanography, China)
Rodrigo Vargas (University of Delaware)
Scott Noakes (University of Georgia)
Xinping Hu (Texas A &M University – Corpus Christi)
Sergio R. Signorini (Science Applications International Corporation)
Jeremy T. Mathis (NOAA Arctic Research Program)
Richard A. Feely (NOAA Pacific Marine Environmental Laboratory)
Adrienne J. Sutton (NOAA Pacific Marine Environmental Laboratory; University of Washington)
Christopher Sabine (University of Hawaii Manoa)
Sylvia Musielewicz (NOAA Pacific Marine Environmental Laboratory; University of Washington)
Baoshan Chen (University of Delaware; University of Georgia)
Rik Wanninkhof (NOAA Atlantic Oceanographic and Meteorological Laboratory)

Next Page »

Filter by Keyword

234Th disequilibrium abundance acidification africa air-sea flux air-sea interactions air-sea interface algae alkalinity allometry ammonium AMOC anoxia anoxic Antarctic anthro impacts anthropogenic carbon aquaculture aragonite saturation arctic Argo argon arsenic artificial seawater Atlantic Atlantic modeling atmospheric carbon atmospheric CO2 atmospheric nitrogen deposition authigenic carbonates autonomous platforms bacteria BATS benthic bgc argo bio-go-ship bio-optical bioavailability biogeochemical cycles biogeochemical cycling biogeochemical models biogeochemistry Biological Essential Ocean Variables biological pump biological uptake biophysics bloom blooms blue carbon bottom water boundary layer buffer capacity C14 CaCO3 calcification calcite calcium carbonate carbon-climate feedback carbon-sulfur coupling carbon budget carbon cycle carbon dioxide carbon export carbon sequestration carbon storage Caribbean CCA CCS changi changing marine ecosystems changing marine environments changing ocean chemistry chemical oceanographic data chemical speciation chemoautotroph chesapeake bay chl a chlorophyll circulation climate change climate variability CO2 CO2YS coastal darkening coastal ocean cobalt Coccolithophores community composition conservation cooling effect copepod coral reefs CTD currents cyclone data data access data management data product Data standards DCM dead zone decadal trends decomposers decomposition deep convection deep ocean deep sea coral deoxygenation depth diagenesis diatoms DIC diel migration diffusion dimethylsulfide dinoflagellate discrete measurements dissolved inorganic carbon dissolved organic carbon DOC DOM domoic acid dust DVM earth system models ecology ecosystems ecosystem state eddy Education Ekman transport emissions ENSO enzyme equatorial regions error ESM estuarine and coastal carbon estuarine and coastal carbon fluxes estuary euphotic zone eutrophication evolution export export fluxes export production EXPORTS extreme events extreme weather events faecal pellets filter feeders filtration rates fire fish Fish carbon fisheries floats fluid dynamics fluorescence food webs forage fish forams freshening freshwater frontal zone fronts functional role future oceans geochemistry geoengineering geologic time GEOTRACES glaciers gliders global carbon budget global ocean global warming go-ship grazing greenhouse gas Greenland groundwater Gulf of Maine Gulf of Mexico Gulf Stream gyre harmful algal bloom high latitude human food human impact hurricane hydrogen hydrothermal hypoxia ice age ice cores ice cover industrial onset inverse circulation ions iron iron fertilization isotopes jellies katabatic winds kelvin waves krill kuroshio laboratory vs field land-ocean continuum larvaceans lateral transport LGM lidar ligands light light attenuation lipids mangroves marine carbon cycle marine heatwave marine particles marine snowfall marshes Mediterranean meltwater mesopelagic mesoscale metagenome metals methane methods microbes microlayer microorganisms microscale microzooplankton midwater mixed layer mixed layers mixing mixotrophy modeling models mode water molecular diffusion MPT multi-decade n2o NAAMES NASA NCP net community production net primary productivity new ocean state new technology Niskin bottle nitrate nitrogen nitrogen fixation nitrous oxide north atlantic north pacific nuclear war nutricline nutrient budget nutrient cycling nutrient limitation nutrients OA ocean-atmosphere ocean acidification ocean acidification data ocean carbon uptake and storage ocean color ocean observatories ocean warming ODZ oligotrophic omics OMZ open ocean optics organic particles oscillation overturning circulation oxygen pacific paleoceanography particle flux pCO2 PDO peat pelagic PETM pH phenology phosphorus photosynthesis physical processes physiology phytoplankton PIC plankton POC polar regions pollutants precipitation predation prediction primary production primary productivity Prochlorococcus proteins pteropods pycnocline radioisotopes remineralization remote sensing repeat hydrography residence time resource management respiration resuspension rivers rocky shore Rossby waves Ross Sea ROV salinity salt marsh satell satellite scale seafloor seagrass sea ice sea level rise seasonal patterns seasonal trends sea spray seaweed sediments sensors shelf system shells ship-based observations shorelines silicate silicon cycle sinking particles size SOCCOM soil carbon southern ocean south pacific spatial covariations speciation SST stoichiometry subduction submesoscale subpolar subtropical sulfate surf surface surface ocean Synechococcus teleconnections temperate temperature temporal covariations thermocline thermodynamics thermohaline thorium tidal time-series time of emergence top predators total alkalinity trace elements trace metals trait-based transfer efficiency transient features Tris trophic transfer tropical turbulence twilight zone upper ocean upper water column upwelling US CLIVAR validation velocity gradient ventilation vertical flux vertical migration vertical transport volcano warming water clarity water quality waves western boundary currents wetlands winter mixing world ocean compilation zooplankton

Copyright © 2023 - OCB Project Office, Woods Hole Oceanographic Institution, 266 Woods Hole Rd, MS #25, Woods Hole, MA 02543 USA Phone: 508-289-2838  •  Fax: 508-457-2193  •  Email: ocb_news@us-ocb.org

link to nsflink to noaalink to WHOI

Funding for the Ocean Carbon & Biogeochemistry Project Office is provided by the National Science Foundation (NSF) and the National Aeronautics and Space Administration (NASA). The OCB Project Office is housed at the Woods Hole Oceanographic Institution.