Ocean Carbon & Biogeochemistry
Studying marine ecosystems and biogeochemical cycles in the face of environmental change
  • Home
  • About OCB
    • About Us
    • Scientific Breadth
      • Biological Pump
      • Changing Marine Ecosystems
      • Changing Ocean Chemistry
      • Estuarine and Coastal Carbon Fluxes
      • Ocean Carbon Uptake and Storage
      • Ocean Observatories
    • Code of Conduct
    • Get Involved
    • Project Office
    • Scientific Steering Committee
    • OCB committees
      • Ocean Time-series
      • US Biogeochemical-Argo
      • Ocean-Atmosphere Interaction
  • Activities
    • Summer Workshop
    • OCB Webinars
    • Guidelines for OCB Workshops & Activities
    • Topical Workshops
      • CMIP6 Models Workshop
      • Coastal BGS Obs with Fisheries
      • C-saw extreme events workshop
      • Ecological Forecasting – North American Coastlines
      • Expansion of BGC-Argo and Profiling Floats
      • Fish, fisheries and carbon
      • Future BioGeoSCAPES program
      • GO-BCG Scoping Workshop
      • Lateral Carbon Flux in Tidal Wetlands
      • Marine CDR Workshop
      • Ocean Nucleic Acids ‘Omics
      • Ocean-Atmosphere Interactions
      • Oceanic Methane & Nitrous Oxide
    • Small Group Activities
      • Aquatic Continuum OCB-NACP Focus Group
      • Arctic-COLORS Data Synthesis
      • BECS Benthic Ecosystem and Carbon Synthesis WG
      • Carbon Isotopes in the Ocean Workshop
      • CMIP6 WG
      • Filling the gaps air–sea carbon fluxes WG
      • Fish Carbon WG
        • Fish Carbon WG Workshop
        • Fish carbon workshop summary
      • Marine carbon dioxide removal
      • Metaproteomic Intercomparison
      • Mixotrophs & Mixotrophy WG
      • N-Fixation WG
      • Ocean Carbonate System Intercomparison Forum
      • Ocean Carbon Uptake WG
      • OOI BGC sensor WG
      • Operational Phytoplankton Observations WG
      • Phytoplankton Taxonomy WG
    • Other Workshops
    • Science Planning
      • Coastal CARbon Synthesis (CCARS)
      • North Atlantic-Arctic
    • Ocean Acidification PI Meetings
    • Training Activities
      • PACE Training Activity
  • Science Support
    • Data management and archival
    • Early Career
    • Funding Sources
    • Jobs & Postdocs
    • Meeting List
    • OCB Topical Websites
      • Ocean Fertilization
      • Trace gases
      • US IIOE-2
    • Outreach & Education
    • Promoting your science
    • Student Opportunities
    • OCB Activity Proposal Solicitations
      • Guidelines for OCB Workshops & Activities
    • Travel Support
  • Publications
    • Ocean Carbon Exchange
    • OCB Workshop Reports
    • Science Planning and Policy
    • Newsletter Archive
  • OCB Science Highlights
  • News

Archive for arctic

Contrasting N2O fluxes of source vs. sink in western Arctic Ocean during summer 2017

Posted by mmaheigan 
· Wednesday, October 20th, 2021 

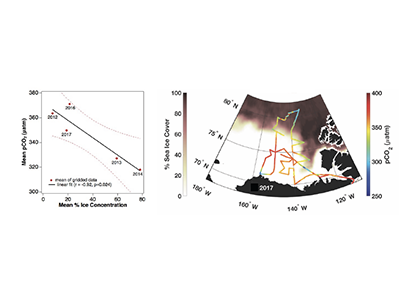
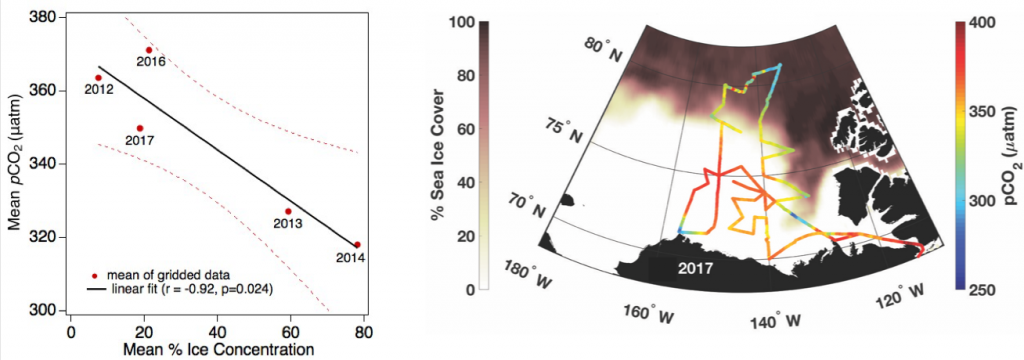
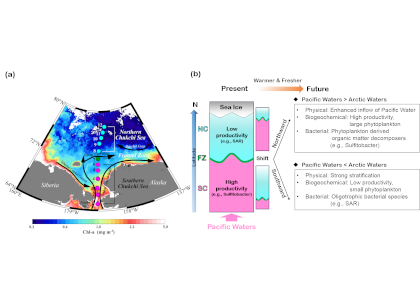
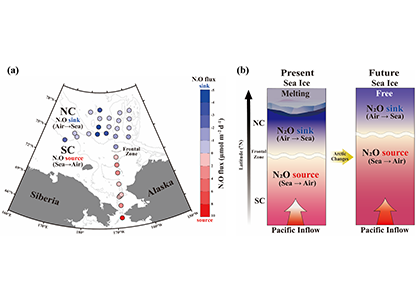
During the western Arctic summer season both physical and biogeochemical features differ with latitude between the Bering Strait and Chukchi Borderland. The southern region (Bering Strait to the Chukchi Shelf) is relatively warm, saline, and eutrophic, due to the intrusion of Pacific waters that bring heat and nutrients in to the western Arctic Ocean (WAO). Because of the Pacific influence, the WAO is one of the most productive stretches of ocean in the world. In contrast, the northern region (Chukchi Borderland to the Canada Basin) is primarily influenced by freshwater originating from sea ice melt and rivers, and is relatively cold, fresh, and oligotrophic. A frontal zone exists between the southern region and northern region (~73°N) due to the distinct physicochemical contrast between mixing Pacific waters and freshwater. These regions support distinct bacterial communities also, making the environmental variations drivers extremely relevant to nitrous oxide (N2O) dynamics.

A recent study published in Scientific Reports examined the role of the WAO as a source and a sink of atmospheric N2O. There are obvious differences in N2O fluxes between southern Chukchi Sea (SC) and northern Chukchi Sea (NC). In the SC (Pacific water characteristics dominate) N2O emissions act as a net source to the atmosphere (Figure 1a). In the NC (freshwater dominant) absorption of atmospheric N2O into the water column suggests that this region acts as a net sink (Figure 1a). The positive fluxes of SC occurred with relatively high sea surface temperature (SST), sea surface salinity (SSS), and biogeochemically-derived N2O production, whereas the negative fluxes of NC were associated with relatively low SST, SSS, and little N2O production. These linear relationships between N2O fluxes and environmental variables suggest that summer WAO N2O fluxes are remarkably sensitive to environmental changes.

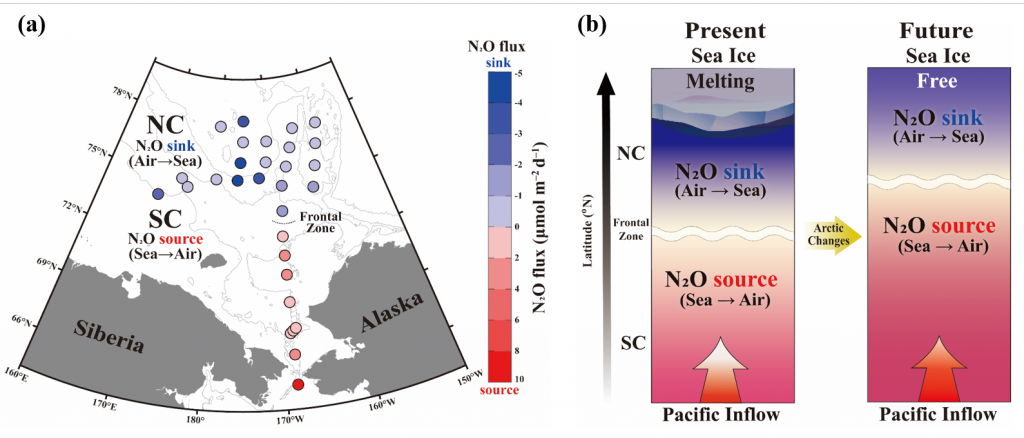
Figure 1. (a) Map of the sampling stations using the Ice Breaking R/V Araon during August 2017. The sampling locations were coloured with N2O fluxes (blue to red gradient, see color bar; sink, air → sea (−), and source, sea → air (+). The southern Chukchi Sea (SC) extends from Bering Strait to Chukchi Shelf and the northern Chukchi Sea (NC) extends from Chukchi Borderland and Canada Basin. The frontal zone arises between SC and NC (black dotted line). (b) Illustration showing future changes in the distribution of the WAO N2O flux constrained by the positive feedback scenario of increasing inflow of Pacific waters and rapidly declining sea-ice extent under accelerating Arctic warming.

This study suggests a potential scenario for future WAO changes in terms of accelerating Arctic change. Increasing inflow of the Pacific waters and rapidly declining sea-ice extent are critical. The increasing inflow of warm nutrient-enriched Pacific waters will likely extend the SC N2O source region northward, increasing productivity, and thereby intensifying nitrification. All of which would lead to a strengthening of the WAO’s role as an N2O source. A rapid loss of the sea ice extent could ultimately lead to a sea-ice-free NC, and again, a northward shift, which would result in a diminished role of the NC as an N2O sink (Figure 1b). While improving our understanding of WAO N2O dynamics, this study suggests both a direction for future work and a clear need for a longer-term study to answer questions about both seasonal variations in these dynamics and possible interannual to climatological trends.


Authors:
Jang-Mu Heo (Department of Marine Science, Incheon National University)
Sang-Min Eom (Department of Marine Science, Incheon National University)
Alison M. Macdonald (Woods Hole Oceanographic Institution)
Hyo-Ryeon Kim (Department of Marine Science, Incheon National University)
Joo-Eun Yoon (Department of Marine Science, Incheon National University)
Il-Nam Kim (Department of Marine Science, Incheon National University)

Sea ice loss and the changing Arctic carbon cycle

Posted by mmaheigan 
· Friday, September 18th, 2020 

Loss of Arctic Ocean ice cover is altering the carbon cycle in ways that are not well understood. Effectively “popping the top off” the Arctic Ocean, ice loss exposes the sea surface to warming and exchange of CO2 with the atmosphere. These processes are expected to increase CO2 levels in the Arctic Ocean, changing its contribution to the global carbon cycle, but limited data collection in the region has thus far precluded the establishment of a clear relationship between CO2 and ice cover. In a recent study published in Geophysical Research Letters, authors report on observed partial pressure of CO2 (pCO2) trends from several years of data collection in the surface waters of the Canada Basin of the Arctic Ocean. These data show that the pCO2 is higher during years when ice cover is low. Uptake of atmospheric CO2 and heating are the primary sources of the CO2 increase, with only a small counteracting offset from biological production. These processes vary significantly from year to year, masking the likely increase in pCO2 over time. Based on these results, we can expect that, while the Arctic Ocean has thus far been a significant sink for atmospheric CO2, if ice loss continues the uptake of CO2 will diminish in coming years.

Figure caption: Sea surface pCO2 increases with decreasing ice concentration (left), determined using the mean of spatially gridded data. The sea surface pCO2 data were collected on five research cruises on the Canadian icebreaker, CCGS Louis S. St-Laurent, from 2012 to 2017 (shown at right for 2017). The pCO2 levels are indicated by the color along the ship cruise track (right color bar). The dark shading (left color bar) represents sea ice concentration averaged from the daily satellite data collected during the cruise.

Authors:
Michael DeGrandpre (University of Montana-Missoula)
Wiley Evans (Hakai Institute)
Mary-Louise Timmermans (Yale University)
Richard Krishfield (Woods Hole Oceanographic Institution)
Bill Williams (Institute of Ocean Sciences)
Michael Steele (University of Washington)

Arctic rivers as carbon highways

Posted by mmaheigan 
· Tuesday, June 16th, 2020 

Rapid environmental changes in the Arctic will potentially alter the atmospheric emissions of heat-trapping greenhouse gases such as methane (CH4) and carbon dioxide (CO2). A recent study on the Canadian Arctic published in Geophysical Research Letters reveals that spring meltwater delivery drives episodic outgassing events along the lake-river-bay continuum. This spring runoff period is not well-represented in prior studies, which, due to ease of sampling access, have focused more on summertime low-ice conditions. Study authors established a community-based monitoring program in Cambridge Bay and an adjacent inflowing river system in Nunavut, Canada from 2017-2018. These time-series data revealed that at the onset of the melt season river water contains methane concentrations up to 2000 times higher than observed in the bay from late summer through early spring (Figure 1 panel a). In addition, the authors deployed a novel robotic chemical sensing kayak (the ChemYak) in the Bay for five days in 2018 to densely sample water CH4 and CO2 levels in space and time during the spring thaw (Figure 1 panel b). The ChemYak observations revealed that river water containing elevated levels of both of these greenhouse gases flowed into the bay and outgassed to the atmosphere over a period of 5 days! The authors estimate that river inflow during the short melt season drives >95% of all annual methane emissions from the bay. These results demonstrate the need for seasonally-resolved sampling to accurately quantify greenhouse gas emissions from polar systems.

Figure 1: Panel a) Measurements of methane concentration in Cambridge Bay and an adjacent river showed strong seasonality; elevated concentrations were associated with river inflow at the start of the freshet. Panel b) Observations with the ChemYak robotic surface vehicle in Cambridge Bay revealed that excess methane was rapidly ventilated to the atmosphere following ice melt in the bay.


Authors
Cara Manning (University of British Columbia)
Victoria Preston (Woods Hole Oceanographic Institution and Massachusetts Institute of Technology)
Samantha Jones (University of Calgary)
Anna Michel (Woods Hole Oceanographic Institution)
David Nicholson (Woods Hole Oceanographic Institution)
Patrick Duke (University of Calgary and University of Victoria)
Mohamed Ahmed (University of Calgary)
Kevin Manganini (Woods Hole Oceanographic Institution)
Brent Else (University of Calgary)
Philippe Tortell (University of British Columbia)

Surface bacterial communities respond to rapid changes in the western Arctic

Posted by mmaheigan 
· Tuesday, January 7th, 2020 

During the western Arctic summer open water season, latitudinal differences in the physical and biogeochemical features of the surface water are apparent from the Bering Strait to the Chukchi Borderland. Lower latitude regions (i.e. Bering Strait to Chukchi Shelf) are primarily driven by the inflow of Pacific waters that supply nutrients and heat, leading to high primary production. Conversely, the higher latitude regions (i.e. Chukchi Borderland and Canada Basin) are relatively cold, fresh, and oligotrophic because the surface layer is influenced by freshwater inputs from melting ice and rivers via the Beaufort Gyre. Mixing of the two surface water masses in the western Arctic produces a physicochemical frontal zone (FZ) in the Chukchi Sea.

In a recent study published in Scientific Reports, authors used observations from summer 2017 to investigate latitudinal variations in bacterial community composition in surface waters between the Bering Strait and Chukchi Borderland and the underlying processes driving the changes. Results indicate three distinctive communities: 1) Southern Chukchi (SC) bacterial communities are associated with nutrient-rich conditions, including genera such as Sulfitobacter; 2) a northern Chukchi (NC) bacterial community that dominated by SAR clades, Flavobacterium, Paraglaciecola, and Polaribacter, genera associated with low nutrients and sea ice conditions. If climate-driven changes in the western Arctic continue along the same trajectory, it’s likely we will see altered bacterial communities. If the impact of warm, nutrient-rich Pacific water inflows dominates, it is likely that the productive SC region will expand ­­and the FZ will move northward, leading to nutrient enrichment in the western Arctic (Figure 1). In response, bacterial communities would be dominated by organic matter decomposers, such as Sulfitobacter, due to high primary productivity. However, if the impact of sea-ice meltwater dominates, then the oligotrophic NC region will expand and the FZ will move southward, leading to nutrient depletion in western Arctic surface waters (Figure 1). Continued monitoring in this region will enhance our understanding of how bacterial communities respond (Figure 1b) to a rapidly changing western Arctic Ocean.

Figure 1. (a) Map of the August 2017 Ice Breaker RV Araon western Arctic Ocean sampling stations used in this study. The basemap shows the Chl-a concentration contour (blue to red background colors). Pink, green, and blue circles represent stations in the South Chukchi (SC), Frontal Zone (FZ), and Northern Chukchi (NC) regions. (b) Schematic diagram of surface bacterial community distribution in response to future western Arctic Ocean changes.

Authors:
Il-Nam Kim (Department of Marine Science, Incheon National University)
Sung-Ho Kang (Korea Polar Research Institute)
Eun Jin Yang (Korea Polar Research Institute)

Evidence against an Arctic Ocean methane bomb

Posted by mmaheigan 
· Tuesday, February 5th, 2019 

Gas hydrates are an ice-like storehouse of the greenhouse gas methane found in continental margins of the world ocean. Warming waters can cause hydrates to decompose and release ancient methane to overlying sediment and waters. The continental shelves of the Arctic Ocean have been thought of as “ground zero” for the potential release of methane from hydrates, since the Arctic is warming rapidly and hydrates are found at relatively shallow water depths there. Another potential ancient methane input to Arctic shelf waters is the methane produced by microorganisms from the gradual thawing of permafrost carbon within seafloor sediment and/or transported to the shelf from terrestrial permafrost via rivers. But, can large stores of ancient-sourced methane reach surface waters and enter the atmosphere, contributing to greenhouse warming?

Figure caption: Map showing the fraction of methane in each surface water sample that was derived from ancient hydrate or permafrost, on a scale from 0 (modern, 0% ancient; indigo) to 1 (100% ancient; yellow). While some of the near-shore surface methane samples have a significant (~50%) ancient component, in waters deeper than 20 m, the surface water methane was mostly (90-95%) derived from modern sources.

To answer this question and understand the role of these ancient sources of methane (hydrates and permafrost), the authors of a 2018 study in Science Advances measured the natural abundance of radiocarbon (14C) in dissolved methane in the shallow shelf waters of the Alaskan Arctic Ocean (U.S. Beaufort Sea); methane derived from ancient sources has little to no measurable 14C because of radioactive decay over time. The 14C-methane results show that ancient sources are contributing methane to the study area’s waters, as the authors predicted. However, ancient methane emitted to seawater can be consumed by microorganisms or transported away by currents before reaching the atmosphere, though these mechanisms have not been known to be effective at removing methane in waters <100 m. This study revealed that these removal processes are surprisingly efficient in shallow shelf waters, especially at the study area’s deepest stations of 30 and 40 m depth, where only ~10% of the methane in surface waters was derived from ancient sources. These results add to a growing body of evidence against the likelihood of a large methane emission to the atmosphere occurring from ancient sources like hydrates, since the authors expect that methane removal processes in the water column are much more efficient in waters 100s of meters deep, where the bulk of the hydrate reservoir resides.


Authors:
K.J. Sparrow (University of Rochester; current address: Florida State University)
J.D. Kessler (University of Rochester)
J.R. Southon (University of California Irvine)
Garcia-Tigreros (University of Rochester)
K.M. Schreiner (University of Minnesota Duluth)
C.D. Ruppel (USGS)
J.B. Miller (University of Colorado Boulder; NOAA)
S.J. Lehman (University of Colorado Boulder)
Xu (University of California Irvine)

Arctic surface waters release methane but also absorb 2,000 times the CO2 for a net cooling effect

Posted by mmaheigan 
· Thursday, September 28th, 2017 

A recent study by Pohlman et al. published in PNAS showed that ocean waters near the surface of the Arctic Ocean absorbed 2,000 times more carbon dioxide (CO2) from the atmosphere than the amount of methane released into the atmosphere from the same waters. The study was conducted near Norway’s Svalbard Islands, which overly numerous seafloor methane seeps.

Methane is a more potent greenhouse gas than CO2, but the removal of CO2 from the atmosphere where the study was conducted more than offset the potential warming effect of the observed methane emissions. During the study, scientists continuously measured the concentrations of methane and CO2 in near-surface waters and in the air just above the ocean surface. The measurements were taken over methane seeps fields at water depths ranging from 260 to 8530 feet (80 to 2600 meters).

Figure 1. Ocean waters overlying shallow-water methane seeps (white dots) offshore from the Svalbard Islands absorb substantially more atmospheric carbon dioxide than the methane that they emit to the atmosphere. Colors indicate the strength of the negative greenhouse warming potential associated with carbon dioxide influx to these surface waters relative to the positive greenhouse warming potential associated with the methane emissions. Gray shiptracks have background values for the relative greenhouse warming potential.

Analysis of the data confirmed that methane was entering the atmosphere above the shallowest (water depth of 260-295 feet or 80-90 meters) Svalbard margin seeps. The data also showed that significant amounts of CO2 were being absorbed by the waters near the ocean surface, and that the cooling effect resulting from CO2 uptake is up to 230 times greater than the warming effect expected from the methane emitted.

Most previous studies have focused only on the sea-air flux of methane overlying seafloor seep sites and have not accounted for the drawdown of CO2 that could offset some of the atmospheric warming potential of the methane. Phytoplankton appeared to be more active in the near-surface waters overlying the seafloor methane seeps, which would explain why so much carbon dioxide was being absorbed. Physical and biogeochemical measurements of near-surface waters overlying the seafloor methane seeps showed strong evidence of upwelling of cold, nutrient-rich waters from depth, stimulating phytoplankton activity and increasing CO2 drawdown. This study was the first to document this CO2 drawdown mechanism in a methane source region.

“If what we observed near Svalbard occurs more broadly at similar locations around the world, it could mean that methane seeps have a net cooling effect on climate, not a warming effect as we previously thought,” said USGS biogeochemist John Pohlman, the paper’s lead author. “We are looking forward to testing the hypothesis that shallow-water methane seeps are net greenhouse gas sinks in other locations.”


Authors:
John W. Pohlman (USGS Woods Hole Coastal & Marine Science Center)
Jens Greinert (GEOMAR, Univ. of Tromsø, Royal Netherlands Institute for Sea Research)
Carolyn Ruppel (USGS Woods Hole Coastal & Marine Science Center)
Anna Silyakova (Univ. of Tromsø)
Lisa Vielstädte (GEOMAR)
Michael Casso (USGS Woods Hole Coastal & Marine Science Center)
Jürgen Mienert (Univ. of Tromsø)
Stefan Bünz (Univ. of Tromsø)

International team of researchers reports ocean acidification is spreading rapidly in the western Arctic Ocean

Posted by mmaheigan 
· Thursday, March 30th, 2017 

The Arctic Ocean is particularly sensitive to climate change and ocean acidification such that aragonite saturation state is expected to become undersaturated (Ωarag <1) there sooner than in other oceans. However, the extent and expansion rate of ocean acidification (OA) in this region are still unknown.

In the March 2017 issue of Nature Climate Change, Qi et al. show that, between 1994 and 2010, low Ωarag waters have expanded northwards at least 5º, to 85ºN, and deepened from 100 m to 250 m depth. Data from multiple trans-western Arctic Ocean cruises show that Ωarag<1 water has increased in the upper 250 m from 5 to 31% of the total area north of 70ºN. Tracer data and model simulations suggest that increased transport of Pacific Winter Water (which is already acidified due to both natural and anthropogenic sources), driven by sea-ice retreat and the circulation changes, are primarily responsible for the expansion, while local carbon recycling and anthropogenic CO2 uptake have also contributed. These results indicate more rapid acidification is occurring in the Arctic Ocean, two to four times faster than the Pacific and Atlantic Oceans, with the western Arctic Ocean the first open-ocean region with large-scale expansion of “acidified” water directly observed in the upper water column.

The rapid spread of ocean acidification in the western Arctic has implications for marine life, particularly clams, mussels and pteropods that may have difficulty building or maintaining their shells in increasingly acidified waters. The pteropods are part of the Arctic food web and important to the diet of salmon and herring. Their decline could affect the larger marine ecosystem.

Authors:
Richard A. Feely (NOAA Pacific Marine Environmental Laboratory)
Leif G. Anderson (Univ. of Gothenburg)
Heng Sun (SOA Third Institute of Oceanography)
Jianfang Chen (SOA Second Institute of Oceanography
Min Chen (Univ. of Delaware)
Liyang Zhan (SOA Third Institute of Oceanography)
Yuanhui Zhang (SOA Third Institute of Oceanography)
Wei-Jun Cai (Univ. of Delaware, Univ. of Georgia)

Filter by Keyword

234Th disequilibrium abundance acidification africa air-sea flux air-sea interactions air-sea interface algae alkalinity allometry ammonium AMOC anoxia anoxic Antarctic anthro impacts anthropogenic carbon aquaculture aragonite saturation arctic Argo argon arsenic artificial seawater Atlantic Atlantic modeling atmospheric carbon atmospheric CO2 atmospheric nitrogen deposition authigenic carbonates autonomous platforms bacteria BATS BCG Argo benthic bgc argo bio-go-ship bio-optical bioavailability biogeochemical cycles biogeochemical cycling biogeochemical models biogeochemistry Biological Essential Ocean Variables biological pump biological uptake biophysics bloom blooms blue carbon bottom water boundary layer buffer capacity C14 CaCO3 calcification calcite calcium carbonate carbon-climate feedback carbon-sulfur coupling carbon budget carbon cycle carbon dioxide carbon export carbon sequestration carbon storage Caribbean CCA CCS changi changing marine ecosystems changing marine environments changing ocean chemistry chemical oceanographic data chemical speciation chemoautotroph chesapeake bay chl a chlorophyll circulation climate change climate variability CO2 CO2YS coastal darkening coastal ocean cobalt Coccolithophores community composition conservation cooling effect copepod coral reefs CTD currents cyclone data data access data management data product Data standards DCM dead zone decadal trends decomposers decomposition deep convection deep ocean deep sea coral deoxygenation depth diagenesis diatoms DIC diel migration diffusion dimethylsulfide dinoflagellate discrete measurements dissolved inorganic carbon dissolved organic carbon DOC DOM domoic acid dust DVM earth system models ecology ecosystems ecosystem state eddy Education Ekman transport emissions ENSO enzyme equatorial regions error ESM estuarine and coastal carbon estuarine and coastal carbon fluxes estuary euphotic zone eutrophication evolution export export fluxes export production EXPORTS extreme events extreme weather events faecal pellets filter feeders filtration rates fire fish Fish carbon fisheries floats fluid dynamics fluorescence food webs forage fish forams freshening freshwater frontal zone fronts functional role future oceans geochemistry geoengineering geologic time GEOTRACES glaciers gliders global carbon budget global ocean global warming go-ship grazing greenhouse gas Greenland groundwater Gulf of Maine Gulf of Mexico Gulf Stream gyre harmful algal bloom high latitude human food human impact hurricane hydrogen hydrothermal hypoxia ice age ice cores ice cover industrial onset inverse circulation ions iron iron fertilization isotopes jellies katabatic winds kelvin waves krill kuroshio laboratory vs field land-ocean continuum larvaceans lateral transport LGM lidar ligands light light attenuation lipids mangroves marine carbon cycle marine heatwave marine particles marine snowfall marshes Mediterranean meltwater mesopelagic mesoscale metagenome metals methane methods microbes microlayer microorganisms microscale microzooplankton midwater mixed layer mixed layers mixing mixotrophy modeling models mode water molecular diffusion MPT multi-decade n2o NAAMES NASA NCP net community production net primary productivity new ocean state new technology Niskin bottle nitrate nitrogen nitrogen fixation nitrous oxide north atlantic north pacific nuclear war nutricline nutrient budget nutrient cycling nutrient limitation nutrients OA ocean-atmosphere ocean acidification ocean acidification data ocean carbon uptake and storage ocean color ocean observatories ocean warming ODZ oligotrophic omics OMZ open ocean optics organic particles oscillation overturning circulation oxygen pacific paleoceanography particle flux particles pCO2 PDO peat pelagic PETM pH phenology phosphorus photosynthesis physical processes physiology phytoplankton PIC plankton POC polar regions pollutants precipitation predation prediction primary production primary productivity Prochlorococcus proteins pteropods pycnocline radioisotopes remineralization remote sensing repeat hydrography residence time resource management respiration resuspension rivers rocky shore Rossby waves Ross Sea ROV salinity salt marsh satell satellite scale seafloor seagrass sea ice sea level rise seasonal patterns seasonal trends sea spray seaweed sediments sensors shelf system shells ship-based observations shorelines silicate silicon cycle sinking particles size SOCCOM soil carbon southern ocean south pacific spatial covariations speciation SST stoichiometry subduction submesoscale subpolar subtropical sulfate surf surface surface ocean Synechococcus teleconnections temperate temperature temporal covariations thermocline thermodynamics thermohaline thorium tidal time-series time of emergence top predators total alkalinity trace elements trace metals trait-based transfer efficiency transient features Tris trophic transfer tropical turbulence twilight zone upper ocean upper water column upwelling US CLIVAR validation velocity gradient ventilation vertical flux vertical migration vertical transport volcano warming water clarity water quality waves western boundary currents wetlands winter mixing world ocean compilation zooplankton

Copyright © 2023 - OCB Project Office, Woods Hole Oceanographic Institution, 266 Woods Hole Rd, MS #25, Woods Hole, MA 02543 USA Phone: 508-289-2838  •  Fax: 508-457-2193  •  Email: ocb_news@us-ocb.org

link to nsflink to noaalink to WHOI

Funding for the Ocean Carbon & Biogeochemistry Project Office is provided by the National Science Foundation (NSF) and the National Aeronautics and Space Administration (NASA). The OCB Project Office is housed at the Woods Hole Oceanographic Institution.