Ocean Carbon & Biogeochemistry
Studying marine ecosystems and biogeochemical cycles in the face of environmental change
  • Home
  • About OCB
    • About Us
    • Get Involved
    • Project Office
    • Code of Conduct
    • Scientific Steering Committee
    • OCB committees
      • Ocean Time-series
      • US Biogeochemical-Argo
      • Ocean-Atmosphere Interaction
    • Scientific Breadth
      • Biological Pump
      • Changing Marine Ecosystems
      • Changing Ocean Chemistry
      • Estuarine and Coastal Carbon Fluxes
      • Ocean Carbon Uptake and Storage
      • Ocean Observatories
  • Activities
    • OCB Webinar Series
    • Summer Workshops
    • Scoping Workshops
      • Ecological Forecasting – North American Coastlines
      • Expansion of BGC-Argo and Profiling Floats
      • Future BioGeoSCAPES program
      • Ocean-Atmosphere Interactions
      • Oceanic Methane & Nitrous Oxide
    • Other Workshops
      • GO-BCG Scoping Workshop
    • Science Planning
      • Coastal CARbon Synthesis (CCARS)
      • North Atlantic-Arctic
    • Ocean Acidification PI Meetings
    • Training Activities
      • PACE Training Activity
  • Small Group Activities
    • Aquatic Continuum OCB-NACP Focus Group
    • Arctic-COLORS Data Synthesis
    • Carbon Isotopes in the Ocean Workshop
    • CMIP6 WG
      • CMIP6 Models Workshop
    • Coastal BGS Obs with Fisheries
    • C-saw extreme events workshop
    • Filling the gaps air–sea carbon fluxes WG
    • Fish, fisheries and carbon
    • Fish Carbon WG
      • Fish Carbon WG Workshop
      • Fish carbon workshop summary
    • Lateral Carbon Flux in Tidal Wetlands
    • Marine carbon dioxide removal
      • Marine CDR Workshop
    • Metaproteomic Intercomparison
    • Mixotrophs & Mixotrophy WG
    • N-Fixation WG
    • Ocean Carbonate System Intercomparison Forum
    • Ocean Carbon Uptake WG
    • Ocean Nucleic Acids ‘Omics
    • OOI BGC sensor WG
    • Phytoplankton Taxonomy WG
  • Science Support
    • Data management and archival
    • Early Career
    • Funding Sources
    • Jobs & Postdocs
    • Meeting List
    • OCB topical websites
      • Ocean Fertilization
      • Trace gases
      • US IIOE-2
    • Outreach & Education
    • Promoting your science
    • Student Opportunities
    • OCB Activity Proposal Solicitations
    • Travel Support
  • Publications
    • Ocean Carbon Exchange
    • Newsletter Archive
    • Science Planning and Policy
    • OCB Workshop Reports
  • OCB Science Highlights
  • News

Archive for upper water column

Shipboard LiDAR: A powerful tool for measuring the distribution and composition of particles in the ocean

Posted by mmaheigan 
· Tuesday, October 23rd, 2018 

Despite major advances in ocean observing capabilities, characterizing the vertical distribution of materials in the ocean with high spatial resolution remains challenging. Light Detection and Ranging (LiDAR), a technique that relies on measurement of the “time-of-flight” of a backscattered laser pulse to determine the range to a scattering object, could potentially fill this critical gap in our sampling capabilities by providing remote estimates of the vertical distribution of optical properties and suspended particles in the ocean.

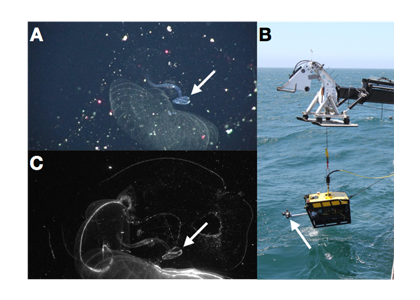
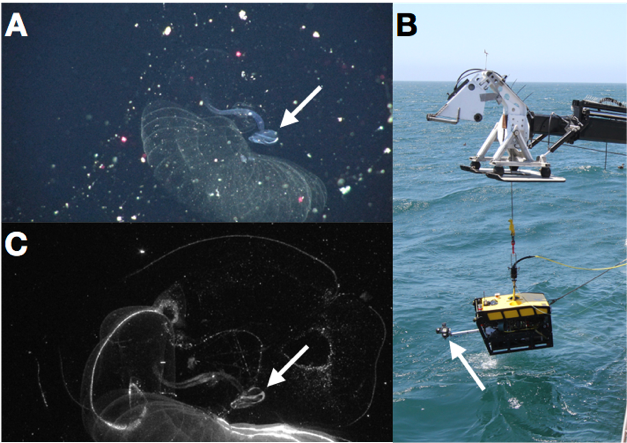
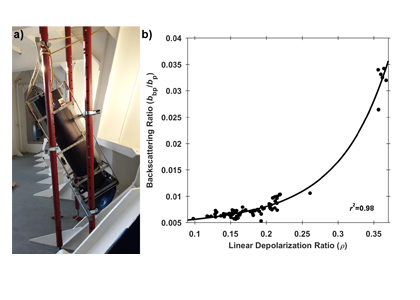
A recent article in Remote Sensing of Environment details the development of a portable shipboard LiDAR and its capabilities for extending high-frequency measurements of scattering particles into the vertical dimension. The authors deployed the experimental system (shown in Figure 1a) during research cruises off the coast of Virginia and during a passenger ferry crossing of the Gulf of Maine (associated with the Gulf of Maine North Atlantic Time Series program-GNATS). Remote measurements of LiDAR signal attenuation corresponded well with simultaneous in situ measurements of water column optical properties and proxies for the concentration of suspended particles. Interestingly, the researchers also observed that the extent to which the return signal was depolarized (also known as the LiDAR depolarization ratio) may provide information regarding the composition of particles within the scattering volume. This is evidenced by the strong relationship between the depolarization ratio and the backscattering ratio, an indicator of the bulk composition (mineral vs. organic) of the particles within a scattering medium (Figure 1b).

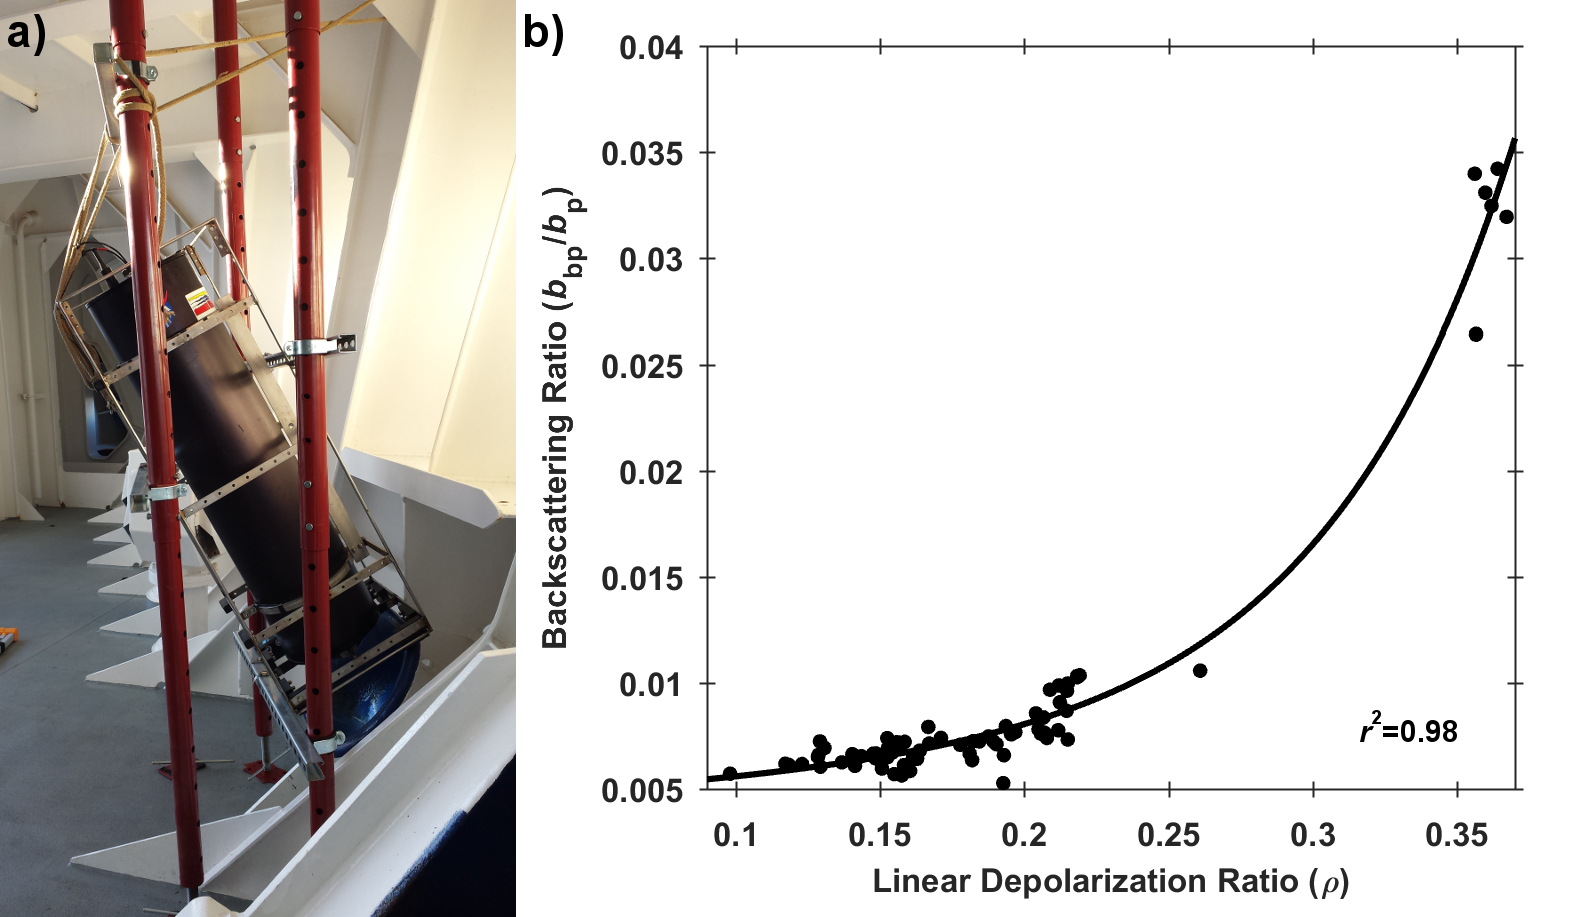
Figure 1. a) LiDAR system deployed to look through a chock at the bow of the M/V Nova Star. b) Relationship between the LiDAR linear depolarization ratio (ρ) and coincident measurements of the particulate backscattering ratio (bbp/bp). The black line represents a least-squares exponential fit to the data.

As LiDAR technology becomes increasingly rugged, compact, and inexpensive, the regular deployment of oceanographic LiDAR on a variety of sampling platforms will become an increasingly practical method for characterizing the vertical and horizontal distribution of particles in the ocean. This has the potential to greatly improve our ability to investigate the role of particles in physical and biogeochemical oceanographic processes, especially when sampling constraints limit observations to the surface ocean.


Authors:
Brian L. Collister (Old Dominion University)
Richard C. Zimmerman (Old Dominion University)
Charles I. Sukenik (Old Dominion University
Victoria J. Hill (Old Dominion University)
William M. Balch (Bigelow Laboratory for Ocean Sciences)

Lasers shed light on giant larvacean filtration impact on the ocean’s biological pump

Posted by mmaheigan 
· Thursday, January 4th, 2018 

To accurately assess the impacts of climate change, we need to understand how atmospheric carbon is transported from surface waters to the deep sea. Grazers and filter feeders drive the ocean’s biological pump as they remove and sequester carbon at various rates. This pump extends down into the midwater realm, the largest habitat on earth. Giant larvaceans are fascinating and enigmatic occupants of the upper 400 m of the water column, where they build complex filtering structures out of mucus that can reach diameters greater than 1 m in longest dimension (Figure 1A). Because of the fragility of these structures, direct measurements of filtration rates require us to study them in situ. We developed DeepPIV, an ROV-deployable instrument (Figure 1B) to directly measure fluid motion and filtration rates in situ (Figure 1C).

Figure 1. (A) Traditional view of a giant larvacean illuminated by white ROV lights. (B) DeepPIV instrument is seen attached to Monterey Bay Aquarium Research Institute’s (MBARI) MiniROV. (C) DeepPIV-illuminated interior view of a giant larvacean house, where particle motion in ambient seawater serves as a proxy for fluid motion. White arrows in (A) and (C) indicate larvacean head/trunk; white arrow in (B) indicates DeepPIV.

The filtration rates we measured for giant larvaceans are far greater than for any other zooplankton filter feeder. When combined with abundance data from a 22-year time series, the grazing impact of giant larvaceans indicates that within 13 days, they can filter the total volume of water within their habitable depth range (~100-300 m; based on maximum abundance and measured filtration rates). Our results reveal that the contribution of giant larvaceans to vertical carbon flux is much greater than previously thought. Small larvaceans, which are present in the water column in even larger quantities than giant larvaceans, may also have a measurable impact on carbon fluxes. New technologies such as DeepPIV are yielding more quantitative observations of midwater filter feeders, which is improving our understanding of the roles that deep-water biota play in the long-term removal of carbon from the atmosphere.

Read the full journal article: http://advances.sciencemag.org/content/3/5/e1602374.full

Authors: (All at MBARI)
Kakani Katija
Rob E. Sherlock
Alana D. Sherman
Bruce H. Robison

International team of researchers reports ocean acidification is spreading rapidly in the western Arctic Ocean

Posted by mmaheigan 
· Thursday, March 30th, 2017 

The Arctic Ocean is particularly sensitive to climate change and ocean acidification such that aragonite saturation state is expected to become undersaturated (Ωarag <1) there sooner than in other oceans. However, the extent and expansion rate of ocean acidification (OA) in this region are still unknown.

In the March 2017 issue of Nature Climate Change, Qi et al. show that, between 1994 and 2010, low Ωarag waters have expanded northwards at least 5º, to 85ºN, and deepened from 100 m to 250 m depth. Data from multiple trans-western Arctic Ocean cruises show that Ωarag<1 water has increased in the upper 250 m from 5 to 31% of the total area north of 70ºN. Tracer data and model simulations suggest that increased transport of Pacific Winter Water (which is already acidified due to both natural and anthropogenic sources), driven by sea-ice retreat and the circulation changes, are primarily responsible for the expansion, while local carbon recycling and anthropogenic CO2 uptake have also contributed. These results indicate more rapid acidification is occurring in the Arctic Ocean, two to four times faster than the Pacific and Atlantic Oceans, with the western Arctic Ocean the first open-ocean region with large-scale expansion of “acidified” water directly observed in the upper water column.

The rapid spread of ocean acidification in the western Arctic has implications for marine life, particularly clams, mussels and pteropods that may have difficulty building or maintaining their shells in increasingly acidified waters. The pteropods are part of the Arctic food web and important to the diet of salmon and herring. Their decline could affect the larger marine ecosystem.

Authors:
Richard A. Feely (NOAA Pacific Marine Environmental Laboratory)
Leif G. Anderson (Univ. of Gothenburg)
Heng Sun (SOA Third Institute of Oceanography)
Jianfang Chen (SOA Second Institute of Oceanography
Min Chen (Univ. of Delaware)
Liyang Zhan (SOA Third Institute of Oceanography)
Yuanhui Zhang (SOA Third Institute of Oceanography)
Wei-Jun Cai (Univ. of Delaware, Univ. of Georgia)

Filter by Keyword

234Th disequilibrium abundance acidification africa air-sea flux air-sea interactions air-sea interface algae alkalinity allometry ammonium AMOC anoxia anoxic Antarctic anthro impacts anthropogenic carbon aquaculture aragonite saturation arctic Argo argon arsenic artificial seawater Atlantic Atlantic modeling atmospheric carbon atmospheric CO2 atmospheric nitrogen deposition authigenic carbonates autonomous platforms bacteria BATS benthic bgc argo bio-go-ship bio-optical bioavailability biogeochemical cycles biogeochemical cycling biogeochemical models biogeochemistry Biological Essential Ocean Variables biological pump biological uptake biophysics bloom blooms blue carbon bottom water boundary layer buffer capacity C14 CaCO3 calcification calcite calcium carbonate carbon-climate feedback carbon-sulfur coupling carbon budget carbon cycle carbon dioxide carbon export carbon sequestration carbon storage Caribbean CCA CCS changi changing marine ecosystems changing marine environments changing ocean chemistry chemical oceanographic data chemical speciation chemoautotroph chesapeake bay chl a chlorophyll circulation climate change climate variability CO2 CO2YS coastal darkening coastal ocean cobalt Coccolithophores community composition conservation cooling effect copepod coral reefs CTD currents cyclone data data access data management data product Data standards DCM dead zone decadal trends decomposers decomposition deep convection deep ocean deep sea coral deoxygenation depth diagenesis diatoms DIC diel migration diffusion dimethylsulfide dinoflagellate discrete measurements dissolved inorganic carbon dissolved organic carbon DOC DOM domoic acid dust DVM earth system models ecology ecosystems ecosystem state eddy Education Ekman transport emissions ENSO enzyme equatorial regions error ESM estuarine and coastal carbon estuarine and coastal carbon fluxes estuary euphotic zone eutrophication evolution export export fluxes export production EXPORTS extreme events extreme weather events faecal pellets filter feeders filtration rates fire fish Fish carbon fisheries floats fluid dynamics fluorescence food webs forage fish forams freshening freshwater frontal zone fronts functional role future oceans geochemistry geoengineering geologic time GEOTRACES glaciers gliders global carbon budget global ocean global warming go-ship grazing greenhouse gas Greenland groundwater Gulf of Maine Gulf of Mexico Gulf Stream gyre harmful algal bloom high latitude human food human impact hurricane hydrogen hydrothermal hypoxia ice age ice cores ice cover industrial onset inverse circulation ions iron iron fertilization isotopes jellies katabatic winds kelvin waves krill kuroshio laboratory vs field land-ocean continuum larvaceans lateral transport LGM lidar ligands light light attenuation lipids mangroves marine carbon cycle marine heatwave marine particles marine snowfall marshes Mediterranean meltwater mesopelagic mesoscale metagenome metals methane methods microbes microlayer microorganisms microscale microzooplankton midwater mixed layer mixed layers mixing mixotrophy modeling models mode water molecular diffusion MPT multi-decade n2o NAAMES NASA NCP net community production net primary productivity new ocean state new technology Niskin bottle nitrate nitrogen nitrogen fixation nitrous oxide north atlantic north pacific nuclear war nutricline nutrient budget nutrient cycling nutrient limitation nutrients OA ocean-atmosphere ocean acidification ocean acidification data ocean carbon uptake and storage ocean color ocean observatories ocean warming ODZ oligotrophic omics OMZ open ocean optics organic particles oscillation overturning circulation oxygen pacific paleoceanography particle flux pCO2 PDO peat pelagic PETM pH phenology phosphorus photosynthesis physical processes physiology phytoplankton PIC plankton POC polar regions pollutants precipitation predation prediction primary production primary productivity Prochlorococcus proteins pteropods pycnocline radioisotopes remineralization remote sensing repeat hydrography residence time resource management respiration resuspension rivers rocky shore Rossby waves Ross Sea ROV salinity salt marsh satell satellite scale seafloor seagrass sea ice sea level rise seasonal patterns seasonal trends sea spray seaweed sediments sensors shelf system shells ship-based observations shorelines silicate silicon cycle sinking particles size SOCCOM soil carbon southern ocean south pacific spatial covariations speciation SST stoichiometry subduction submesoscale subpolar subtropical sulfate surf surface surface ocean Synechococcus teleconnections temperate temperature temporal covariations thermocline thermodynamics thermohaline thorium tidal time-series time of emergence top predators total alkalinity trace elements trace metals trait-based transfer efficiency transient features Tris trophic transfer tropical turbulence twilight zone upper ocean upper water column upwelling US CLIVAR validation velocity gradient ventilation vertical flux vertical migration vertical transport volcano warming water clarity water quality waves western boundary currents wetlands winter mixing world ocean compilation zooplankton

Copyright © 2023 - OCB Project Office, Woods Hole Oceanographic Institution, 266 Woods Hole Rd, MS #25, Woods Hole, MA 02543 USA Phone: 508-289-2838  •  Fax: 508-457-2193  •  Email: ocb_news@us-ocb.org

link to nsflink to noaalink to WHOI

Funding for the Ocean Carbon & Biogeochemistry Project Office is provided by the National Science Foundation (NSF) and the National Aeronautics and Space Administration (NASA). The OCB Project Office is housed at the Woods Hole Oceanographic Institution.