Both climate change and the efforts to abate have the potential to reshape phytoplankton community composition, globally. Shallower mixed layers in a warming ocean and many marine CO2 removal (CDR) technologies will shift the balance of light, nutrients, and carbonate chemistry, benefiting certain species over others. We must understand how such shifts could ripple through the marine carbon cycle and modify the ocean carbon reservoir. Two new publications in Geophysical Research Letters and Global Biogeochemical Cycles highlight an often over looked pathway in this response: The appetite of zooplankton.
We have long known that the appetite of zooplankton—i.e. the half-saturation concertation for grazing—varies dramatically. This variability is largely based on laboratory incubations of specific species. An open-ocean perspective has been much more elusive. Using two independent inverse modelling approaches, both studies reached the same conclusion: Even at the community level, the appetite of zooplankton in the open-ocean is incredibly diverse.
Moreover, variability in zooplankton appetites maps well onto the biogeography of phytoplankton species. As these phytoplankton niches evolve, the composition of the zooplankton will likely follow. To help understand the impact of this response on the biological pump, we compared two models, one with only two types of zooplankton, and another with an unlimited amount, each with different appetites, all individually tuned to their unique environment. Including more realistic diversity reduced the strength of the biological pump by 1 PgC yr-1.
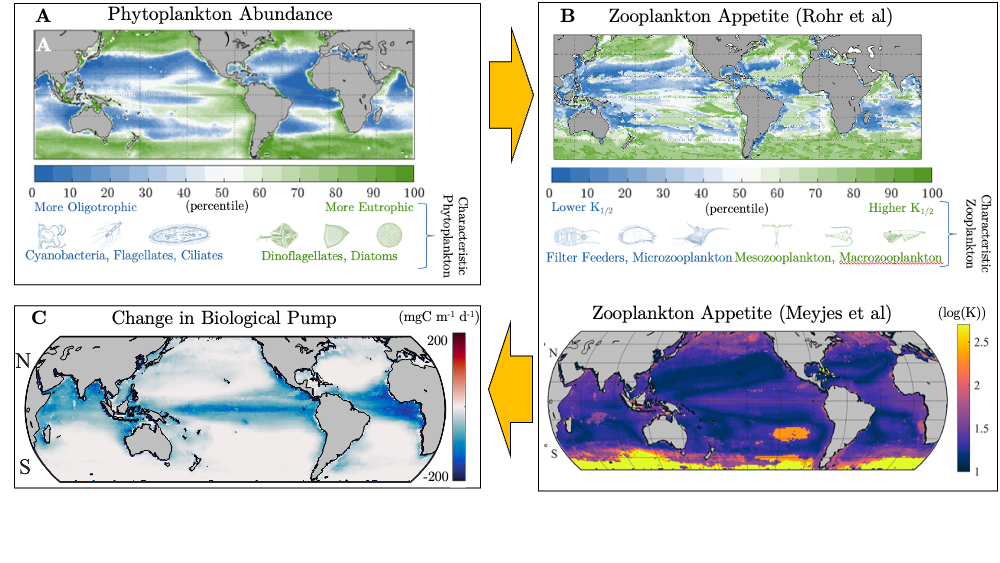
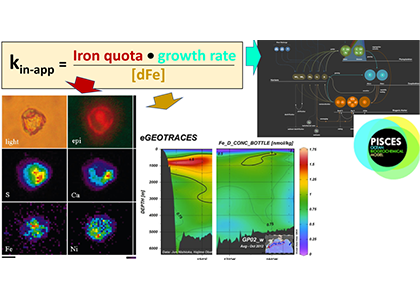
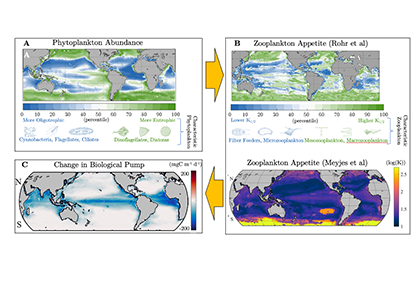
Figure Caption. A) Variability in the abundance and characteristic composition of phytoplankton drives B) large differences in the associated appetite and characteristic composition of zooplankton in two independent inverse modelling studies. C) When more realistic diversity in the appetite of zooplankton is simulated in models, the strength of biological pump is dramatically reduced.
That is the same order as the most optimistic scenarios for ocean iron fertilization. This means that when simulating the efficacy of many CDR scenarios, the bias introduced by insufficiently resolved zooplankton diversity could be just as large as the signal. Moving forward, it is imperative to improve the representation of zooplankton in Earth System Models to understand how the marine carbon sink will respond to inadvertent and deliberate perturbations.
Related article in The Conversation: https://theconversation.com/marine-co-removal-technologies-could-depend-on-the-appetite-of-the-oceans-tiniest-animals-227156
Authors (GRL):
Tyler Rohr (The University of Tasmania; Australian Antarctic Program Partnership)
Anthony Richardson (The University of Queensland; CSIRO)
Andrew Lenton (CSIRO)
Matthew Chamberlain (CSIRO)
Elizabeth Shadwick (Australian Antarctic Program Partnership; CSIRO)
Authors (GBC):
Sophie Meyjes (Cambridge)
Colleen Petrick (Scripps Institute of Oceanography)
Tyler Rohr (The University of Tasmania; Australian Antarctic Program Partnership)
B.B. Cael (NOC)
Ali Mashayek (Cambridge)