Ocean Carbon & Biogeochemistry
Studying marine ecosystems and biogeochemical cycles in the face of environmental change
  • Home
  • About OCB
    • About Us
    • Get Involved
    • Project Office
    • Code of Conduct
    • Scientific Steering Committee
    • OCB committees
      • Ocean Time-series
      • US Biogeochemical-Argo
      • Ocean-Atmosphere Interaction
    • Scientific Breadth
      • Biological Pump
      • Changing Marine Ecosystems
      • Changing Ocean Chemistry
      • Estuarine and Coastal Carbon Fluxes
      • Ocean Carbon Uptake and Storage
      • Ocean Observatories
  • Activities
    • OCB Webinar Series
    • Summer Workshops
    • Scoping Workshops
      • Ecological Forecasting – North American Coastlines
      • Expansion of BGC-Argo and Profiling Floats
      • Future BioGeoSCAPES program
      • Ocean-Atmosphere Interactions
      • Oceanic Methane & Nitrous Oxide
    • Other Workshops
      • GO-BCG Scoping Workshop
    • Science Planning
      • Coastal CARbon Synthesis (CCARS)
      • North Atlantic-Arctic
    • Ocean Acidification PI Meetings
    • Training Activities
      • PACE Training Activity
  • Small Group Activities
    • Aquatic Continuum OCB-NACP Focus Group
    • Arctic-COLORS Data Synthesis
    • Carbon Isotopes in the Ocean Workshop
    • CMIP6 WG
      • CMIP6 Models Workshop
    • Coastal BGS Obs with Fisheries
    • C-saw extreme events workshop
    • Filling the gaps air–sea carbon fluxes WG
    • Fish, fisheries and carbon
    • Fish Carbon WG
      • Fish Carbon WG Workshop
      • Fish carbon workshop summary
    • Lateral Carbon Flux in Tidal Wetlands
    • Marine carbon dioxide removal
      • Marine CDR Workshop
    • Metaproteomic Intercomparison
    • Mixotrophs & Mixotrophy WG
    • N-Fixation WG
    • Ocean Carbonate System Intercomparison Forum
    • Ocean Carbon Uptake WG
    • Ocean Nucleic Acids ‘Omics
    • OOI BGC sensor WG
    • Phytoplankton Taxonomy WG
  • Science Support
    • Data management and archival
    • Early Career
    • Funding Sources
    • Jobs & Postdocs
    • Meeting List
    • OCB topical websites
      • Ocean Fertilization
      • Trace gases
      • US IIOE-2
    • Outreach & Education
    • Promoting your science
    • Student Opportunities
    • OCB Activity Proposal Solicitations
    • Travel Support
  • Publications
    • Ocean Carbon Exchange
    • Newsletter Archive
    • Science Planning and Policy
    • OCB Workshop Reports
  • OCB Science Highlights
  • News

Archive for atmospheric CO2

What drives decadal changes in the Chesapeake Bay carbonate system?

Posted by mmaheigan 
· Tuesday, May 3rd, 2022 

Understanding decadal changes in the coastal carbonate system (CO2-system) is essential for predicting how the health of these waters is affected by anthropogenic drivers, such as changing atmospheric conditions and terrestrial inputs. However, studies that quantify the relative impacts of these drivers are lacking.

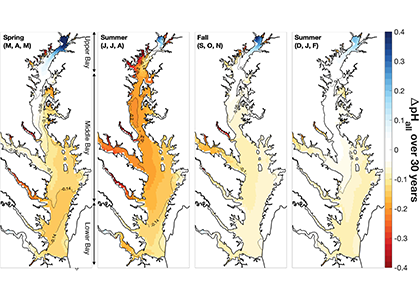
A recent study in Journal of Geophysical Research: Oceans identified the primary drivers of acidification in the Chesapeake Bay over the past three decades. The authors used a three-dimensional hydrodynamic-biogeochemistry model to quantify the relative impacts on the Bay CO2-system from increases in atmospheric CO2, temperature, oceanic dissolved inorganic carbon (DIC) concentrations, terrestrial loadings of total alkalinity (TA) and DIC, as well as decreases in terrestrial nutrient inputs. Decadal changes in the surface CO2-system in the Chesapeake Bay exhibit large spatial and seasonal variability due to the combination of influences from the land, ocean and atmosphere. In the upper Bay, increased riverine TA and DIC from the Susquehanna River have increased surface pH, with other drivers only contributing to decadal changes that are one to two orders of magnitude smaller. In the mid- and lower Bay, higher atmospheric CO2 concentrations and reduced nutrient loading are the two most critical drivers and have nearly equally reduced surface pH in the summer. These decadal changes in surface pH show significant seasonal variability with the greatest magnitude generally aligning with the spring and summer shellfish production season (Figure 1).

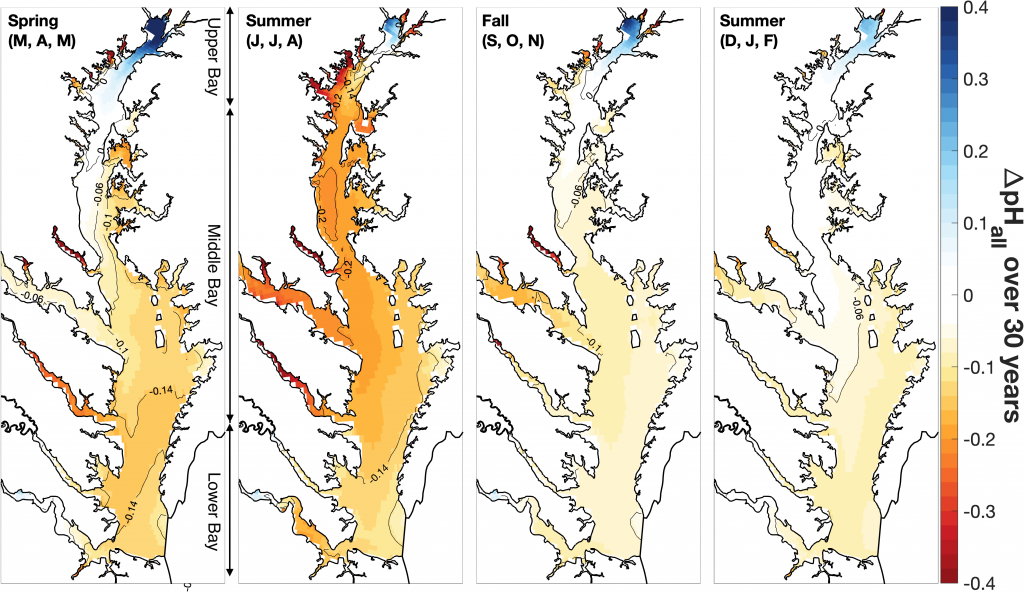
Figure 1: Overall changes in modeled surface pH (ΔpHall) due to all global and terrestrial drivers combined over the past 30 years (i.e., 2015–2019 relative to 1985–1989). ΔpHall includes changes in surface pH due to increased atmospheric CO2, increased atmospheric thermal forcing, increased oceanic dissolved inorganic carbon concentrations, decreased riverine nitrate concentrations, decreased riverine organic nitrogen concentrations, and increased riverine total alkalinity and dissolved inorganic carbon concentrations.


These results indicate that a number of global and terrestrial drivers play crucial roles in coastal acidification. The combined effects of the examined drivers suggest that calcifying organisms in coastal surface waters are likely facing faster decreasing rates of pH than those in open ocean ecosystems. Decreases in surface pH associated with nutrient reductions highlight that the Chesapeake Bay ecosystem is returning to a more natural condition, e.g., a condition when anthropogenic nutrient input from the watershed was lower. However, increased atmospheric CO2 is simultaneously accelerating the rate of change in pH, exerting increased stress on estuarine calcifying organisms. For ecosystems such as the Chesapeake Bay where nutrient loading is already being managed, controlling the emissions of anthropogenic CO2 globally becomes increasingly important to decelerate the rate of acidification and to relieve the stress on estuarine calcifying organisms. Future observational and modeling studies are needed to further investigate how the decadal trends in the Chesapeake Bay CO2-system may vary with depth. These efforts will improve our current understanding of long-term change in coastal carbonate systems and their impacts on the shellfish industry.


Authors:
Fei Da (Virginia Institute of Marine Science, William & Mary, USA)
Marjorie A. M. Friedrichs (Virginia Institute of Marine Science, William & Mary, USA)
Pierre St-Laurent (Virginia Institute of Marine Science, William & Mary, USA)
Elizabeth H. Shadwick (CSIRO Oceans and Atmosphere, Australia)
Raymond G. Najjar (The Pennsylvania State University, USA)
Kyle E. Hinson (Virginia Institute of Marine Science, William & Mary, USA)

Does ocean acidification make marine fish grow differently? What about sex-specific effects?

Posted by mmaheigan 
· Monday, February 8th, 2021 

The question of whether ocean acidification (OA) will impact the growth of marine fish remains surprisingly uncertain. The bulk of available evidence in the form of laboratory experiments suggests that most fish are not impacted by OA-relevant CO2 levels, but many studies suffer from the inherent methodical constraints of rearing marine fish in captivity. For example, most experiments cover a small fraction of a species’ lifespan and do not employ restricted feeding regimes which may enable fish to increase feeding to offset metabolic deficits associated with high-CO2 acclimation.

To address these methodological shortcomings, authors of a recent publication in PLOS One synthesized three years of multiple long-term, food-controlled experiments that reared large populations of the model forage fish Menidia menidia (Atlantic silverside) from fertilization to about a third of their lifespan. Results showed modest but consistent negative, temperature-dependent growth effects, in which silversides from high-CO2 treatments were shorter (-3% to -9%) and weighed less (-6% to -18%) than ambient-CO2 conspecifics. However, sometimes it takes more than just looking at means and standard deviations to elucidate these effects. Hence, the authors employed powerful shift functions to analyze how the size distributions of experimental populations shifted to smaller quantiles under future CO2 conditions.

Figure caption: The length of juvenile Atlantic silversides reared from fertilization under control (blue dots) and high-CO2 treatments (red dots). Exposure to OA conditions imposed a universal shift to a smaller body size across the size frequency distribution. Black vertical bars overlaying each distribution indicate the .1, .25, .5, .75, and .9 quantiles and quantile shifts are indicated by connecting lines.

It took over 100 days of continuous high-CO2 exposure until size differences were detectable. This means that long-term CO2 effects could exist in other tested species but are missed in relatively short experiments. Furthermore, the authors sexed several thousand fish to enable a rare sex-specific analysis of CO2 effects. Both sexes were similarly affected by high CO2, and the hormonal pathways that mediate environmental sex determination in this species are not impacted by CO2 level. Our results confirm that Atlantic silversides are relatively tolerant of future OA conditions. But even in this robust estuarine species, high CO2 can reduce growth. This could have cascading effects on population dynamics by impacting size-dependent traits like reproductive success and over-wintering survival of this widespread and ecologically important prey species.


Authors
Christopher S. Murray (University of Washington)
Hannes Baumann (University of Connecticut)


How environmental drivers regulated the long-term evolution of the biological pump

Posted by mmaheigan 
· Friday, January 22nd, 2021 

The marine biological pump (BP) plays a crucial role in regulating earth’s atmospheric oxygen and carbon dioxide levels by transferring carbon fixed by primary producers into the ocean interior and marine sediments, thereby controlling the habitability of our planet. The rise of multicellular life and eukaryotic algae in the ocean about 700 million years ago would likely have influenced the physical characteristics of oceanic aggregates (e.g., sinking rate), yet the magnitude of the impact this biological innovation had on the efficiency of BP is unknown.

Figure. 1. The impact of biological innovations (left) and environmental factors (atmospheric oxygen level and seawater temperature; right) on the efficiency of marine biological pump (BP). Temperatures are ocean surface temperatures (SST), and atmospheric pO2 is shown relative to the present atmospheric level (PAL). The BP efficiency is calculated as the fraction of carbon exported from the surface ocean that is delivered to the sediment-water interface. The results indicate that evolution of larger sized algae and zooplanktons has little influence on the long-term evolution of biological pump (left panel). The change in the atmospheric oxygen level and seawater surface temperature as environmental factors, on the other hand, have a stronger leverage on the efficiency of biological pump (right panel).

The authors of a recent paper in Nature Geoscience constructed a particle-based stochastic model to explore the change in the efficiency of the BP in response to biological and physical changes in the ocean over geologic time. The model calculates the age of organic particles in each aggregate based on their sinking rates, and considers the impact of primary producer cell size, aggregation, temperature, dust flux, biomineralization, ballasting by mineral phases, oxygen, and the fractal geometry (porosity) of aggregates. The model results demonstrate that while the rise of larger-sized eukaryotes led to an increase in the average sinking rate of oceanic aggregates, its impact on BP efficiency was minor. The evolution of zooplankton (with daily vertical migration in the water column) had a larger impact on the carbon transfer into the ocean interior. But results suggest that environmental factors most strongly affected the marine carbon pump efficiency. Specifically, increased ocean temperatures and greater atmospheric oxygen abundance led to a significant decrease in the efficiency of the BP. Cumulatively, these results suggest that while major biological innovations influenced the efficiency of BP, the long-term evolution of the marine carbon pump was primarily controlled by environmental drivers such as climate cooling and warming. By enhancing the rate of heterotrophic microbial degradation, our results suggest that the anthropogenically-driven global warming can result in a less efficient BP with reduced power of marine ecosystem in sequestering carbon from the atmosphere.

Authors:
Mojtaba Fakhraee (Yale University, Georgia Tech, and NASA Astrobiology Institute)
Noah J. Planavsky (Yale University, and NASA Astrobiology Institute)
Christopher T. Reinhard (Georgia Tech, and NASA Astrobiology Institute)

How zooplankton control carbon export in the Southern Ocean

Posted by mmaheigan 
· Thursday, December 3rd, 2020 

The Southern Ocean exhibits an inverse relationship between surface primary production and export flux out of the euphotic zone. The causes of this production-export decoupling are still under debate. A recently published mini review in Frontiers in Marine Science focused on zooplankton, an important component of Southern Ocean food webs and the biological pump. The authors compared carbon export regimes from the naturally iron-fertilised Kerguelen Plateau (high surface production, but generally low export) with the iron-limited and less productive high nutrient, low chlorophyll (HNLC) waters south of Australia, where carbon export is relatively high.

Figure 1: The role of zooplankton in establishing the characteristic export regimes at two sites in the Southern Ocean, (a) the highly productive northern Kerguelen Plateau, which exhibits low export, and (b) the iron-limited waters south of Australia with low production, but relatively high carbon export.

Size structure and zooplankton grazing pressure are found to shape carbon export at both sites. On the Kerguelen Plateau, a large size spectrum of zooplankton acts as “gate-keeper” to the mesopelagic by significantly reducing the sinking flux of phytoaggregates, which establishes the characteristic low export regime. In the HNLC waters, however, the zooplankton community is low in biomass and grazes predominantly on smaller particles, which leaves the larger particles for export and leads to relatively high export flux.

Gaps in knowledge related to insufficient seasonal data coverage, understudied carbon flux pathways, and associated mesopelagic processes limit our current understanding of carbon transfer through the water column and export. More integrated data collection efforts, including the use of autonomous profiling floats (e.g., BGC-Argo), stationary moorings, etc., will improve seasonal carbon flux data coverage, thus enabling more reliable estimation of carbon export and storage in the Southern Ocean and improved projection of future changes in carbon uptake and atmospheric carbon dioxide levels.


Authors:
Svenja Halfter (University of Tasmania)
Emma Cavan (Imperial College London)
Ruth Eriksen (CSIRO)
Kerrie Swadling (University of Tasmania)
Philip Boyd (University of Tasmania)

Sea ice loss and the changing Arctic carbon cycle

Posted by mmaheigan 
· Friday, September 18th, 2020 

Loss of Arctic Ocean ice cover is altering the carbon cycle in ways that are not well understood. Effectively “popping the top off” the Arctic Ocean, ice loss exposes the sea surface to warming and exchange of CO2 with the atmosphere. These processes are expected to increase CO2 levels in the Arctic Ocean, changing its contribution to the global carbon cycle, but limited data collection in the region has thus far precluded the establishment of a clear relationship between CO2 and ice cover. In a recent study published in Geophysical Research Letters, authors report on observed partial pressure of CO2 (pCO2) trends from several years of data collection in the surface waters of the Canada Basin of the Arctic Ocean. These data show that the pCO2 is higher during years when ice cover is low. Uptake of atmospheric CO2 and heating are the primary sources of the CO2 increase, with only a small counteracting offset from biological production. These processes vary significantly from year to year, masking the likely increase in pCO2 over time. Based on these results, we can expect that, while the Arctic Ocean has thus far been a significant sink for atmospheric CO2, if ice loss continues the uptake of CO2 will diminish in coming years.

Figure caption: Sea surface pCO2 increases with decreasing ice concentration (left), determined using the mean of spatially gridded data. The sea surface pCO2 data were collected on five research cruises on the Canadian icebreaker, CCGS Louis S. St-Laurent, from 2012 to 2017 (shown at right for 2017). The pCO2 levels are indicated by the color along the ship cruise track (right color bar). The dark shading (left color bar) represents sea ice concentration averaged from the daily satellite data collected during the cruise.

Authors:
Michael DeGrandpre (University of Montana-Missoula)
Wiley Evans (Hakai Institute)
Mary-Louise Timmermans (Yale University)
Richard Krishfield (Woods Hole Oceanographic Institution)
Bill Williams (Institute of Ocean Sciences)
Michael Steele (University of Washington)

Volcanic carbon dioxide drove ancient global warming event

Posted by mmaheigan 
· Thursday, March 29th, 2018 

A study recently published in Nature suggests that an extreme global warming event 56 million years ago known as the Palaeocene-Eocene Thermal Maximum (PETM) was driven by massive CO2 emissions from volcanoes during the formation of the North Atlantic Ocean. Using a combination of new geochemical measurements and novel global climate modelling, the study revealed that atmospheric CO2 more than doubled in less than 25,000 years during the PETM.

The PETM lasted ~150,000 years and is the most rapid and extreme natural global warming event of the last 66 million years. During the PETM, global temperatures increased by at least 5°C, comparable to temperatures projected in the next century and beyond. While it has long been suggested that the PETM event was caused by the injection of carbon into the ocean and atmosphere, the source and total amount of carbon, as well as the underlying mechanism have thus far remained elusive. The PETM roughly coincided with the formation of massive flood basalts resulting from of a series of eruptions that occurred as Greenland and North America started separating from Europe, thereby creating the North Atlantic Ocean. What was missing is evidence linking the volcanic activity to the carbon release and warming that marks the PETM.

To identify the source of carbon, the authors measured changes in the balance of isotopes of the element boron in ancient sediment-bound marine fossils called foraminifera to generate a new record of ocean pH throughout the PETM. Ocean pH tells us about the amount of carbon absorbed by ancient seawater, but we can get even more information by also considering changes in the isotopes of carbon, which provide information about the carbon source. When forced with these ocean pH and carbon isotope data, a numerical global climate model implicates large-scale volcanism associated with the opening of the North Atlantic as the primary driver of the PETM.


North Atlantic microfossil-derived isotope records from extinct planktonic foraminiferal species M. subbotinae relative to the onset of the PETM carbon isotope excursion (CIE). The negative trend in carbon isotope composition (A) during the carbon emission phase is accompanied by decreasing pH (decreasing δ11B, panel B) and increasing temperature (decreasing δ18O, panel C). Panels D and E zoom in on the PETM CIE, showing microfossil δ13C (D) and δ11B-based pH (E) reconstructions. Also included in E are data from Penman et al. (2014) on their original age model, with recalculated (lab-based) pH values.


These new results suggest that the PETM was associated with a total input of >12,000 petagrams of carbon from a predominantly volcanic source. This is a vast amount of carbon—30 times larger than all of the fossil fuels burned to date and equivalent to all current conventional and unconventional fossil fuel reserves. In the following Earth System Model simulations, it resulted in the concentration of atmospheric CO2 increasing from ~850 parts per million to >2000 ppm. The Earth’s mantle contains more than enough carbon to explain this dramatic rise, and it would have been released as magma poured from volcanic rifts at the Earth’s surface.

How the ancient Earth system responded to this carbon injection at the PETM can tell us a great deal about how it might respond in the future to man-made climate change. Earth’s warming at the PETM was about what we would expect given the CO2 emitted and what we know about the sensitivity of the climate system based on Intergovernmental Panel on Climate Change (IPCC) reports. However, the rate of carbon addition during the PETM was about twenty times slower than today’s human-made carbon emissions.

In the model outputs, carbon cycle feedbacks such as methane release from gas hydrates—once the favoured explanation of the PETM—did not play a major role in driving the event. Additionally, one unexpected result was that enhanced organic matter burial was important in ultimately drawing down the released carbon out of the atmosphere and ocean and thereby accelerating the recovery of the Earth system.


Authors:
Marcus Gutjahr (National Oceanography Centre Southamption, GEOMAR)
Andy Ridgwell (Bristol University, University of California Riverside)
Philip F. Sexton (The Open University, UK)
Eleni Anagnostou (National Oceanography Centre Southamption)
Paul N. Pearson (Cardiff University)
Heiko Pälike (University of Bremen)
Richard D. Norris (Scripps Institution of Oceanography)
Ellen Thomas (Yale University, Wesleyan University)
Gavin L. Foster (National Oceanography Centre Southamption)


Filter by Keyword

234Th disequilibrium abundance acidification africa air-sea flux air-sea interactions air-sea interface algae alkalinity allometry ammonium AMOC anoxia anoxic Antarctic anthro impacts anthropogenic carbon aquaculture aragonite saturation arctic Argo argon arsenic artificial seawater Atlantic Atlantic modeling atmospheric carbon atmospheric CO2 atmospheric nitrogen deposition authigenic carbonates autonomous platforms bacteria BATS benthic bgc argo bio-go-ship bio-optical bioavailability biogeochemical cycles biogeochemical cycling biogeochemical models biogeochemistry Biological Essential Ocean Variables biological pump biological uptake biophysics bloom blooms blue carbon bottom water boundary layer buffer capacity C14 CaCO3 calcification calcite calcium carbonate carbon-climate feedback carbon-sulfur coupling carbon budget carbon cycle carbon dioxide carbon export carbon sequestration carbon storage Caribbean CCA CCS changi changing marine ecosystems changing marine environments changing ocean chemistry chemical oceanographic data chemical speciation chemoautotroph chesapeake bay chl a chlorophyll circulation climate change climate variability CO2 CO2YS coastal darkening coastal ocean cobalt Coccolithophores community composition conservation cooling effect copepod coral reefs CTD currents cyclone data data access data management data product Data standards DCM dead zone decadal trends decomposers decomposition deep convection deep ocean deep sea coral deoxygenation depth diagenesis diatoms DIC diel migration diffusion dimethylsulfide dinoflagellate discrete measurements dissolved inorganic carbon dissolved organic carbon DOC DOM domoic acid dust DVM earth system models ecology ecosystems ecosystem state eddy Education Ekman transport emissions ENSO enzyme equatorial regions error ESM estuarine and coastal carbon estuarine and coastal carbon fluxes estuary euphotic zone eutrophication evolution export export fluxes export production EXPORTS extreme events extreme weather events faecal pellets filter feeders filtration rates fire fish Fish carbon fisheries floats fluid dynamics fluorescence food webs forage fish forams freshening freshwater frontal zone fronts functional role future oceans geochemistry geoengineering geologic time GEOTRACES glaciers gliders global carbon budget global ocean global warming go-ship grazing greenhouse gas Greenland groundwater Gulf of Maine Gulf of Mexico Gulf Stream gyre harmful algal bloom high latitude human food human impact hurricane hydrogen hydrothermal hypoxia ice age ice cores ice cover industrial onset inverse circulation ions iron iron fertilization isotopes jellies katabatic winds kelvin waves krill kuroshio laboratory vs field land-ocean continuum larvaceans lateral transport LGM lidar ligands light light attenuation lipids mangroves marine carbon cycle marine heatwave marine particles marine snowfall marshes Mediterranean meltwater mesopelagic mesoscale metagenome metals methane methods microbes microlayer microorganisms microscale microzooplankton midwater mixed layer mixed layers mixing mixotrophy modeling models mode water molecular diffusion MPT multi-decade n2o NAAMES NASA NCP net community production net primary productivity new ocean state new technology Niskin bottle nitrate nitrogen nitrogen fixation nitrous oxide north atlantic north pacific nuclear war nutricline nutrient budget nutrient cycling nutrient limitation nutrients OA ocean-atmosphere ocean acidification ocean acidification data ocean carbon uptake and storage ocean color ocean observatories ocean warming ODZ oligotrophic omics OMZ open ocean optics organic particles oscillation overturning circulation oxygen pacific paleoceanography particle flux pCO2 PDO peat pelagic PETM pH phenology phosphorus photosynthesis physical processes physiology phytoplankton PIC plankton POC polar regions pollutants precipitation predation prediction primary production primary productivity Prochlorococcus proteins pteropods pycnocline radioisotopes remineralization remote sensing repeat hydrography residence time resource management respiration resuspension rivers rocky shore Rossby waves Ross Sea ROV salinity salt marsh satell satellite scale seafloor seagrass sea ice sea level rise seasonal patterns seasonal trends sea spray seaweed sediments sensors shelf system shells ship-based observations shorelines silicate silicon cycle sinking particles size SOCCOM soil carbon southern ocean south pacific spatial covariations speciation SST stoichiometry subduction submesoscale subpolar subtropical sulfate surf surface surface ocean Synechococcus teleconnections temperate temperature temporal covariations thermocline thermodynamics thermohaline thorium tidal time-series time of emergence top predators total alkalinity trace elements trace metals trait-based transfer efficiency transient features Tris trophic transfer tropical turbulence twilight zone upper ocean upper water column upwelling US CLIVAR validation velocity gradient ventilation vertical flux vertical migration vertical transport volcano warming water clarity water quality waves western boundary currents wetlands winter mixing world ocean compilation zooplankton

Copyright © 2023 - OCB Project Office, Woods Hole Oceanographic Institution, 266 Woods Hole Rd, MS #25, Woods Hole, MA 02543 USA Phone: 508-289-2838  •  Fax: 508-457-2193  •  Email: ocb_news@us-ocb.org

link to nsflink to noaalink to WHOI

Funding for the Ocean Carbon & Biogeochemistry Project Office is provided by the National Science Foundation (NSF) and the National Aeronautics and Space Administration (NASA). The OCB Project Office is housed at the Woods Hole Oceanographic Institution.