
Estuarine water clarity is determined by suspended materials in the water, including colored dissolved organic matter, phytoplankton, sediment, and detritus. These constituents directly affect temperature because when water is opaque, sunlight heats only the shallowest layers near the surface, but when water is clear, sunlight can penetrate deeper, warming the waters below the surface. Despite the importance of accurately predicting temperature variability, many numerical modeling studies do not adequately parameterize this fundamental relationship between water clarity and temperature.
In a recent study published in Estuaries and Coasts, the authors quantified the impact of a more realistic representation of water clarity in a hydrodynamic-biogeochemical model of the Chesapeake Bay by comparing two simulations: (1) water clarity is constant in space and time for the calculation of solar heating vs. (2) water clarity varies with modeled concentrations of light-attenuating materials. In the variable water clarity simulation (2), the water is more opaque, particularly in the northern region of the Bay. During the spring and summer months, the lower water clarity in the northern Bay is associated with warmer surface temperatures and colder bottom temperatures. Warmer surface temperatures encourage phytoplankton growth and nutrient uptake near the head of the Bay, thus fewer nutrients are transported downstream. These conditions are exacerbated during high-river flow years, when differences in temperature, nutrients, phytoplankton, and zooplankton extend further seaward.
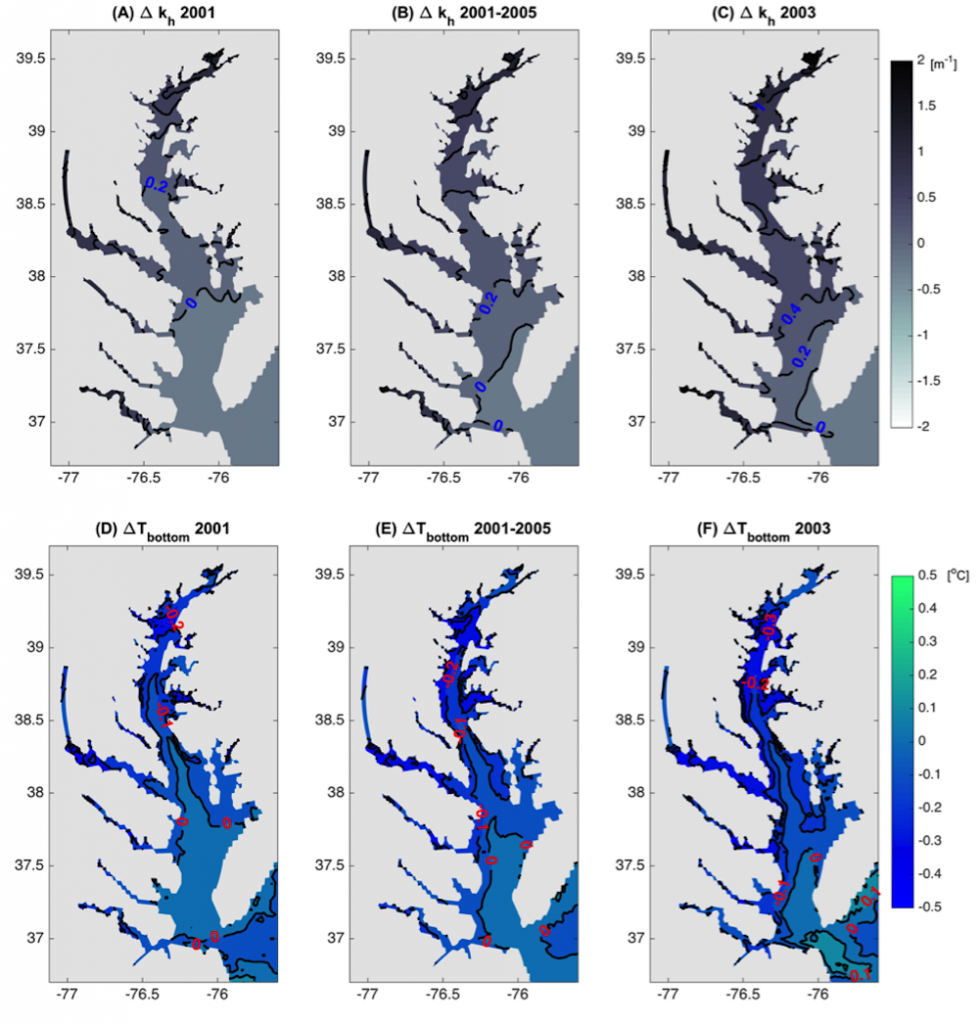
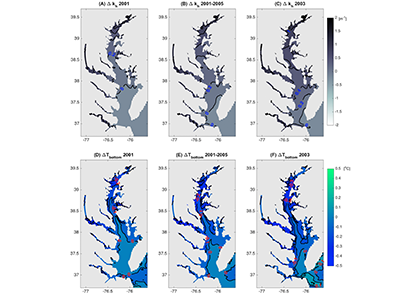
Figure 1: Top row: Difference in the light attenuation coefficient for shortwave heating, kh[m-1] (variable minus constant light attenuation simulation). June, July, and August average for (A) 2001, (B) average of 2001-2005, and (C) 2003; difference in bottom temperatures [oC] (variable minus constant). Bottom row: Difference in June, July, and August average bottom temperature for (D) 2001, (E) average of 2001-2005, and (F) 2003. Data for 2001 are representative of low river discharge, and 2003 are representative high river discharge years.
Authors:
Grace E. Kim (NASA, Goddard Space Flight Center)
Pierre St-Laurent (VIMS, William & Mary)
Marjorie A.M. Friedrichs (VIMS, William & Mary)
Antonio Mannino (NASA, Goddard Space Flight Center)

