Ocean Carbon & Biogeochemistry
Studying marine ecosystems and biogeochemical cycles in the face of environmental change
  • Home
  • About OCB
    • About Us
    • Scientific Breadth
      • Biological Pump
      • Changing Marine Ecosystems
      • Changing Ocean Chemistry
      • Estuarine and Coastal Carbon Fluxes
      • Ocean Carbon Uptake and Storage
      • Ocean Observatories
    • Code of Conduct
    • Get Involved
    • Project Office
    • Scientific Steering Committee
    • OCB committees
      • OCSIF – Ocean Carbonate System Intercomparison
      • Ocean-Atmosphere Interaction
      • Ocean Time-series
      • US Biogeochemical-Argo
  • Activities
    • 20 years of OCB Symposium – 18 November 2026
    • OCB Webinars
    • Summer Workshop
    • Guidelines for OCB Workshops & Activities
    • Topical Workshops
      • 7th DMS(P) Symposium
      • Marine Virus Workshop
      • Completed
        • CMIP6 Models Workshop
        • Coastal BGS Obs with Fisheries
        • C-saw extreme events workshop
        • Expansion of BGC-Argo and Profiling Floats
        • Fish, fisheries and carbon
        • Future BioGeoSCAPES program
        • GO-BCG Scoping Workshop
        • Lateral Carbon Flux in Tidal Wetlands
        • Leaky Deltas Workshop
        • Marine CDR Workshop
        • Ocean Nucleic Acids ‘Omics
        • Pathways Connecting Climate Changes to the Deep Ocean
    • Small Group Activities
      • BECS Benthic Ecosystem and Carbon Synthesis WG
      • Metabarcoding intercal WG
      • Meta-eukomics WG
      • Metaproteomic Intercomparison
      • SedMIP
      • Recently completed
        • Aquatic Continuum OCB-NACP Focus Group
        • Arctic-COLORS Data Synthesis
        • Carbon Isotopes in the Ocean Workshop
        • CMIP6 WG
        • Filling the gaps air–sea carbon fluxes WG
        • Fish Carbon WG
        • mCDR
        • Mixotrophs & Mixotrophy WG
        • N-Fixation WG
        • Ocean Carbonate System Intercomparison Forum
        • Ocean Carbon Uptake WG
        • OOI BGC sensor WG
        • Operational Phytoplankton Observations WG
        • Phytoplankton Taxonomy WG
    • Other Workshops
    • Science Planning
      • Coastal CARbon Synthesis (CCARS)
      • North Atlantic-Arctic
    • Ocean Acidification PI Meetings
    • Training Activities
      • PACE Hackweek 2025
      • PACE Hackweek 2024
      • PACE Training Activity 2022
  • Science Support
    • OCB Activity Proposal Solicitation
    • Guidelines for OCB Workshops & Activities
    • Data management and archival
    • Early Career
    • Funding Sources
    • Jobs & Postdocs
    • Meeting List
    • OCB Topical Websites
      • Ocean Fertilization
      • Trace gases
      • US IIOE-2
    • Outreach & Education
    • Promoting your science
    • Student Opportunities
    • Travel Support
  • Publications
    • OCB Workshop Reports
    • Science Planning and Policy
    • Newsletter Archive
  • Science Highlights
  • News

Archive for temperature

Impacts of warming and circulation slowdown on future ocean carbon cycle feedback

Posted by mmaheigan 
· Friday, August 14th, 2026 

The ocean has absorbed a quarter of anthropogenic CO2 emissions, mitigating changes. However, predicting the future fate of this ‘sink’ is challenging as marine carbon is regulated by a complex set of interacting processes that respond differently to warming. Our recent study teases apart these interactions with a novel mechanistic carbon decomposition and attribution framework applied to an ocean biogeochemical model driven by output from a climate model, to quantify the impact of changes in different forcing factors, such as warming and circulation, on marine carbon storage and the consequent feedback on atmospheric CO2.
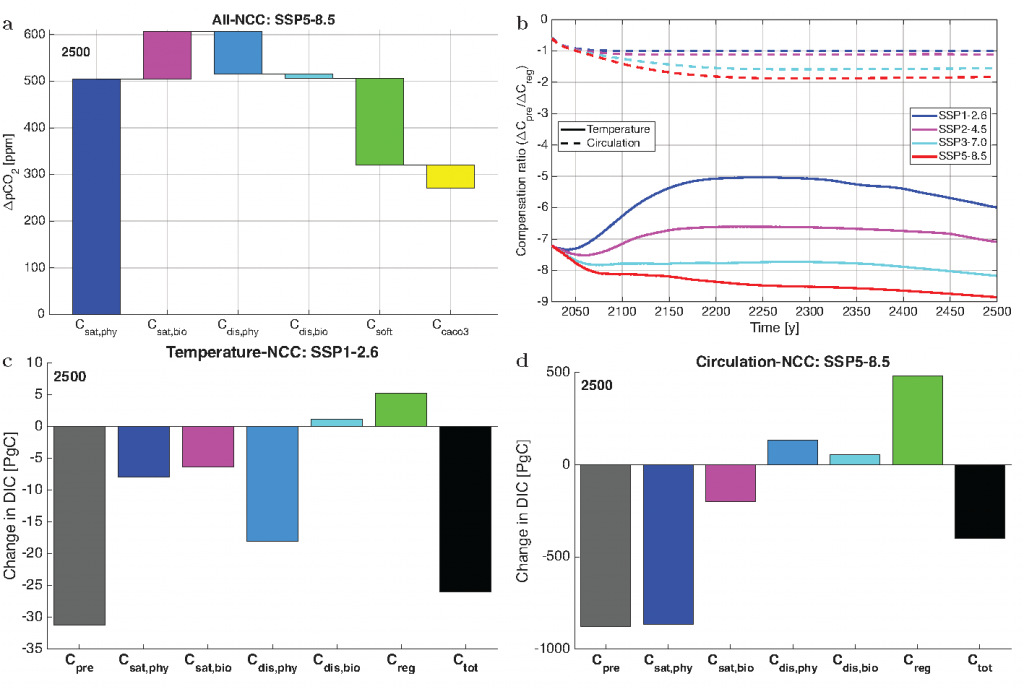
Figure: (a) Waterfall chart attributing changes in atmospheric CO2 (pCO2atm) (relative to a simulation with no climate change; NCC) to different carbon components for the SSP5-8.5 high-emission scenario. Each bar represents a component with its height corresponding to the (positive or negative) change in pCO2atm due to that component. The cumulative change in pCO2atm as successive components are added is shown from left to right. Subscripts are: sat=saturation, dis=disequilibrium, soft=soft tissue remineralization, caco3=CaCO3 dissolution, phy=physical process, and bio=biological process. (b) Compensation ratio of change (∆) in preformed to regenerated carbon with respect to NCC in the Temperature (solid lines) and Circulation (dashed lines) attribution experiments for the four emission scenarios studied as a function of time. (c) Change in carbon components with respect to NCC in year 2500 due to temperature under the SSP1-2.6 low-emission scenario. (d) Change in carbon components with respect to NCC in year 2500 due to circulation under SSP5-8.5.

We find that under a high-emission scenario, global warming reduces marine carbon storage and raises atmospheric CO2 in 2500 by ~270 ppm (Fig panel a), a positive feedback. This is due to a decrease in ocean CO2 uptake (Csat,phy), compensated in part by an increase in biologically regenerated carbon (Csoft & Ccaco3). While previous studies have also found this compensation, they have ascribed it largely to a slowdown in ocean circulation. Our attribution experiments instead show that the degree of compensation depends strongly on the process and emission scenario (Panel b). Reduced CO2 uptake due to a slower circulation is half-compensated by increased regenerated carbon under high emissions, but almost exactly compensated for under the lowest emission scenario (dashed lines). On the other hand, temperature-driven changes in uptake and regeneration are mostly uncompensated (solid lines); the direct effects of warming thus dominate under low-emission, high-mitigation scenarios, while also contributing a third of the decrease in carbon storage at the highest emissions. Air-sea disequilibrium, as revealed by the carbon decomposition, provides an explanation. Warming enhances physical disequilibrium because of an increase in the meridional sea surface temperature gradient; this is the leading cause of the decrease in carbon storage under low emissions (Panel c). In contrast, for high emissions (Panel d) a slowdown in circulation decreases physical disequilibrium, amplifying the impact of increased biological carbon sequestration in compensating for reduced CO2 uptake. In summary, temperature dominates the climate-carbon cycle feedback for low emission scenarios, and circulation for high emission scenarios. This study provides new mechanistic insights into how the marine carbon cycle responds to change, and highlights the need for accurate partitioning of carbon components in Earth System Models.


Authors:
Samar Khatiwala (Waseda University)
Olivia Strachan (Independent Researcher)
Andreas Schmittner (Oregon State University)

Citation: Khatiwala, S., O. Strachan and A. Schmittner (2026). Multi-centennial response of marine carbon pumps to global warming, Nature Climate Change, https://doi.org/10.1038/s41558-026-02686-x.

Research Briefing (accompanying the main article): Warming dominates over circulation slowdown in reducing marine carbon storage under high-mitigation scenarios, Nature Climate Change, https://doi.org/10.1038/s41558-026-02687-w.
Phytoplankton respond more consistently to nutrient pulses than marine heat waves

Posted by mmaheigan 
· Monday, June 29th, 2026 

How do phytoplankton respond to short-term changes in temperature and nutrient availability, and how does this response vary under different baseline conditions?

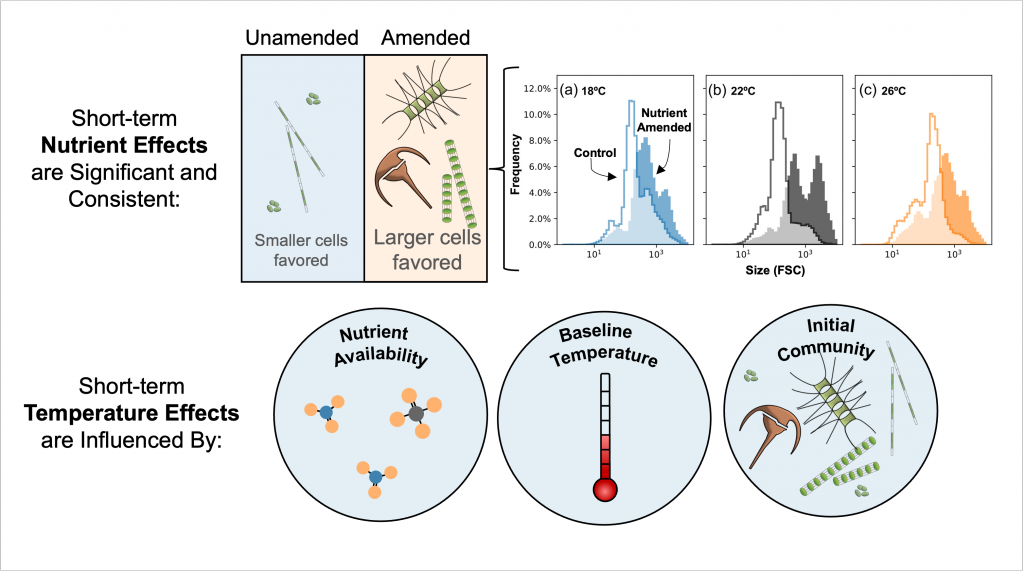
A recent study perturbed a summer plankton community by manipulating nutrient concentrations and temperature (±4°C) in short-term controlled microcosms to assess the relative impacts of each factor on phytoplankton physiology and community structure. Nutrient amendments rapidly shifted the phytoplankton community towards larger cells, altered elemental stoichiometry, and reduced microzooplankton grazing. Conversely, temperature changed community composition, but had no impact on size or stoichiometry. These results paralleled a similar spring incubation and regional field studies, which together suggest that over short time scales (days) nutrient amendments may produce more consistent and significant impacts on phytoplankton composition and physiology than temperature or grazing. Though temperature is a significant driver of phytoplankton dynamics globally, the impacts of short-term temperature changes, like marine heat waves, may depend on baseline thermal conditions, the starting plankton community, and the availability of nutrients to cope with increased metabolic demands. Understanding baseline conditions will be central to deciphering how short-term temperature changes may impact phytoplankton communities and the ecosystems they support.

Figure caption. Illustrative diagram showing the impacts of short-term nutrient amendments on phytoplankton communities, and the factors that influence the thermal response. Frequency distribution plots show how the community size structure <20 µm differed between the nutrient amended treatment (solid) and the control (white) on day 4 of the incubation experiments, as discerned via flow cytometry forward scatter (FSC).

Authors
Stephanie I. Anderson (University of Rhode Island)
Gayantonia Franzè (University of Rhode Island & Institute of Marine Research)
Joshua D. Kling (University of Southern California)
Paul Wilburn (Michigan State University)
Colin T. Kremer (University of Connecticut)
Susanne Menden-Deuer (University of Rhode Island)
Elena Litchman (Michigan State University)
David A. Hutchins (University of Southern California)
Tatiana A. Rynearson (University of Rhode Island)

Bluesky
@drplankton.bsky.social
@quant-ecology.bsky.social
@elenalitchman.bsky.social
@stephanieianderson.bsky.social

Adaptive emission pathways to stabilize global temperatures

Posted by mmaheigan 
· Thursday, May 11th, 2023 

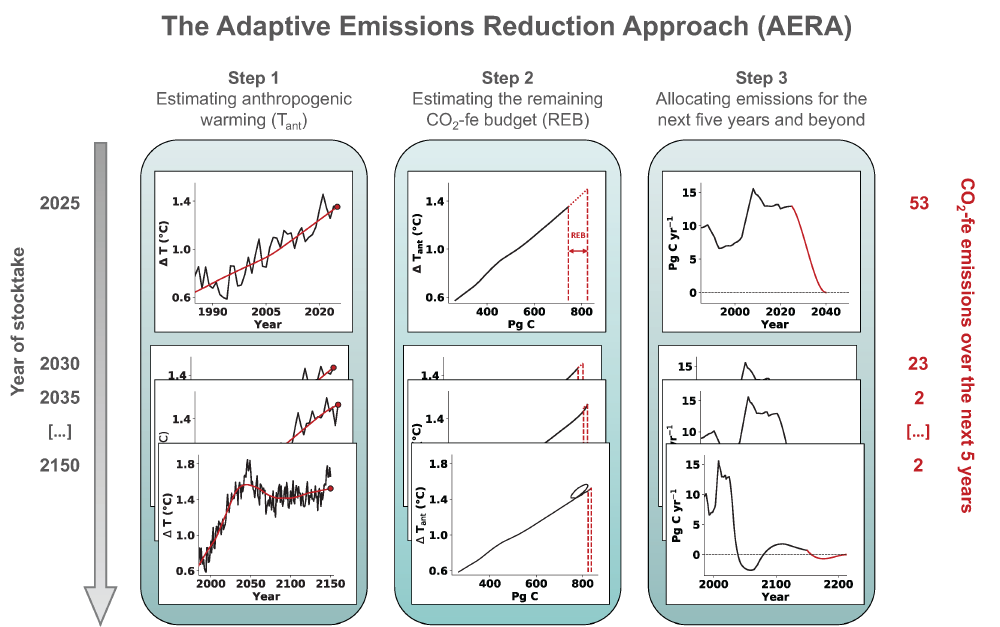
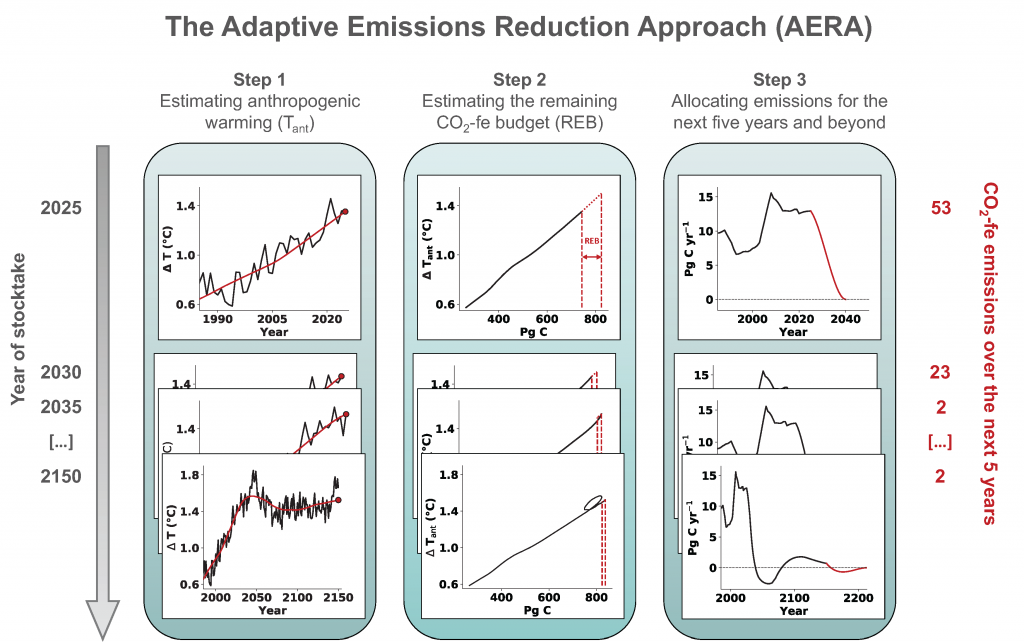
Around the world, countries have agreed in the Paris Agreement to limit global warming well below 2°C and to pursue efforts to reduce global warming to 1.5°C. However, large uncertainties remain about which emission pathways will allow us to reach this goal. A recent paper presents a new adaptive approach to create emission pathways and estimate the necessary emission reductions every five years, following the stocktake process of the Paris Agreement. This Adaptive Emissions Reduction Approach (AERA) is solely based on past warming rates, and emissions of CO2 and non-CO2 radiative agents, and explicitly does not rely on projections by Earth System Models. Updating the emission pathways every five years, circumvents uncertainties in the climate system and its transient response to cumulative emissions (TCRE). Testing with the Bern3D-LPX Earth System Model of Intermediate Complexity shows that the approach works robustly across a wide range of TCREs, avoids large overshoots, and only small changes to the emission pathways are necessary every five years. This approach will allow policymakers to estimate emission pathways and create a base for international negotiations. Furthermore, it allows simulations with Earth System Models that all converge to the same temperature target to compare the climate at stabilized warming levels.

Figure caption: The three steps of the Adaptive Emission Reduction Approach: 1) Estimating the past anthropogenic warming, 2) estimating the remaining emission budget, and 3) redistributing it over the future years.


Authors
Jens Terhaar (University of Bern, now Woods Hole Oceanographic Institution)
Thomas L Frölicher (University of Bern)
Mathias T Aschwanden (University of Bern)
Pierre Friedlingstein (University of Exeter, Ecole Normale Superieure)
Fortunat Joos (University of Bern)


Twitter @JensTerhaar @froeltho @PFriedling @unibern @snsf_ch @4C_H2020 @ExeterUniMaths @Geosciences_ENS @IPSL_outreach

Drivers of recent Chesapeake Bay warming

Posted by mmaheigan 
· Friday, August 26th, 2022 

Coastal water temperatures have been increasing globally with more frequent marine heat waves threatening marine life and nearshore communities reliant upon these ecosystems. Often, this warming is assumed to be uniform in space and time; however, this is not the case in the Chesapeake Bay, where warming waters play a major role in exacerbating low oxygen levels and indirectly limiting the efficacy of nutrient reduction efforts on land.

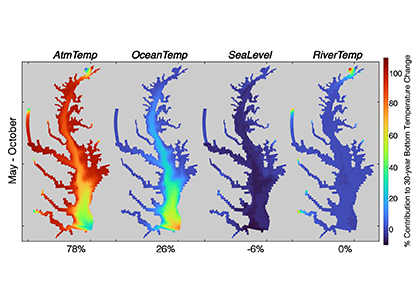
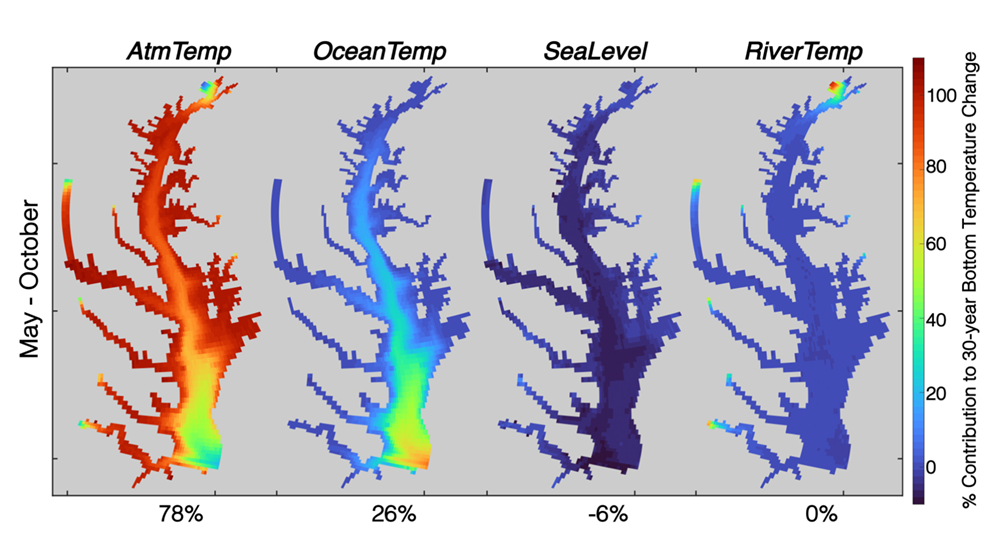
New research published in the Journal of the American Water Resources Association combined long-term observations and a hydrodynamic model to quantify the temporal and spatial variability in warming Chesapeake Bay waters, and identify the contributions of different mechanisms driving these historical temperature changes. While winter temperatures have warmed by less than a half a degree over the past 30 years, summer temperatures have warmed by nearly 1.5 °C, with similar increases at the surface and bottom. In cooler months, the atmosphere was the dominant driver of warming throughout the majority of the Bay, but oceanic warming explained more than half of the increased summer temperatures in the southern Bay nearest the Atlantic.

Figure 1: Relative contribution of different factors to warm-month Chesapeake Bay temperature change over the period 1985-2015. Percentages correspond to average main channel contributions for each component.

Warming temperatures have potentially significant implications for the future size of the Chesapeake Bay dead zone, and the marine species directly affected by these low oxygen conditions. Better quantifying warming contributions from the atmosphere, ocean, sea level, and rivers will also help constrain regional temperature projections throughout the estuary. More accurate projections of future Bay temperatures can help coastal managers better understand the potential for invasive species expansion and endemic species loss, impacts to fisheries and aquaculture, and how changes to ecosystem processes may impact coastal communities dependent on a healthy Bay.


Authors:
Kyle E. Hinson (Virginia Institute of Marine Science, William & Mary)
Marjorie A. M. Friedrichs (Virginia Institute of Marine Science, William & Mary)
Pierre St-Laurent (Virginia Institute of Marine Science, William & Mary)
Fei Da (Virginia Institute of Marine Science, William & Mary)
Raymond G. Najjar (The Pennsylvania State University)

What drives decadal changes in the Chesapeake Bay carbonate system?

Posted by mmaheigan 
· Tuesday, May 3rd, 2022 

Understanding decadal changes in the coastal carbonate system (CO2-system) is essential for predicting how the health of these waters is affected by anthropogenic drivers, such as changing atmospheric conditions and terrestrial inputs. However, studies that quantify the relative impacts of these drivers are lacking.

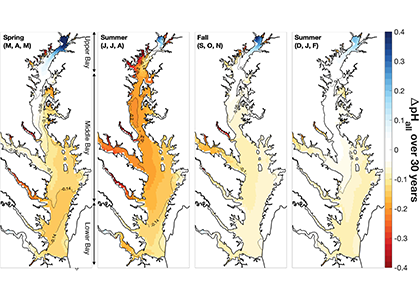
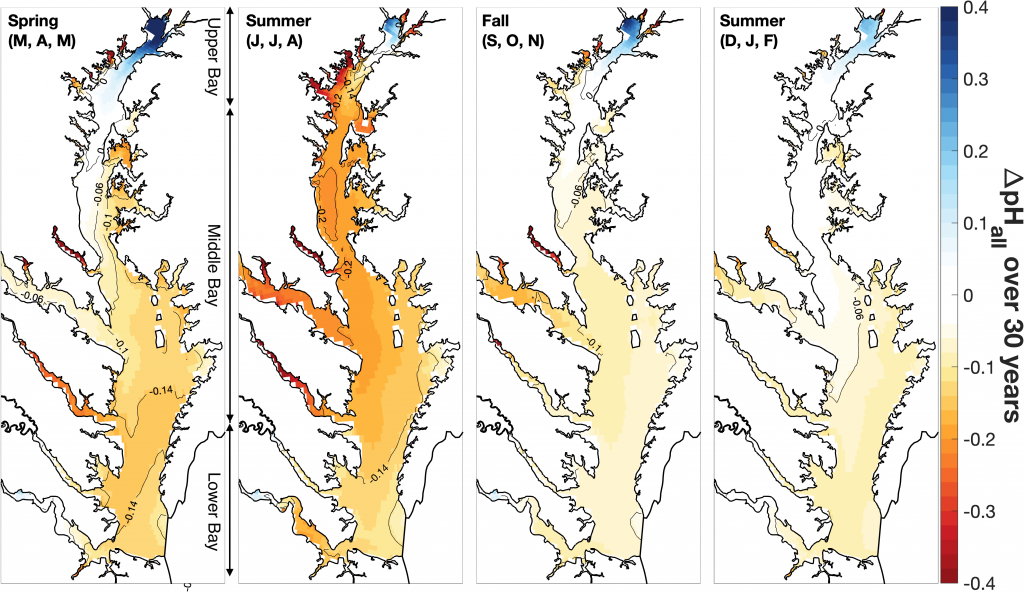
A recent study in Journal of Geophysical Research: Oceans identified the primary drivers of acidification in the Chesapeake Bay over the past three decades. The authors used a three-dimensional hydrodynamic-biogeochemistry model to quantify the relative impacts on the Bay CO2-system from increases in atmospheric CO2, temperature, oceanic dissolved inorganic carbon (DIC) concentrations, terrestrial loadings of total alkalinity (TA) and DIC, as well as decreases in terrestrial nutrient inputs. Decadal changes in the surface CO2-system in the Chesapeake Bay exhibit large spatial and seasonal variability due to the combination of influences from the land, ocean and atmosphere. In the upper Bay, increased riverine TA and DIC from the Susquehanna River have increased surface pH, with other drivers only contributing to decadal changes that are one to two orders of magnitude smaller. In the mid- and lower Bay, higher atmospheric CO2 concentrations and reduced nutrient loading are the two most critical drivers and have nearly equally reduced surface pH in the summer. These decadal changes in surface pH show significant seasonal variability with the greatest magnitude generally aligning with the spring and summer shellfish production season (Figure 1).

Figure 1: Overall changes in modeled surface pH (ΔpHall) due to all global and terrestrial drivers combined over the past 30 years (i.e., 2015–2019 relative to 1985–1989). ΔpHall includes changes in surface pH due to increased atmospheric CO2, increased atmospheric thermal forcing, increased oceanic dissolved inorganic carbon concentrations, decreased riverine nitrate concentrations, decreased riverine organic nitrogen concentrations, and increased riverine total alkalinity and dissolved inorganic carbon concentrations.


These results indicate that a number of global and terrestrial drivers play crucial roles in coastal acidification. The combined effects of the examined drivers suggest that calcifying organisms in coastal surface waters are likely facing faster decreasing rates of pH than those in open ocean ecosystems. Decreases in surface pH associated with nutrient reductions highlight that the Chesapeake Bay ecosystem is returning to a more natural condition, e.g., a condition when anthropogenic nutrient input from the watershed was lower. However, increased atmospheric CO2 is simultaneously accelerating the rate of change in pH, exerting increased stress on estuarine calcifying organisms. For ecosystems such as the Chesapeake Bay where nutrient loading is already being managed, controlling the emissions of anthropogenic CO2 globally becomes increasingly important to decelerate the rate of acidification and to relieve the stress on estuarine calcifying organisms. Future observational and modeling studies are needed to further investigate how the decadal trends in the Chesapeake Bay CO2-system may vary with depth. These efforts will improve our current understanding of long-term change in coastal carbonate systems and their impacts on the shellfish industry.


Authors:
Fei Da (Virginia Institute of Marine Science, William & Mary, USA)
Marjorie A. M. Friedrichs (Virginia Institute of Marine Science, William & Mary, USA)
Pierre St-Laurent (Virginia Institute of Marine Science, William & Mary, USA)
Elizabeth H. Shadwick (CSIRO Oceans and Atmosphere, Australia)
Raymond G. Najjar (The Pennsylvania State University, USA)
Kyle E. Hinson (Virginia Institute of Marine Science, William & Mary, USA)

Predators Set Range for the Ocean’s Most Abundant Phytoplankton

Posted by mmaheigan 
· Friday, April 1st, 2022 

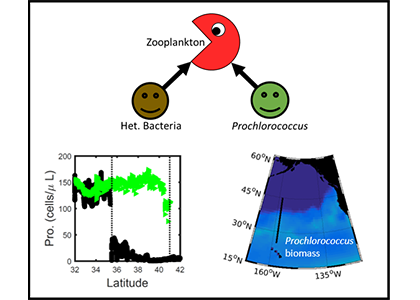
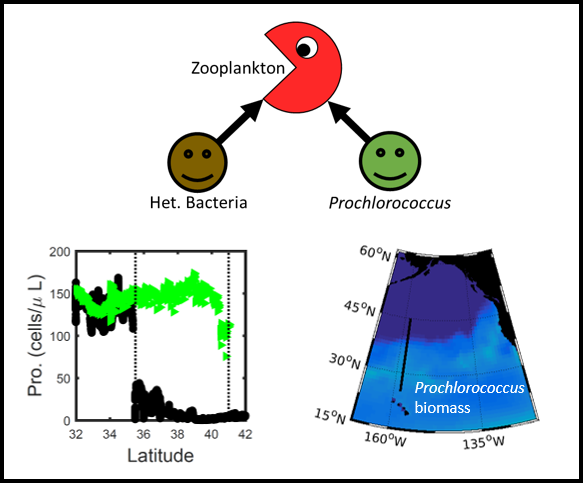
Prochlorococcus is the world’s smallest phytoplankton (microscopic plant-like organisms) and the most numerous, with more than ten septillion individuals. This tiny plankton lives ubiquitously in warm, blue, tropical waters but is conspicuously absent in more polar regions. The prevailing theory was the cold: Prochlorococcus doesn’t grow at low temperatures. In a recent paper, the authors argue ecological control, in particular, predation by zooplankton. Cold polar waters are greener because they contain more nutrients, leading to more life and more organic matter production. This production feeds more and larger heterotrophic bacteria, who then feed larger predators—specifically the same zooplankton that consume Prochlorococcus. If the shared zooplankton increases enough, it will consume Prochlorococus faster than it can grow, causing the species to collapse at higher latitudes. These results show that an understanding of both ecology and temperature is required to predict how these ecosystems will shift in a warming ocean.

Figure 1: Surface populations of Prochlorococcus collapse (dashed lines) moving northward from Hawaii as seen in transects (transect line shown in red on map, lower left) from cruises in April 2016 (black dots) and September 2017 (green triangles). This collapse of the Prochlorococcus emerges in dynamical computer models (lower right, color indicates Prochlorococcus biomass in mgC/m3) when heterotrophic bacteria and Prochlorococcus share a grazer (top schematic). Increased organic production heading poleward first increases the heterotrophic bacterial population, increasing the shared zooplankton population which eventually consumes Prochlorococcus faster than it can grow (dashed contour).

Authors
Christopher L. Follett (MIT)
Stephanie Dutkiewicz (MIT)
François Ribalet (UW)
Emily Zakem (USC)
David Caron (USC)
E. Virginia Armbrust (UW)
Michael J. Follows (MIT)

Wildfire impacts on coastal ocean phytoplankton

Posted by mmaheigan 
· Wednesday, February 24th, 2021 

Wildfire frequency, size, and destructiveness has increased over the last two decades, particularly in coastal regions such as Australia, Brazil, and the western United States. While the impact of fire on land, plants, and people is well documented, very few studies have been able to evaluate the impact of fires on ocean ecosystems. A serendipitously planned research cruise one week after the Thomas Fire broke out in California in December 2017 allowed the authors of this study and their colleagues to sample the adjacent Santa Barbara Channel during this devastating extreme fire event.

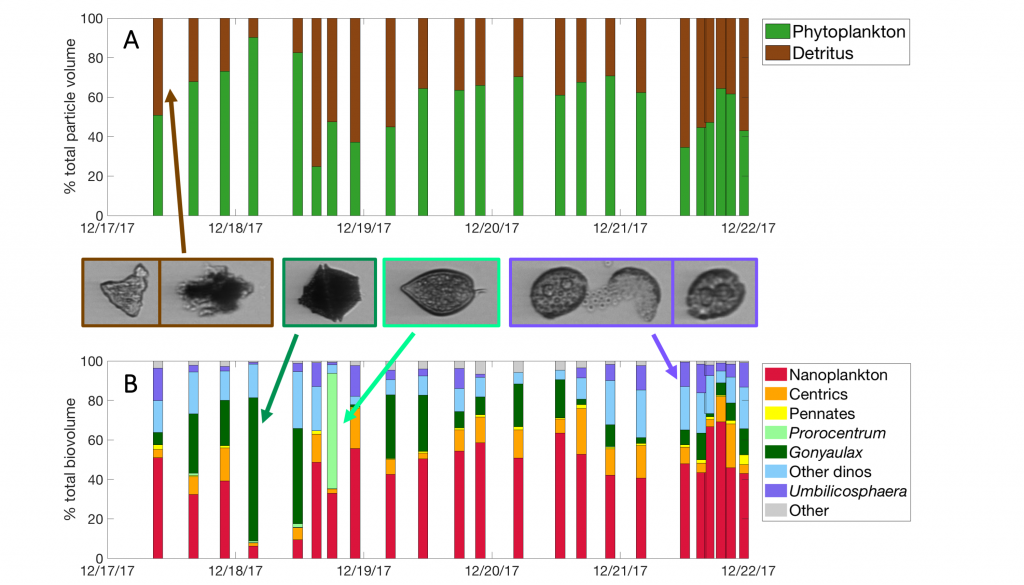
In a recent paper published in Journal of Geophysical Research: Oceans, the authors describe the phytoplankton community in the Santa Barbara Channel during the Thomas Fire. Phytoplankton community composition was described using a combination of images of phytoplankton from the Imaging FlowCytobot (McLane Labs) and phytoplankton pigments. Dinoflagellates were the dominant phytoplankton group in the surface ocean during the Thomas Fire, according to both methods (Figure 1).

Figure 1. (A) The fraction of total particle volume imaged by the Imaging FlowCytobot (IFCB) comprised of phytoplankton (green) and detritus (brown). Example IFCB images of ash (counted as part of detritus) particles are outlined in brown. (B) The phytoplankton fraction is then further divided by taxonomy, showing the abundance of nano-sized phytoplankton and especially dinoflagellates during the week of sampling. Example IFCB images of Gonyaulax (outlined in dark green), Prorocentrum (outlined in light green), and Umbilicosphaera (outlined in purple) cells are also shown.


While this study was not able to demonstrate a causal relationship between the Thomas Fire and the presence of dinoflagellates, this result is quite different from previous winters in the Santa Barbara Channel, when picophytoplankton and diatoms typically dominate the winter community. The incidence of dinoflagellates in the Santa Barbara Channel in December 2017 was correlated with the warmer-than-average water temperature during this study, which matched observations from other areas along the Central California coast that winter.

At the time this study was conducted, the Thomas Fire was the largest wildfire in California history. Since then, California fires have increased in danger, destruction, and human mortality; the Mendocino Fire complex (summer 2018) and five separate wildfires in summer 2020 exceeded the impacts of the Thomas Fire. With wildfire severity and frequency increasing not only in California but in coastal regions worldwide, this study gives an important first look at the impact of wildfire smoke and ash on oceanic primary productivity and community composition.


Authors:
Sasha Kramer (University of California Santa Barbara)
Kelsey Bisson (Oregon State University)
Alexis Fischer (University of California Santa Cruz)

Water clarity impacts temperature and biogeochemistry in Chesapeake Bay

Posted by mmaheigan 
· Thursday, December 3rd, 2020 

Estuarine water clarity is determined by suspended materials in the water, including colored dissolved organic matter, phytoplankton, sediment, and detritus. These constituents directly affect temperature because when water is opaque, sunlight heats only the shallowest layers near the surface, but when water is clear, sunlight can penetrate deeper, warming the waters below the surface. Despite the importance of accurately predicting temperature variability, many numerical modeling studies do not adequately parameterize this fundamental relationship between water clarity and temperature.

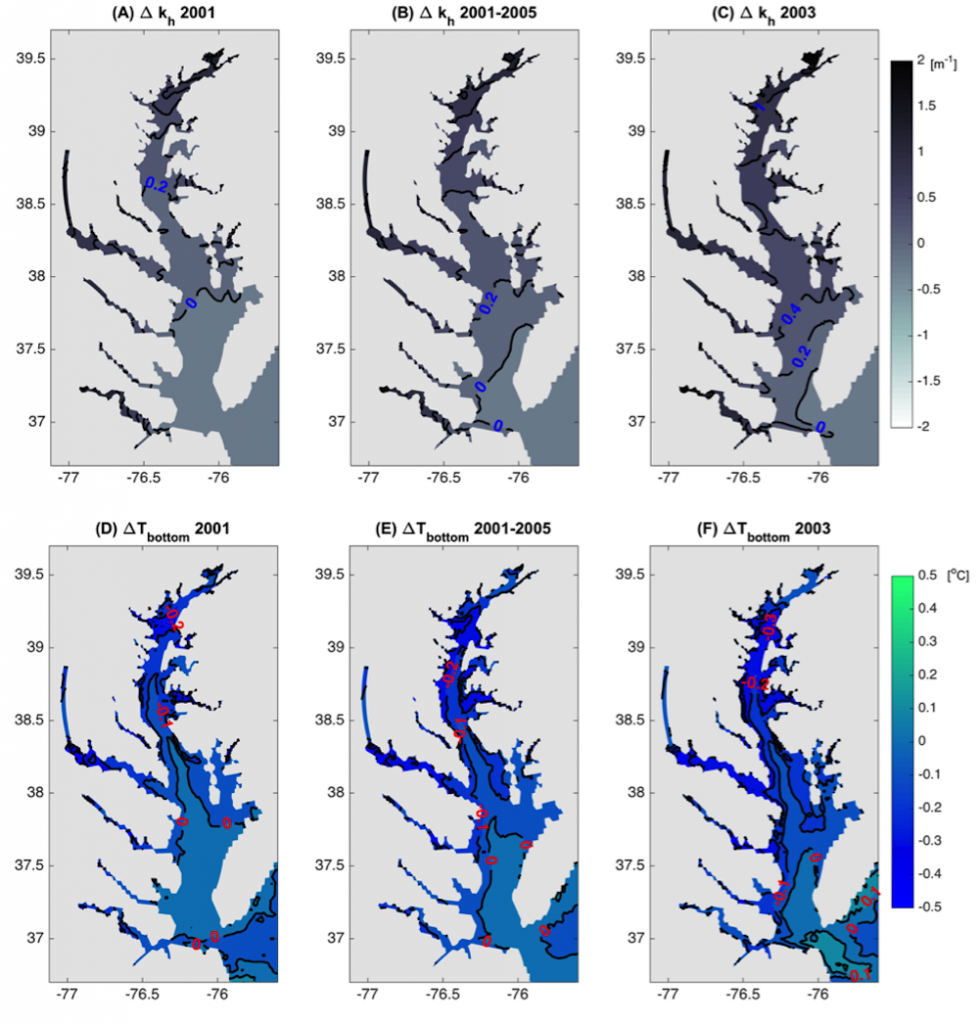
In a recent study published in Estuaries and Coasts, the authors quantified the impact of a more realistic representation of water clarity in a hydrodynamic-biogeochemical model of the Chesapeake Bay by comparing two simulations: (1) water clarity is constant in space and time for the calculation of solar heating vs. (2) water clarity varies with modeled concentrations of light-attenuating materials. In the variable water clarity simulation (2), the water is more opaque, particularly in the northern region of the Bay. During the spring and summer months, the lower water clarity in the northern Bay is associated with warmer surface temperatures and colder bottom temperatures. Warmer surface temperatures encourage phytoplankton growth and nutrient uptake near the head of the Bay, thus fewer nutrients are transported downstream. These conditions are exacerbated during high-river flow years, when differences in temperature, nutrients, phytoplankton, and zooplankton extend further seaward.

Figure 1: Top row: Difference in the light attenuation coefficient for shortwave heating, kh[m-1] (variable minus constant light attenuation simulation). June, July, and August average for (A) 2001, (B) average of 2001-2005, and (C) 2003; difference in bottom temperatures [oC] (variable minus constant). Bottom row: Difference in June, July, and August average bottom temperature for (D) 2001, (E) average of 2001-2005, and (F) 2003. Data for 2001 are representative of low river discharge, and 2003 are representative high river discharge years.

This work demonstrates that a constant light attenuation scheme for heating calculations in coupled hydrodynamic-biogeochemical models underestimates temperature variability, both temporally and spatially. This is an important finding for researchers who use models to predict future temperature variability and associated impacts on biogeochemistry and species habitability.


Authors:
Grace E. Kim (NASA, Goddard Space Flight Center)
Pierre St-Laurent (VIMS, William & Mary)
Marjorie A.M. Friedrichs (VIMS, William & Mary)
Antonio Mannino (NASA, Goddard Space Flight Center)

Volcanic carbon dioxide drove ancient global warming event

Posted by mmaheigan 
· Thursday, March 29th, 2018 

A study recently published in Nature suggests that an extreme global warming event 56 million years ago known as the Palaeocene-Eocene Thermal Maximum (PETM) was driven by massive CO2 emissions from volcanoes during the formation of the North Atlantic Ocean. Using a combination of new geochemical measurements and novel global climate modelling, the study revealed that atmospheric CO2 more than doubled in less than 25,000 years during the PETM.

The PETM lasted ~150,000 years and is the most rapid and extreme natural global warming event of the last 66 million years. During the PETM, global temperatures increased by at least 5°C, comparable to temperatures projected in the next century and beyond. While it has long been suggested that the PETM event was caused by the injection of carbon into the ocean and atmosphere, the source and total amount of carbon, as well as the underlying mechanism have thus far remained elusive. The PETM roughly coincided with the formation of massive flood basalts resulting from of a series of eruptions that occurred as Greenland and North America started separating from Europe, thereby creating the North Atlantic Ocean. What was missing is evidence linking the volcanic activity to the carbon release and warming that marks the PETM.

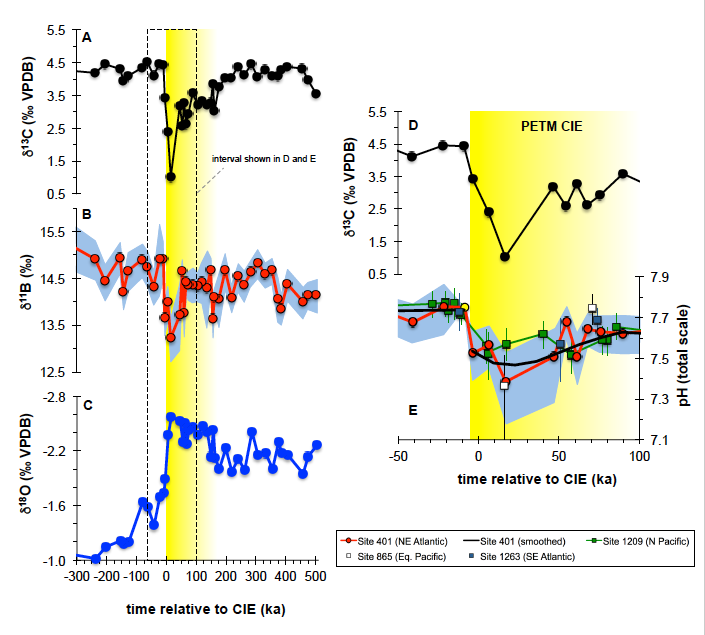
To identify the source of carbon, the authors measured changes in the balance of isotopes of the element boron in ancient sediment-bound marine fossils called foraminifera to generate a new record of ocean pH throughout the PETM. Ocean pH tells us about the amount of carbon absorbed by ancient seawater, but we can get even more information by also considering changes in the isotopes of carbon, which provide information about the carbon source. When forced with these ocean pH and carbon isotope data, a numerical global climate model implicates large-scale volcanism associated with the opening of the North Atlantic as the primary driver of the PETM.


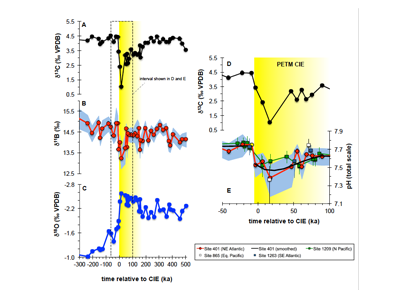
North Atlantic microfossil-derived isotope records from extinct planktonic foraminiferal species M. subbotinae relative to the onset of the PETM carbon isotope excursion (CIE). The negative trend in carbon isotope composition (A) during the carbon emission phase is accompanied by decreasing pH (decreasing δ11B, panel B) and increasing temperature (decreasing δ18O, panel C). Panels D and E zoom in on the PETM CIE, showing microfossil δ13C (D) and δ11B-based pH (E) reconstructions. Also included in E are data from Penman et al. (2014) on their original age model, with recalculated (lab-based) pH values.


These new results suggest that the PETM was associated with a total input of >12,000 petagrams of carbon from a predominantly volcanic source. This is a vast amount of carbon—30 times larger than all of the fossil fuels burned to date and equivalent to all current conventional and unconventional fossil fuel reserves. In the following Earth System Model simulations, it resulted in the concentration of atmospheric CO2 increasing from ~850 parts per million to >2000 ppm. The Earth’s mantle contains more than enough carbon to explain this dramatic rise, and it would have been released as magma poured from volcanic rifts at the Earth’s surface.

How the ancient Earth system responded to this carbon injection at the PETM can tell us a great deal about how it might respond in the future to man-made climate change. Earth’s warming at the PETM was about what we would expect given the CO2 emitted and what we know about the sensitivity of the climate system based on Intergovernmental Panel on Climate Change (IPCC) reports. However, the rate of carbon addition during the PETM was about twenty times slower than today’s human-made carbon emissions.

In the model outputs, carbon cycle feedbacks such as methane release from gas hydrates—once the favoured explanation of the PETM—did not play a major role in driving the event. Additionally, one unexpected result was that enhanced organic matter burial was important in ultimately drawing down the released carbon out of the atmosphere and ocean and thereby accelerating the recovery of the Earth system.


Authors:
Marcus Gutjahr (National Oceanography Centre Southamption, GEOMAR)
Andy Ridgwell (Bristol University, University of California Riverside)
Philip F. Sexton (The Open University, UK)
Eleni Anagnostou (National Oceanography Centre Southamption)
Paul N. Pearson (Cardiff University)
Heiko Pälike (University of Bremen)
Richard D. Norris (Scripps Institution of Oceanography)
Ellen Thomas (Yale University, Wesleyan University)
Gavin L. Foster (National Oceanography Centre Southamption)


Increased temperatures suggest reduced capacity for carbon

Posted by mmaheigan 
· Thursday, January 18th, 2018 

The ocean’s biological pump works to draw down atmospheric carbon dioxide (CO2) by exporting carbon from the surface ocean. This process is less efficient at higher temperatures, implying a possible climate feedback. Recent work by Cael et al. provides an explanation of why this feedback occurs and an estimate of its severity.

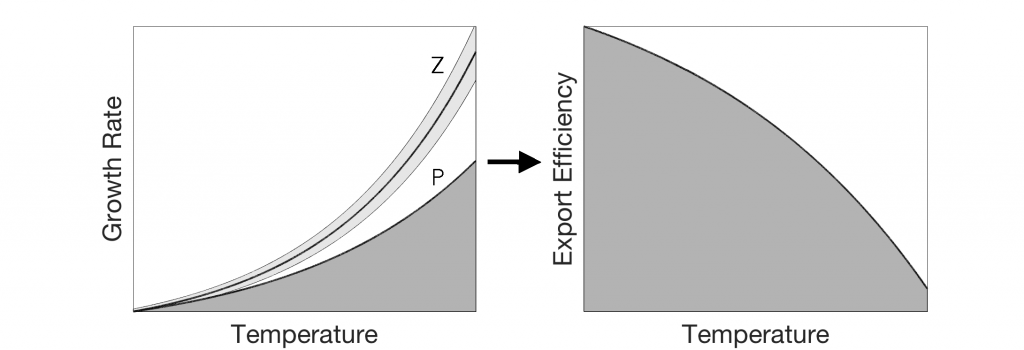
In a highly simplified view, carbon export depends on the balance between two temperature-dependent processes: 1) The autotrophic production and 2) the heterotrophic respiration of organic carbon. Cael and Follows (Geophysical Research Letters 2016) recently developed a mechanistic model based on established temperature dependencies for photosynthesis and respiration to explore feedbacks between export efficiency and climate. Heterotrophic growth rates increase more so than phototrophic rates with increasing temperature, which suggests that at higher temperatures, community respiration will increase relative to production, thereby decreasing export efficiency. Although simplistic, the model captures the temperature dependence of export efficiency observations.

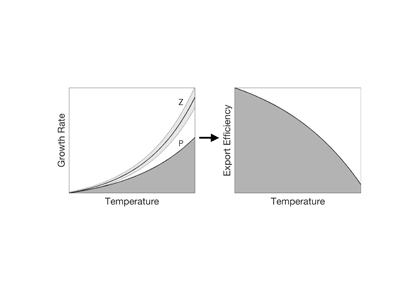
Figure: Schematic of the mechanism on which the Cael and Follows (2016) model is based. (a) Photosynthesis (dark grey) and respiration (light grey) respond to temperature differently, yielding (b) a decline in export efficiency at higher temperatures.

More recently, Cael, Bisson, and Follows (Limnology and Oceanography 2017) applied this model to sea surface temperature records and estimated a ~1.5% decline in globally-averaged export efficiency over the past three decades of increasing ocean temperatures as a result of this metabolic mechanism. This ~1.5% decline is equivalent to a reduced ocean sequestration of approximately 100 million fewer tons of carbon annually, comparable to the annual carbon emissions of the United Kingdom. The model provides a framework in which to consider the relationship between climate and ocean carbon export that might also elucidate large-scale (e.g., glacial-interglacial) atmospheric CO2 changes of the past.

Authors:
B. B. Cael (MIT/WHOI)
Kelsey Bisson (UCSB)
Mick Follows (MIT)

Next Page »

FilterbyKeyword

abundance acidification additionality advection africa air-sea air-sea interactions albedo algae alkalinity allometry amendments ammonium AMO AMOC anoxic Antarctic Antarctica anthro impacts anthropogenic carbon anthropogenic impacts appendicularia aquaculture aquatic continuum aragonite saturation arctic Argo argon arsenic artificial seawater assumptions AT Atlantic atmospheric CO2 atmospheric nitrogen deposition authigenic carbonates autonomous platforms AUVs awb bacteria bathypelagic BATS BCG Argo benthic bgc argo bias bio-go-ship bio-optical bioavailability biogeochemical biogeochemical cycles biogeochemical models biogeochemistry Biological Essential Ocean Variables biological pump biomass biophysics bloom blue carbon bottom water boundary layer buffer capacity C14 CaCO3 calcification calcite carbon carbon-climate feedback carbon-sulfur coupling carbon 14 carbonate carbonate chemistry carbonate chemistry OAE carbonate system carbon budget carbon cycle carbon cycling carbon dioxide carbon export carbon fluxes carbon removal carbon sequestration carbon storage Caribbean CCA CCS changing marine chemistry changing marine ecosystems changing marine environments changing ocean chemistry chemical oceanographic data chemical speciation chemoautotroph chesapeake bay chl a chlorophyll circulation climate clouds CO2 CO3 coastal and estuarine coastal darkening coastal ocean cobalt Coccolithophores commercial community community composition competition conservation cooling effect copepod copepods coral reefs cruise CTD currents cyclone daily cycles data data access data assimilation database data management data product data sets Data standards DCM dead zone decadal trends decomposers decomposition deep convection deep ocean deep sea coral deep water deepwater horizon denitrification dense water deoxygenation depth diatoms DIC diel migration diffusion dimethylsulfide dinoflagellate dinoflagellates discrete measurements disequilibrium distribution DOC DOM domoic acid DOP dust DVM earth system ecological feedbacks ecology economics ecosystem management ecosystems eddy Education EEZ Ekman transport emissions ENSO enzyme equatorial current equatorial regions ESM estuarine and coastal carbon fluxes estuary euphotic zone eutrophication evolution export export fluxes export production extreme events faecal pellets fecal pellets filter feeders filtration rates fire fish Fish carbon fisheries fishing float floats fluid dynamics fluorescence food webs forage fish forams framework freshening freshwater frontal zone fronts functional role future oceans gelatinous zooplankton gene transfer geochemistry geoengineering geologic time GEOTRACES glaciers gliders global carbon budget global oceam global ocean global ocean models global overturning circulation global warming go-ship gradient grazing greenhouse gas greenhouse gases Greenland ground truthing groundwater Gulf of Maine Gulf of Mexico Gulf Stream gyre harmful algal bloom heat waves high latitude human food human impact human well-being hurricane hydrogen hydrothermal hypoxia ice age iceberg ice cores ice cover industrial onset inland waters in situ inverse circulation ions iron iron fertilization iron limitation isotopes jellies katabatic winds kelvin waves krill kuroshio lab vs field lagoon land land-ocean continuum larvaceans lateral transport LGM lidar ligands light light attenuation lineage lipids low nutrient machine learning mangroves marine carbon cycle marine heatwave marine particles marine snow marine snowfall marshes mCDR mechanisms Mediterranean meltwater mesocosm mesopelagic mesoscale mesoscale processes metagenome metals methane methods microbes microlayer microorganisms microplankton microplastics microscale microzooplankton midwater migration minerals mitigation mixed layer mixed layers mixing mixotrophs mixotrophy model modeling modeling atmosphere model validation mode water molecular diffusion MPT MRV multi-decade N2 n2o NAAMES NCP nearshore net community production net primary productivity new ocean state new technology Niskin bottle nitrate nitrogen nitrogen cycle nitrogen fixation nitrous oxide north atlantic north pacific North Sea NPP nuclear war nutricline nutrient budget nutrient cycles nutrient cycling nutrient limitation nutrients OA observations ocean-atmosphere ocean acidification ocean acidification data ocean alkalinity enhancement ocean carbon uptake & storage ocean carbon uptake and storage ocean color ocean interior ocean modeling ocean observatories ocean warming ODZ oil oligotrophic omics OMZ open ocean optics organic carbon organic particles oscillation outwelling overturning circulation oxidizing oxygen oxygen-deficient pacific paleoceanography PAR parameter optimization parasite particle flux particles partnerships pCO2 PDO peat pelagic perturbation PETM pH phenology phosphate phosphorus photosynthesis physical processes physiology phytoplankton PIC piezophilic piezotolerant plankton POC polar polar regions policy pollutants precipitation predation predator-prey predators prediction pressure primary productivity Prochlorococcus productivity prokaryotes proteins pteropods pycnocline python radioisotopes redox remineralization remote sensing repeat hydrography residence time resource management respiration resuspension rivers rocky shore Rossby waves Ross Sea ROV salinity salt marsh satellite scale seafloor seagrass sea ice sea level rise seasonal seasonal effects seasonality seasonal patterns seasonal trends sea spray sea surface seawater collection seaweed secchi sediments sensor sensors sequestration shelf ocean shelf system shells ship-based obs ship-based observations shorelines siderophore silica silicate silicon cycle sink sinking sinking particles size SOCCOM soil carbon solubility pump southern ocean south pacific spatial covariations speciation spring mixing SST state estimation stoichiometry stratification subduction submesoscale subpolar subtropical sulfate surf surface surface ocean surface water surface waters Synechococcus technology teleconnections temperate temperature temporal covariations thermocline thermodynamics thermohaline thorium tidal time time-series time of emergence titration top predators total alkalinity trace elements trace metals trait-based transfer efficiency transient features trawling Tris trophic interactions trophic transfer tropical turbulence twilight zone upper ocean upper water column upwelling US CLIVAR validation velocity gradient ventilation vertical flux vertical migration vertical transport viruses warming water clarity water column water mass water quality waves weathering western boundary currents wetlands winter mixing zooplankton

Copyright © 2026 - OCB Project Office, Woods Hole Oceanographic Institution, 266 Woods Hole Rd, MS #25, Woods Hole, MA 02543 USA Phone: 508-289-2838  •  Fax: 508-457-2193  •  Email: ocb_news@us-ocb.org

link to nsflink to noaalink to WHOI

Funding for the Ocean Carbon & Biogeochemistry Project Office is provided by the National Science Foundation (NSF) and the National Aeronautics and Space Administration (NASA). The OCB Project Office is housed at the Woods Hole Oceanographic Institution.