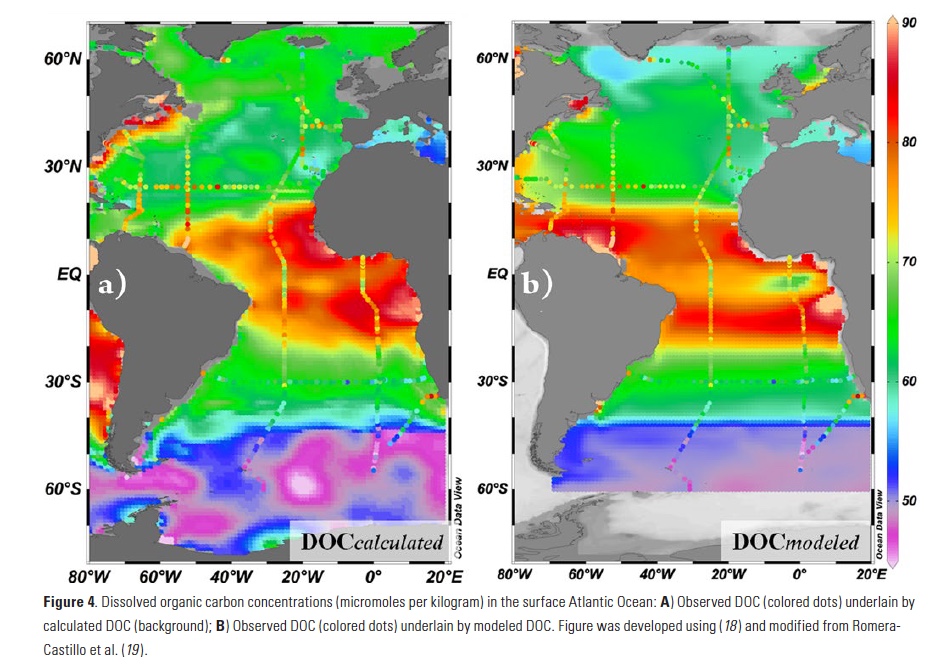
Biology in the Southern Ocean is known to help regulate Earth’s climate by capturing and eventually sequestering carbon from its surface. Unfortunately, accurate estimates of the magnitude of the Southern Ocean (SO) biological carbon sink are limited and subject to ongoing debate. However, a recently published study used the expanding Southern Ocean BGC-Argo fleet to provide new estimates of SO Annual Net Community Production (ANCP) and export production.
Over long enough time and space scales (>1000 km and seasons), ANCP is equal to the amount of carbon fixed during photosynthesis that is not remineralized in the surface layer. What remains is available to be exported to depth. As this organic matter sinks out of the surface ocean, most of it is eventually remineralized by bacteria, leaving behind a signature of depleted oxygen. With enough floats, basin-scale ANCP can be estimated from the seasonal oxygen drawdown measured across their profiles. While similar studies have been carried out on single floats, here, the authors construct a composite of all available profiles and include a greater depth range than previously considered.
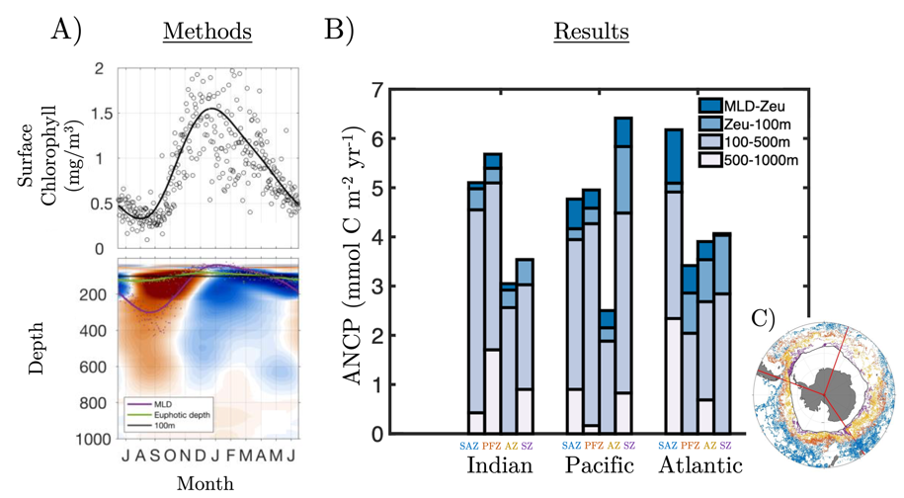
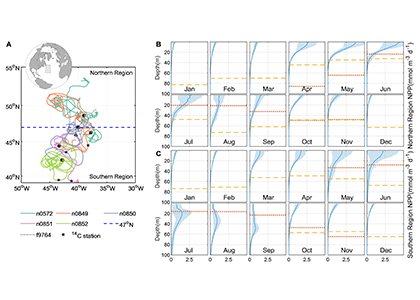
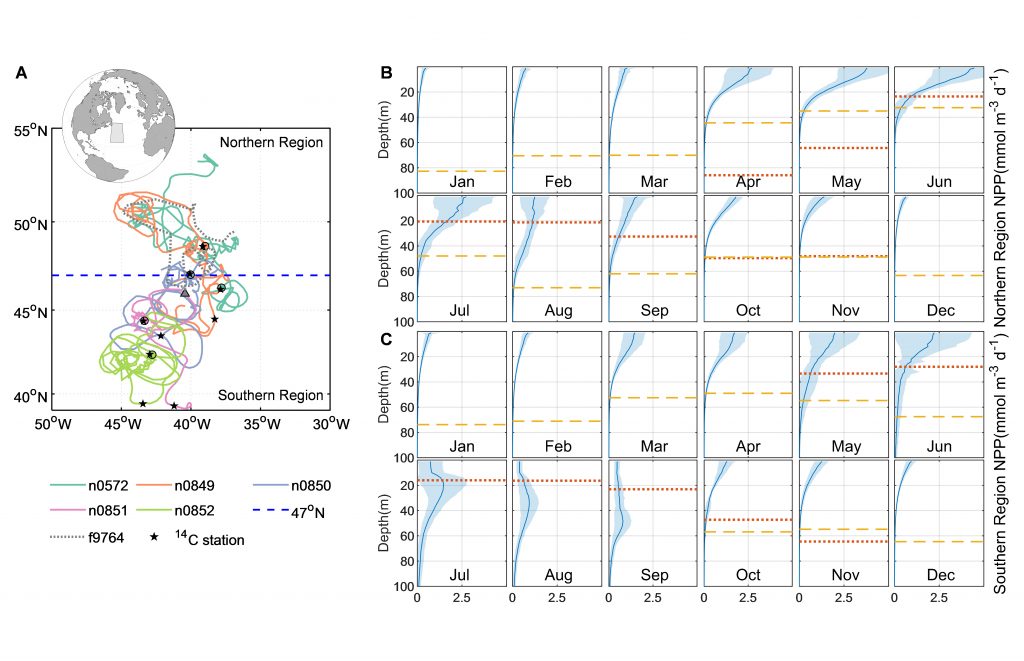
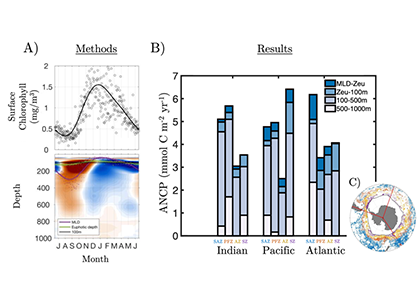
Figure 1. All available BGC-ARGO float profiles (25,512) were used to create an A) ensemble seasonal cycle in surface chlorophyll and sub-surface oxygen. B) Annual Net Community Production (ANCP) was then estimated by computing the depth-integrated oxygen depletion during the productive period. C) ANCP was estimated across 12 major regions, separated by the Indian, Pacific and Atlantic basins and Subantarctic (SAZ), Polar (PFZ), Antarctic (AZ), and Southern (S) frontal zones. Each region used 100s-1000s of individual float profiles (color-coded scatter points).
Results from this novel approach estimate SO ANCP (and ~export) at 3.89 GT C year-1, with basin-scale regional estimates as much as a factor 2.8 larger than previous studies. Moreover, nearly 30% of remineralization was measured at depths not typically considered, with 14% below 500 m and another 15% immediately below the euphotic depth but above 100 m. These values suggest a more critical role for the Southern Ocean in regulating oceanic carbon storage, atmospheric CO2 exchange, and climate than previously thought.
Authors:
Jiaoyang Su (University of Tasmania, Australia)
Christina Schallenberg (University of Tasmania, and Australian Antarctic Program Partnership)
Tyler Rohr (Australian Antarctic Program Partnership)
Peter G. Strutton (University of Tasmania, Australia)
Helen E. Phillips (University of Tasmania, and Australian Antarctic Program Partnership)