The ocean stores vast amounts of heat and carbon under anthropogenic CO₂ emissions, but its behavior under net-negative emission scenarios remains poorly understood. Here we use an Earth System Model of intermediate complexity and show results of an idealized future climate scenario that includes sustained net-negative emissions over centuries. After gradual global cooling, the model produces an abrupt “heat burp,” in which heat previously stored in the deep Southern Ocean resurfaces through deep convection, temporarily reversing the cooling and causing renewed warming. The release of heat is not accompanied by a comparable release of CO₂. The heat burp represents a breakdown of the assumed linear relationship between cumulative CO₂ emissions and warming, a metric that is used to calculate the remaining carbon budget. We call for assessing the robustness of how models forced with net-negative CO₂ emissions simulate durability of ocean storage of heat and CO₂, and pathways and time scales of loss to the atmosphere.
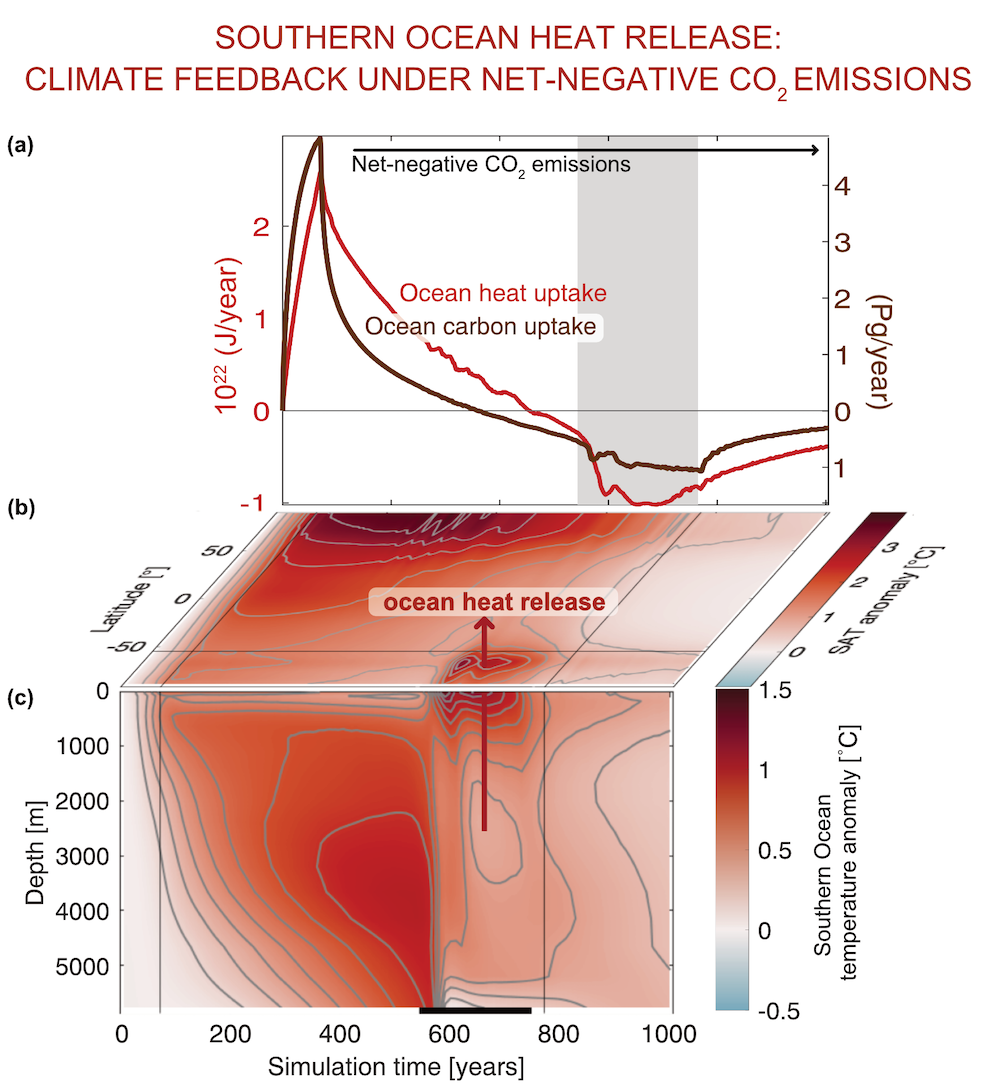
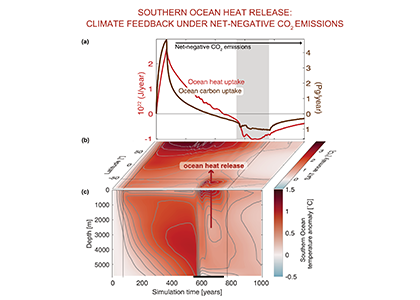
Fig caption: The temporal evolution of (a) global heat and carbon uptake and release; (b) surface air temperature (SAT) anomaly relative to preindustrial conditions; (c) Southern Ocean temperature anomaly relative to preindustrial conditions; gray shading/black bar indicate the period of comparatively abrupt ocean heat release that warms SAT, representing a climate feedback.
Authors
(all at GEOMAR)
Ivy Frenger
Svenja Frey (and Univ Copenhagen)
Andreas Oschlies
Julia Getzlaff
Torge Martin
Wolfgang Koeve
Frenger, I., Frey, S., Oschlies, A., Getzlaff, J., Martin, T., & Koeve, W. (2025). Southern Ocean heat burp in a cooling world. AGU Advances, 6, e2025AV001700. https://doi.org/10.1029/2025AV001700