The Southern Ocean is one of the most important regions for absorbing anthropogenic CO₂, and it is one of the most challenging places to observe, until Biogeochemical (BGC) Argo floats began to monitor this remote region year-round. Yet, CO₂ uptake estimates based on float data have suggested a much weaker uptake Southern Ocean than estimates from ships and aircraft observations. This strongly challenges the conventional view of Southern Ocean carbon sink and raises questions about the float pH data. Could this disagreement come from a bias in the pH measurements used to calculate float-derived pCO₂?
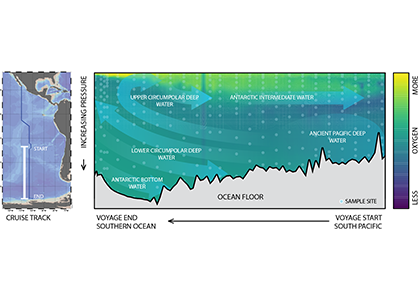
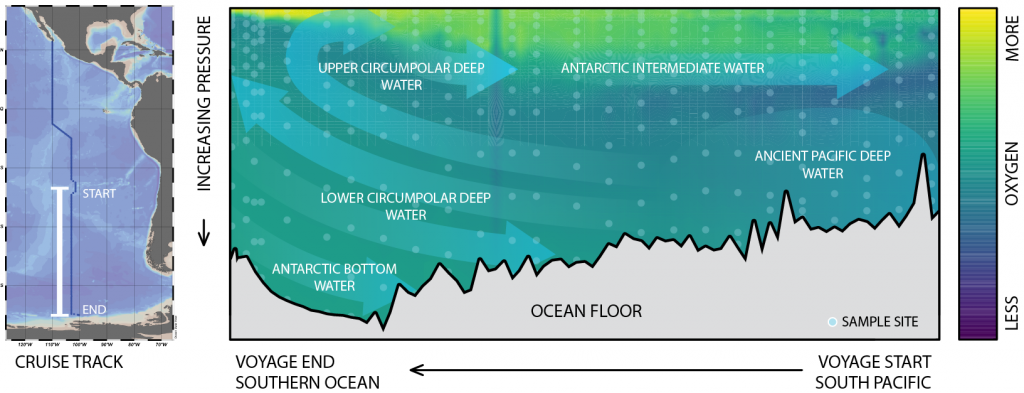
A study published in Scientific Reports, tested this by comparing BGC Argo float data with high-quality ship-based observations across the Southern Ocean. Rather than focusing only on the surface or on a small number of float-ship crossover points, we carried out a basin-scale, multi-variable, whole-profile comparison using GLODAP as a reference, and then checked the surface signal independently with OceanSODA.
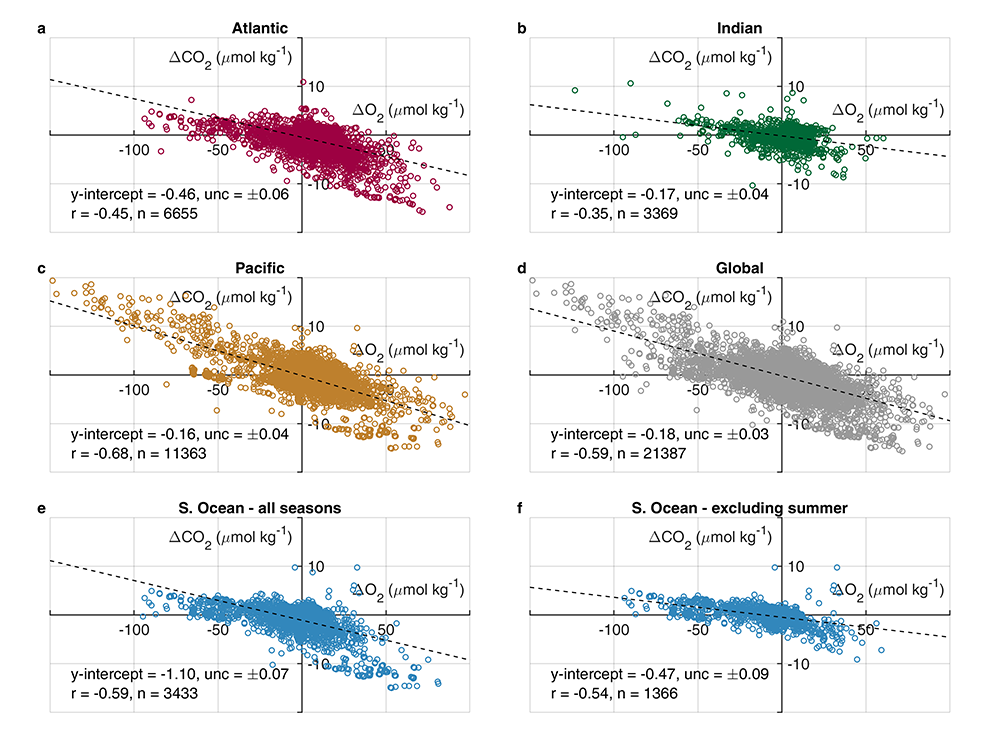
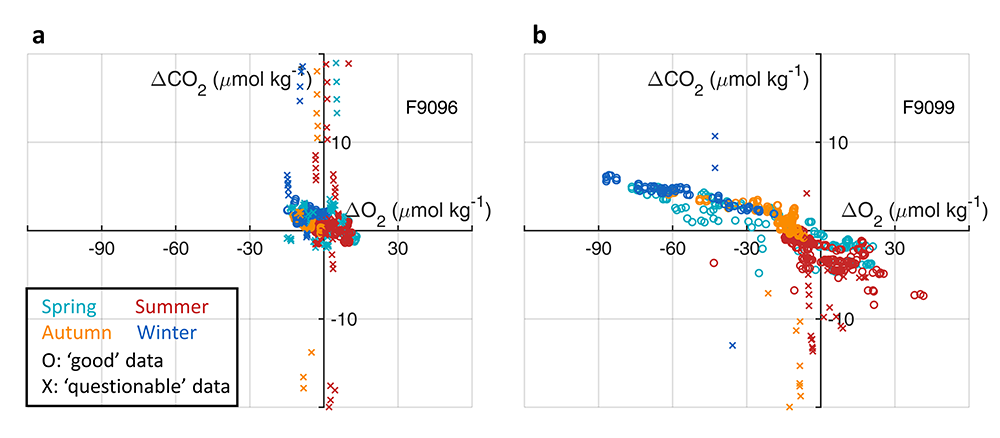
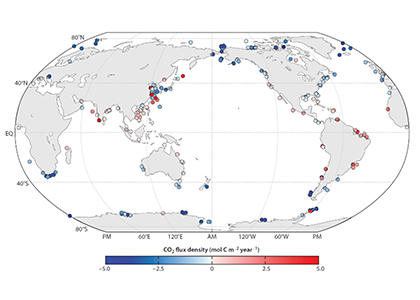
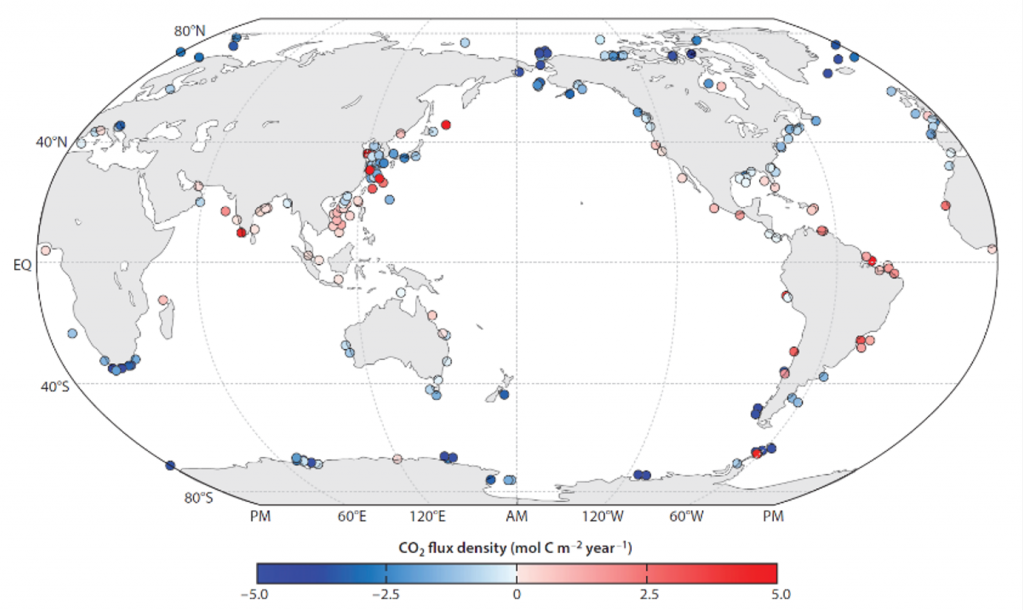
First, we focused on old subsurface waters with minimal anthropogenic carbon, where ship and float data collected at different times are comparable. Float temperature, salinity, nitrate, oxygen, and algorithm-estimated total alkalinity (TA) were consistent with ship data. pH from floats, in contrast, was systematically lower (by ~ 0.021 units), leading to higher derived pCO₂ (by ~ 20 µatm) and dissolved inorganic carbon (DIC). At the surface, two independent approaches suggest that float-derived pCO₂ is biased high by 15 ± 3 µatm on average. This bias is larger than previously recognized and is large enough to help explain why float-based estimates have made Southern Ocean CO₂ uptake appear weaker than estimates from other observing platforms.
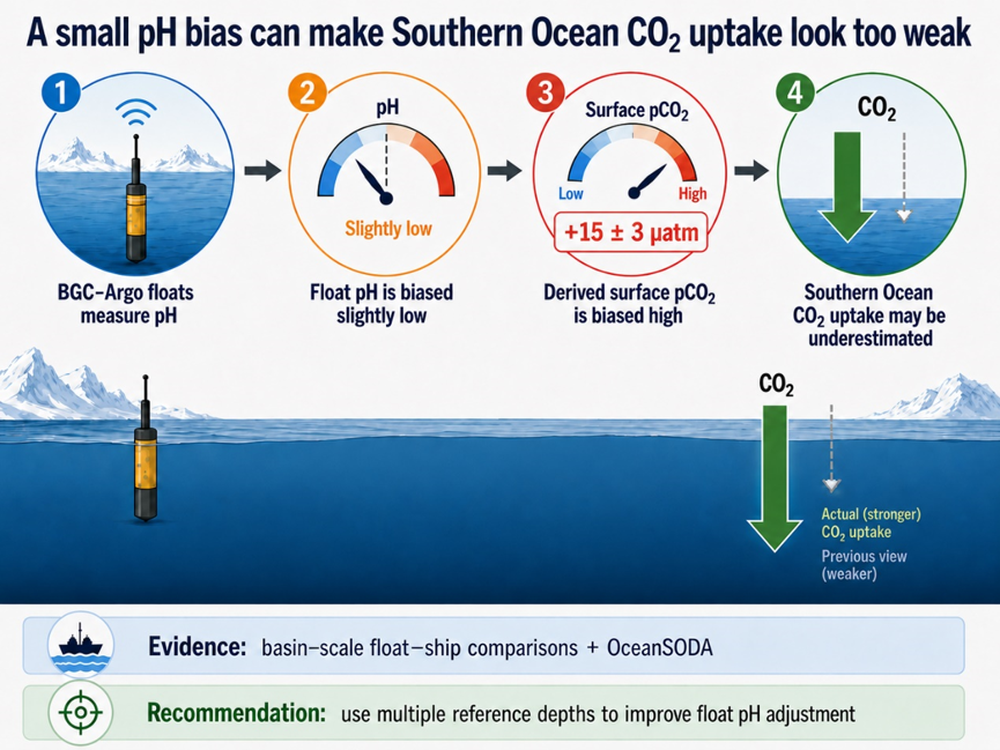
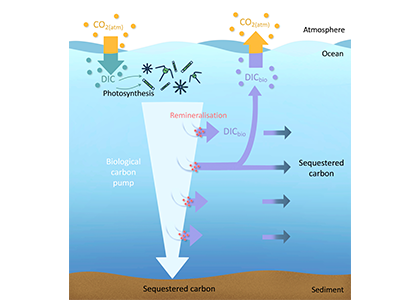
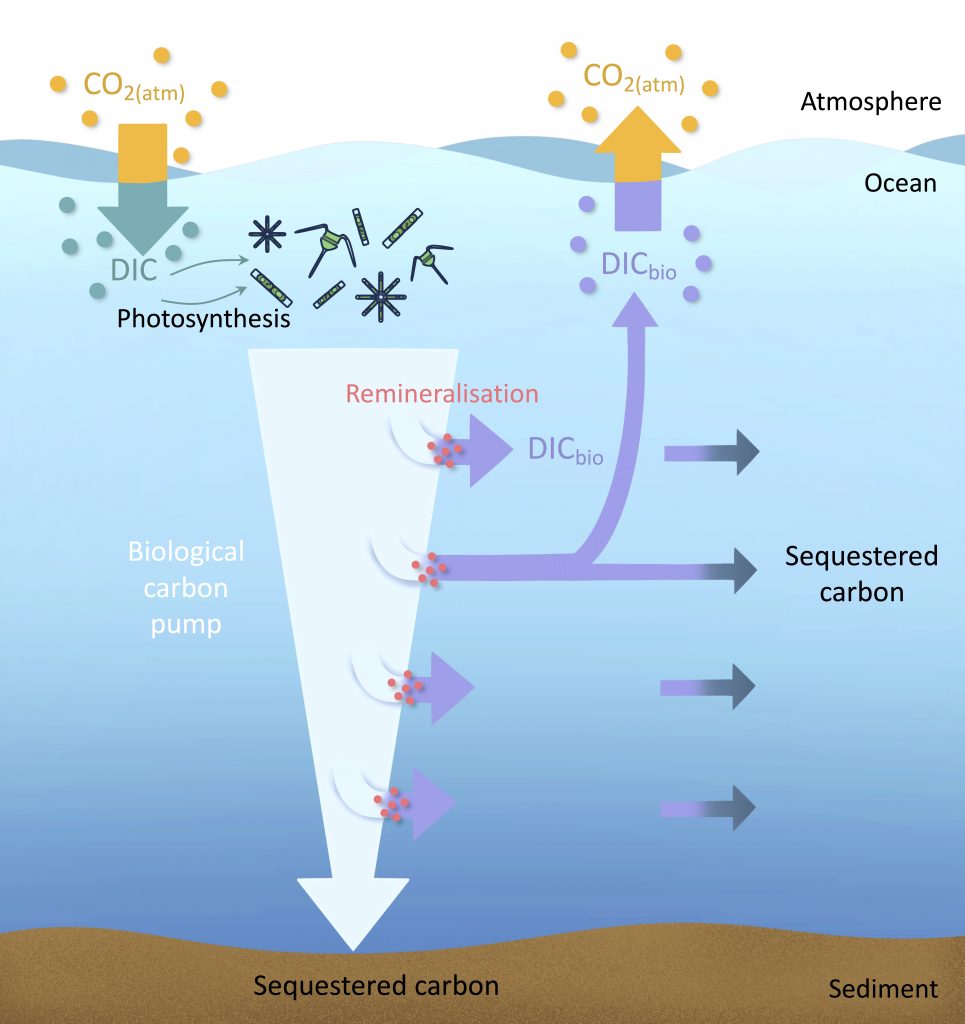
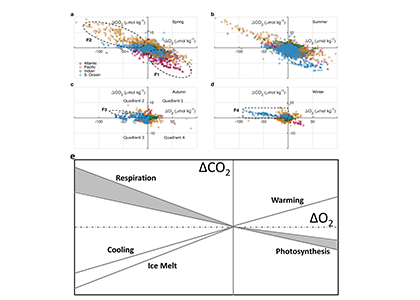
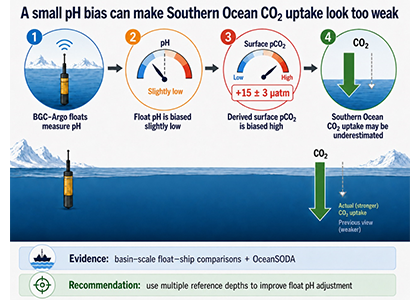
Figure caption: Conceptual summary of how a small negative bias in float pH can propagate into a positive bias in derived surface pCO₂. In this study, basin-scale float–ship comparisons and surface checks against OceanSODA suggest that float-derived Southern Ocean surface pCO₂ is biased high by 15 ± 3 µatm, which would make CO₂ uptake by the Southern Ocean appear weaker than it actually is.
These findings do not diminish the value of BGC Argo float data. Instead, they show how essential careful calibration is when autonomous observations are used to quantify air-sea CO₂ exchange. We suggest that future float pH adjustment should use multiple reference depths, rather than rely on a single deep reference point. Combining improved float calibration with continued ship-based measurements will significantly strengthen our ability to quantify the Southern Ocean carbon sink and its role in the global carbon cycle.
Authors:
Chuqing Zhang (University of Southampton; National Oceanography Centre Southampton)
Yingxu Wu (Polar and Marine Research Institute, Jimei University)
Peter J. Brown (National Oceanography Centre)
David Stappard (University of Southampton; National Oceanography Centre Southampton)
Amavi N. Silva (University of Southampton; National Oceanography Centre Southampton; GEOMAR Helmholtz Centre for Ocean Research Kiel)
Toby Tyrrell (University of Southampton; National Oceanography Centre Southampton)
Citation: Zhang, C., Wu, Y., Brown, P.J. et al. A systematic bias in float pH leads to overestimation of derived pCO2 and underestimation of carbon uptake by the Southern Ocean. Sci Rep 16, 13929 (2026). https://doi.org/10.1038/s41598-026-43863-4