
Around 662 billion tons of organic carbon are dissolved in the ocean, making the pool one of Earth’s major, exchangeable carbon reservoirs. Dissolved organic carbon (DOC) has many ecological functions. It can form complexes with metals (1); absorb UV and visible light, acting as a “sunscreen” for marine microorganisms and controlling primary production in the upper water column (2); it has antioxidant activity, reacting with free radicals in the media (3); but most importantly, it serves as substrate for the microbial loop and as a vehicle for carbon sequestration in the ocean. Therefore, DOC plays an important role in climate on geological time scales.
Because the amount of atmospheric CO2 is of the same magnitude as the DOC pool, and is closely linked to it through exchange, variations in one of these reservoirs can affect the other, impacting the carbon cycle with consequences for climate. Significant net DOC remineralization would lead to an increase of atmospheric CO2, enhancing greenhouse warming at the surface of the Earth. Net oxidation of only 1% of the seawater DOC pool within 1 year would be sufficient to generate a CO2 flux of 7 PgC/yr, comparable to that produced annually by fossil fuel combustion (4). It has also been proposed that a large-scale oxidation of DOC may have prevented a dramatic global glaciation (‘snowball earth’) in the Neoproterozoic period (5).
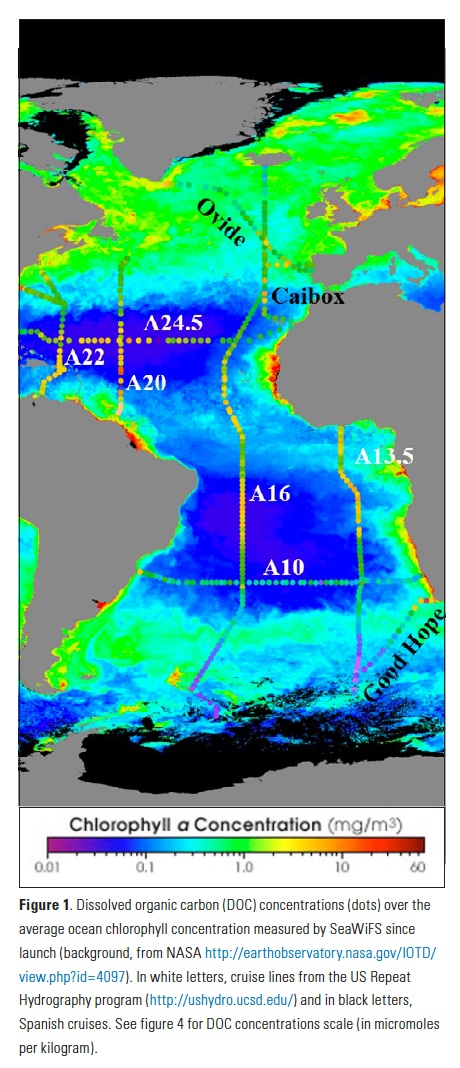
Despite its importance, knowledge about DOC dynamics is relatively limited; in fact, it was considered highly inert until about three decades ago when a new analytical technique for measuring it via high-temperature catalytic oxidation stimulated new interest (6). The technique eventually provided more accurate DOC values, showing that it was more involved in the carbon cycle than previously thought and that its concentrations vary with depth, time, and location. Considering DOC distributions observed in the surface Atlantic Ocean (Fig. 1), we see values in the subtropical gyres of 65-70 µmol Kg-1, the highest concentrations in the tropics (> 70 µmol Kg-1), the lowest in the Southern Ocean (< 50 µmol Kg-1), and moderate concentrations in the northern North Atlantic (55-60 µmol Kg-1); this pattern is consistent in other ocean basins. So what controls this distribution and can we predict it? Even with improved analytical techniques, DOC is not a variable that can be measured easily at sea, and the sampling must be done carefully since it is easy to contaminate. Therefore, DOC data are typically fewer than those of other more readily determined variables such as nutrients and oxygen. If we could predict DOC from variables for which much greater global ocean coverage exists, we could fill the very large spatial and temporal gaps in the DOC fields.
DOC is produced in the upper water column by phytoplankton (primary producers). Actually, half of the inorganic carbon that is fixed by phytoplankton is transformed to DOC. Heterotrophic microbes consume most of that DOC, but ~ 4% of global annual net primary production (~ 2 Pg C y-1) (7) accumulates as DOC, much of which is exported to the mesopelagic via vertical mixing and convergence, thus contributing to the biological carbon pump.
 New primary production, the foundation of a system’s net community production (NCP), depends on new nutrients reaching the euphotic zone, which happens primarily via upwelling in divergence zones and winter vertical mixing. NCP is the balance of the carbon generated by primary producers minus that lost through heterotrophic respiration (prokaryotes and animals). It can be estimated either by a loss of reactants (CO2 or nutrients) or a gain in products (suspended POC, DOC, and export production) (8).
In our work, we needed to establish the fraction of NCP that was present in dissolved form (i.e., the net DOC production ratio, or NDPr). For that, we simply estimated NCP from the nitrate (NO3–) that is consumed in the euphotic zone (DNO3–):
ΔNO3– = new NO3– (introduced from deeper layers) – remaining NO3– (at surface) (Eq. 1)
In the same way, we also calculated net accumulated DOC, or ΔDOC:
ΔDOC = DOC in euphotic zone – DOC introduced from deeper layers (Eq. 2)
The ratio between ΔDOC and ΔNO3– gave us the NDPr:
NDPr = ΔDOC/ΔNO3– (Eq. 3)
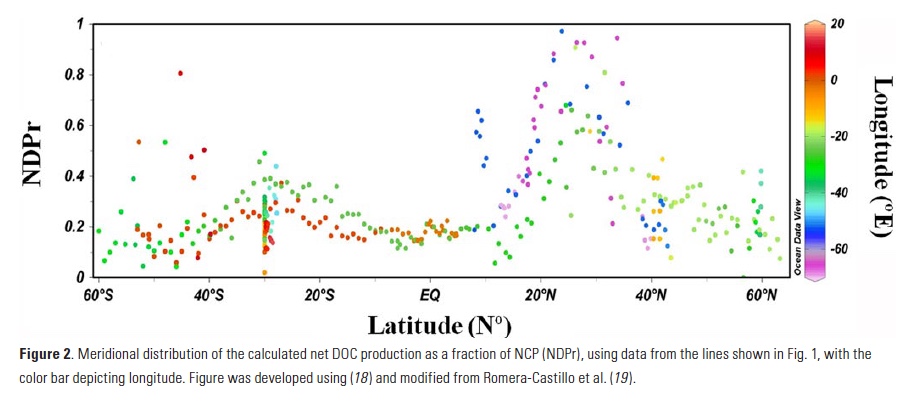
NDPr was calculated throughout the Atlantic Ocean using observations of DOC and NO3– from >15 international oceanographic cruises over the last decade, including those occupied by the US Repeat Hydrography program (Fig. 1). Values of NDPr mostly varied between 0.1 and 0.4 (Fig. 2), with the exception of the North Atlantic Subtropical Gyre (NASG), where NDPr values reach >0.8 at times. After sensitivity testing, we applied a NDPr value of 0.17 to the entire basin, which yielded the smallest error between calculated and observed DOC concentrations. Applying this NDPr value to ΔNO3– (i.e. NCP) obtained from cruise data, we estimate ΔDOC (Eq. 4), in which 6.6 is the molar conversion from N to C units:
ΔDOC= ΔNO3– * 6.6 * 0.17 = NCP * 0.17 (Eq. 4)
To obtain the calculated DOC concentration (DOCcalculated), we added the DOC concentration of underlying source waters (DOCsource) to ΔDOC (Eq. 5):
DOCcalculated = DOCsource + ΔDOC (Eq. 5)
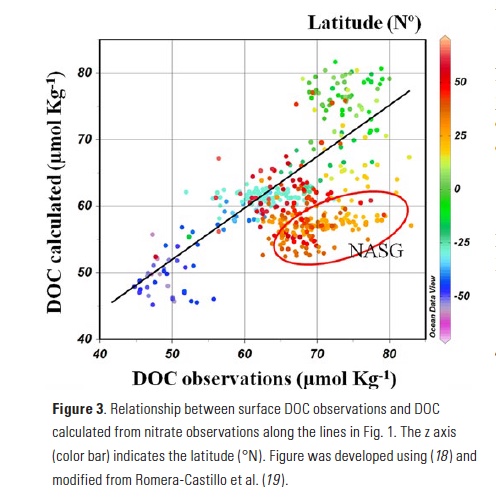
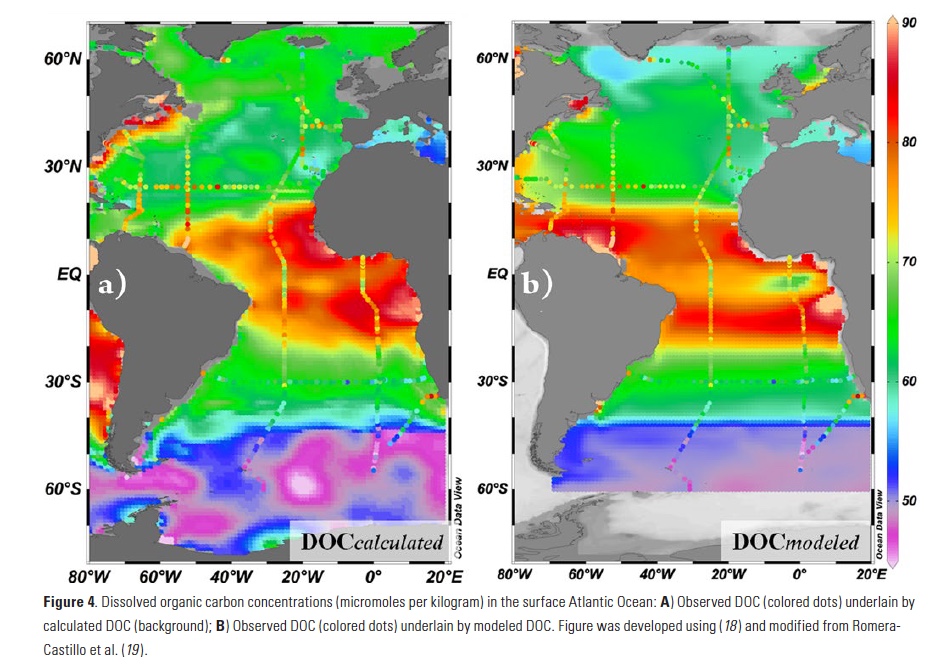
When comparing calculated vs. observed DOC (Fig. 3), we found significant agreement (R2 = 0.64; p < 0.001; n=268) throughout the Atlantic, except in the western North Atlantic, where observed DOC > estimated DOC, especially in the southern sector. After this validation of our approach using nutrients and DOC observations, we applied the method to the more extensive NO3– distributions available in the World Atlas Ocean (WOA) climatology to develop a DOCcalculated map for the entire Atlantic (Fig. 4a). The calculated values agree well with the observations, with a total error of 8.94%.
How much DOC is annually produced in the surface Atlantic Ocean? Total organic carbon export (considered equivalent to NCP) in the Atlantic has been estimated to be 4.15-4.3 Pg C y-1 (9, 10). Applying the 0.17 NDPr (equation 3) indicates that 0.70-0.75 Pg C y-1 accumulates in the Atlantic surface as DOC; as such, the Atlantic accounts for ~36% of the global net DOC production ~2 Pg C y-1.
In permanently stratified areas like the southern sectors of the NASG, our approach is invalid since there is little nutrient input from underlying depths. Also, the static view of our approach does not take into account advection that will modify the DOC distributions, nor does it account for eventual removal of accumulated and advected DOC by microbes. To account for these influences on distributions, we applied the ΔNO3– measurements to a steady-state ocean circulation model including terrestrial DOC inputs and DOC remineralization (Fig. 4b). In the model, zonal advection is evident through enrichment of DOC in the Caribbean Sea. Also, inputs of terrestrial DOC are observed near the outflow of the Amazon River. However, the model only slightly improved the match between observations and modeled DOC, with a total error of 8.71% vs. the 8.94% obtained before the model application.
 The correspondence between observations and modeled values was good, considering that we are comparing observations of DOC from cruises during specific seasons with estimates based on more idealized nutrient climatology. The main mismatch is found in the western NASG, where observations can reach 13 µmol Kg-1 higher than calculated values. Local production and/or allochthonous inputs of either new nutrients or DOC must be considered. Local production of DOC could result from addition of nitrogen from sources beyond vertical mixing such as diazotrophic N2 fixation, atmospheric deposition, and river runoff. Alternatively, DOC can be concentrated by evaporation, as is sea salt. However, none of these explain the high DOC values observed in the NASG. DOC flux estimated from dissolved organic nitrogen (DON) released by N2 fixation (11) is too low to explain the extra DOC. Regarding the atmospheric deposition, aerosol optical depth data suggest higher deposition in the eastern than in the western North Atlantic (11), and no excess of DOC is observed there. According to salinity distributions from the World Ocean Atlas, advection of DOC from the closest major rivers (Amazon and Orinoco) does not extend far enough northward to explain the NASG anomaly. Salinity normalization of DOC does not erase the feature, indicating that evaporation is not the cause. Those elevated values of carbon are found during cruises from 2003 in the same area (12), so it appears to be a persistent feature. The anomaly also coincides with a DON maximum and a light stable isotope (δ15N) composition in the particulate organic carbon based on measurements recorded in 2004 (13). An explanation for these anomalies has not been confirmed.
Conclusions
New nutrients are the fundamental driver of net DOC accumulation in the surface Atlantic Ocean. As such, climate-driven changes in ocean dynamics, which will affect the supply of nutrients to the euphotic zone, will affect the DOC inventory. The effects of climate change on the nutrient supply to the upper water column are not well known, but they will depend on the opposing influences of thermal stratification and upwelling intensification. Some authors predict an intensification and spatial homogenization of coastal upwelling systems (14, 15). Such would increase the nutrient input to the euphotic zone and the net DOC production. In contrast, others have reported that ocean warming should intensify thermal stratification, reducing nutrient flux by vertical mixing in regions not affected by coastal upwelling systems (16, 17). Depending on which of these phenomena dominate, the nutrient supply will change, in turn changing the DOC budget and its distribution. Furthermore, the percentage of NCP accumulating as DOC (i.e. NDPr), found here to be ~17%, could change in response to a shift in the balance of autotrophs and heterotrophs. This multitude of influencing factors will undoubtedly impact the future course of the oceanic DOC budget.
Authors
Cristina Romera-Castillo (Univ. of Vienna) and Dennis A. Hansell (RSMAS, Univ. Miami)
Acknowledgments
The authors thank the other co-author, Robert T. Letscher, from the more extended version of this published work. Also to Dr. X.A. Álvarez-Salgado for the use of DOC data he collected during cruises supported by the Spanish government. Data collection on US CLIVAR sections and involvement by C.R.-C. and D.A.H. were supported by US National Science Foundation OCE1436748.
References
- Midorikawa, T., E. Tanoue, 1998. Mar. Chem. 62, 219-239.
- Arrigo, K. R., C. W., Brown, 1996. Mar. Ecol. Prog. Ser. 140, 207-216.
- Romera-Castillo, C., R. Jaffé, 2015. Mar. Chem. 177, 668–676.
- Hedges, J. I. 2002. In: Hansell, D., Carlson, C. (Eds.), 2002. Biogeochemistry of marine dissolved organic matter. Academic Press, San Diego, pp. 1-33.
- Peltier, W. R. et al., 2007. Nature 450, 813-819.
- Hansell, D. A., C. A. Carlson, 2015. Eos, 96, doi:10.1029/2015EO033011.
- Hansell, D. A., et al., 2009. Oceanography 22, 202-211.
- Hansell, D. A., C. A. Carlson, 1998. Global Biogeochem. Cycles 12, 443-453.
- Laws, E. A., et al., 2000. Global Biogeochem. Cycles 14, 1231-1246.
- Dunne, J. P., et al., 2007. Global Biogeochem. Cycles 21, GB4006.
- Benavides, M., et al., 2013. J. Geophys. Res.: Oceans 118, 3406-3415.
- Carlson, C. A. et al., 2010. Deep-Sea Res. Pt II 57, 1433-1445.
- Landolfi, A. et al., 2016. Deep-Sea Res. Part I 111, 50-60.
- Sydeman, W. J. et al., 2014. Science 345, 77-80.
- Wang, D. et al., 2015. Nature 518, 390-394.
- Cermeño, P. et al., 2008. PNAS 105, 20344-20349.
- Bopp L, et al., 2013. Biogeosciences 10, 6225-6245.
- Schlitzer, R., 2015. Ocean Data View. Available at https://odv.awi.de
- Romera-Castillo, C. et al., 2016. PNAS 113, 10497–10502.

