The Mediterranean Sea is a semi-enclosed mid-latitude oligotrophic basin with a lower net primary production than the global ocean. A west-east productivity trophic gradient results from the superposition of biogeochemical and physical processes, including the biological pump and associated carbon and nutrient (nitrogen, phosphorus) fluxes, the spatial asymmetric distribution of nutrient sources (rivers, atmospheric deposition, coastal upwelling, etc.), the estuarine inverse circulation associated with the inflow of Atlantic water through the Gibraltar Strait. The complex and highly variable interface between land and sea throughout this basin add a further layer of complexity in the Mediterranean oceanic and atmospheric circulation and on the associated biogeochemistry dynamics, emphasizing the need for high-resolution truly integrated Regional Earth System Models to track and understand fine-scale processes and ecosystem dynamics.
In a recent paper published in the Journal of Advances in Modeling Earth System, the authors introduced a new version of the Regional Earth System model RegCM-ES and evaluated its performance in the Mediterranean region. RegCM-ES fully integrates the regional climate model RegCM4, the land surface scheme CLM4.5 (Community Land Model), the river routing model HD (Hydrological Discharge Model), the ocean model MITgcm (MIT General Circulation model) and the Biogeochemical Flux Model BFM.
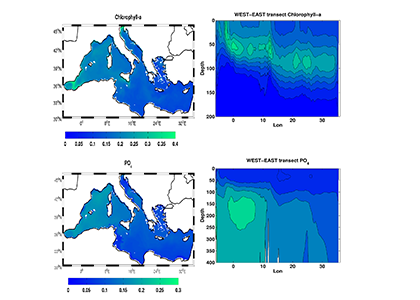
A comparison with available observations has shown that RegCM-ES was able to capture the mean climate of the region and to reproduce horizontal and vertical patterns of chlorophyll-a and PO4 (the limiting nutrient in the basin) (Figure 1). The same comparison revealed a systematic underestimation of simulated dissolved oxygen (which will be fixed by the use of a new parametrization of oxygen solubility), and an overestimation of NO3, possibly due to uncertainties in initial and boundary conditions (mostly traced to river and Dardanelles nutrient discharges) and an overly vigorous vertical mixing simulated by the ocean model in some parts of the Basin.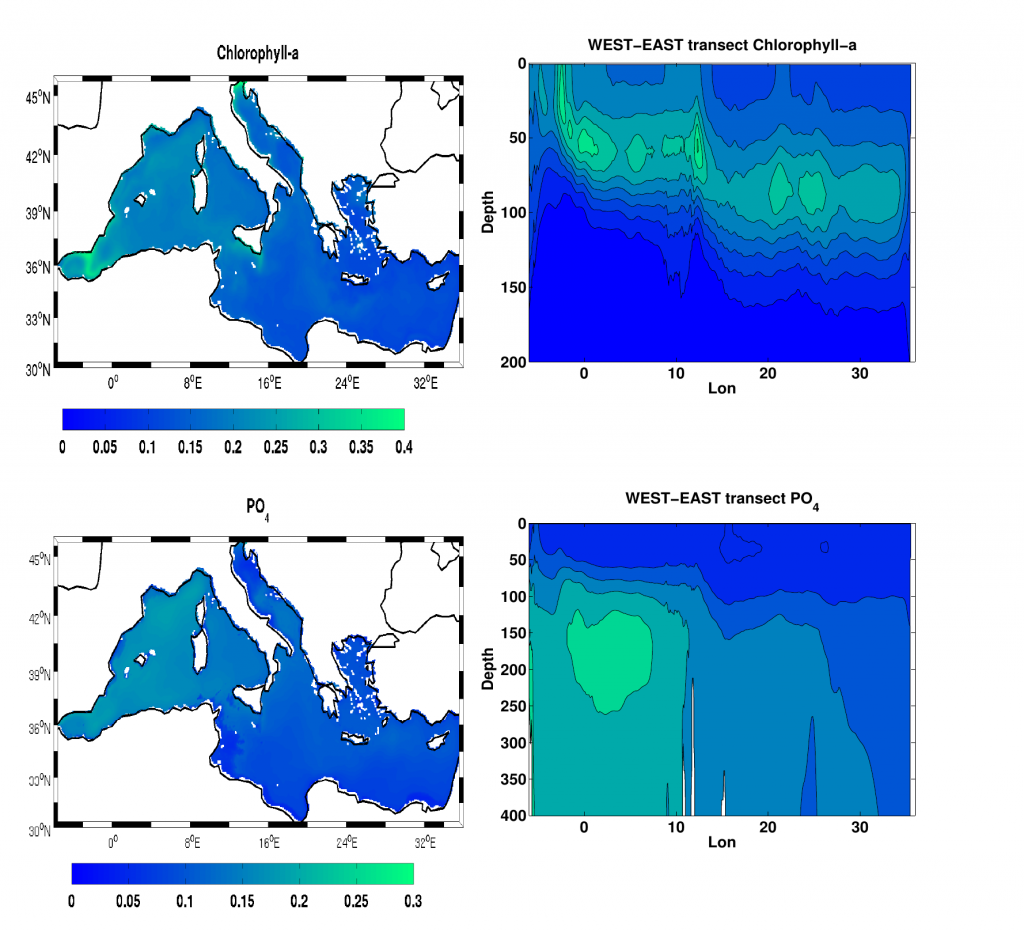
Figure.1 Distributions of chlorophyll-a mg/m3 (top) and PO4 mmol/m3 (bottom) in the Mediterranean Sea as simulated by RegCM-ES.
Overall, this analysis has demonstrated that RegCM-ES has the capabilities required to become a powerful tool for studying regional dynamics and impacts of climate change on the Mediterranean Sea and other ocean basins around the world.
Authors:
Marco Reale (Abdus Salam International Centre for theoretical physics-ICTP, National Institute of Oceanography and Experimental Geophysics-OGS)
Filippo Giorgi (Abdus Salam International Centre for theoretical physics-ICTP)
Cosimo Solidoro (National Institute of Oceanography and Experimental Geophysics-OGS)
Valeria Di Biagio (National Institute of Oceanography and Experimental Geophysics-OGS)
Fabio Di Sante (Abdus Salam International Centre for theoretical physics-ICTP)
Laura Mariotti (National Institute of Oceanography and Experimental Geophysics-OGS)
Riccardo Farneti (Abdus Salam International Centre for theoretical physics-ICTP)
Gianmaria Sannino (Italian National Agency for New Technologies, Energy and Sustainable Economic Development-ENEA)