Ocean Carbon & Biogeochemistry
Studying marine ecosystems and biogeochemical cycles in the face of environmental change
  • Home
  • About OCB
    • About Us
    • Scientific Breadth
      • Biological Pump
      • Changing Marine Ecosystems
      • Changing Ocean Chemistry
      • Estuarine and Coastal Carbon Fluxes
      • Ocean Carbon Uptake and Storage
      • Ocean Observatories
    • Code of Conduct
    • Get Involved
    • Project Office
    • Scientific Steering Committee
    • OCB committees
      • Ocean Time-series
      • US Biogeochemical-Argo
      • Ocean-Atmosphere Interaction
  • Activities
    • Summer Workshop
    • OCB Webinars
    • Guidelines for OCB Workshops & Activities
    • Topical Workshops
      • CMIP6 Models Workshop
      • Coastal BGS Obs with Fisheries
      • C-saw extreme events workshop
      • Expansion of BGC-Argo and Profiling Floats
      • Fish, fisheries and carbon
      • Future BioGeoSCAPES program
      • GO-BCG Scoping Workshop
      • Lateral Carbon Flux in Tidal Wetlands
      • Leaky Deltas Workshop – Spring 2025
      • Marine CDR Workshop
      • Ocean Nucleic Acids ‘Omics
      • Pathways Connecting Climate Changes to the Deep Ocean
    • Small Group Activities
      • Aquatic Continuum OCB-NACP Focus Group
      • Arctic-COLORS Data Synthesis
      • BECS Benthic Ecosystem and Carbon Synthesis WG
      • Carbon Isotopes in the Ocean Workshop
      • CMIP6 WG
      • Filling the gaps air–sea carbon fluxes WG
      • Fish Carbon WG
      • Meta-eukomics WG
      • mCDR
      • Metaproteomic Intercomparison
      • Mixotrophs & Mixotrophy WG
      • N-Fixation WG
      • Ocean Carbonate System Intercomparison Forum
      • Ocean Carbon Uptake WG
      • OOI BGC sensor WG
      • Operational Phytoplankton Observations WG
      • Phytoplankton Taxonomy WG
    • Other Workshops
    • Science Planning
      • Coastal CARbon Synthesis (CCARS)
      • North Atlantic-Arctic
    • Ocean Acidification PI Meetings
    • Training Activities
      • PACE Hackweek 2025
      • PACE Hackweek 2024
      • PACE Training Activity 2022
  • Science Support
    • Data management and archival
    • Early Career
    • Funding Sources
    • Jobs & Postdocs
    • Meeting List
    • OCB Topical Websites
      • Ocean Fertilization
      • Trace gases
      • US IIOE-2
    • Outreach & Education
    • Promoting your science
    • Student Opportunities
    • OCB Activity Proposal Solicitations
      • Guidelines for OCB Workshops & Activities
    • Travel Support
  • Publications
    • OCB Workshop Reports
    • Science Planning and Policy
    • Newsletter Archive
  • Science Highlights
  • News

Archive for north atlantic

Mixotrophs in the northern North Atlantic

Posted by mmaheigan 
· Tuesday, April 16th, 2024 

Mixotrophs (or mixoplankton) are now accepted as a third group of plankton alongside phytoplankton and zooplankton. Our knowledge of mixotrophs lags far behind that of the other two groups. We currently have only a limited understanding of mixotrophs’ biogeographical distribution across ocean basins, and what environmental factors are associated with their distribution.

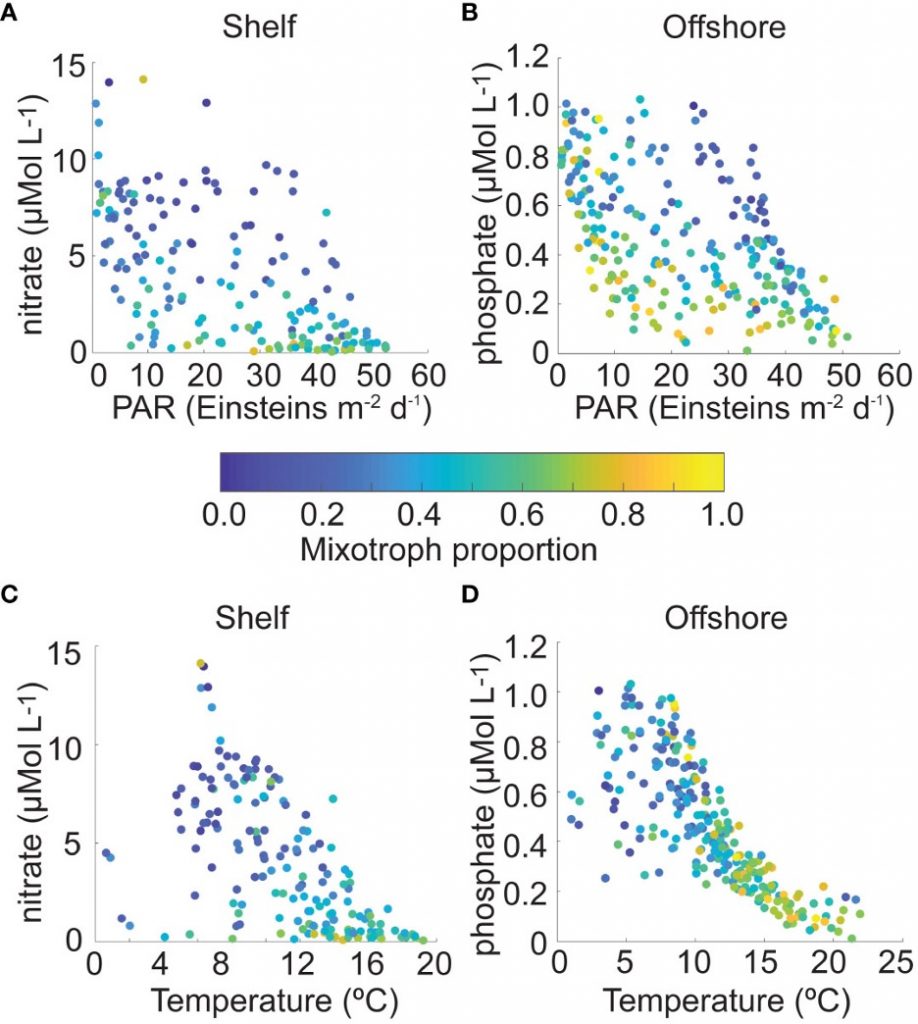
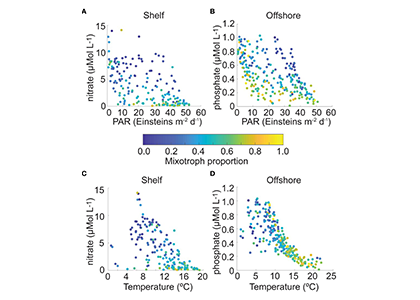
The authors of a study recently published in Frontiers in Marine Science reviewed nearly 230,000 individual microplankton samples collected by the North Atlantic Continuous Plankton Recorder program between 1958 and 2015 and calculated the proportion of organisms that are considered mixotrophs in each sample. They classified protist species in the dataset as phytoplankton, mixotrophs, or microzooplankton (heterotrophs), based on existing literature. Taken together across seasonsin shelf waters (depth ≤ 300m), mixotrophs comprise a greater proportion of the microplankton community when nitrate is high and photosynthetically available radiation (PAR) is low (e.g. during the late fall and winter), or when nitrate is low and PAR is moderate to high (e.g. during the summer and early fall). When both nitrate and PAR are high, mixotrophs comprise less of the community compared to phytoplankton. The same pattern was found in offshore waters (depth > 300m), but the key macronutrient was phosphate rather than nitrate. The annual average proportion of mixotrophs in microplankton samples compared to phytoplankton has increased since 1958 in the offshore portion of the study region, with a notable changepoint in 1993; this increasing trend is strongest in the winter season.

This paper is useful for aquatic ecologists who want to integrate mixotrophic plankton into their understanding of marine food webs and biogeochemical cycles. Understanding mixotroph temporal and spatial distributions, as well as the environmental conditions under which they flourish, is imperative to understanding their impact on trophic transfer and biogeochemical cycling.

Authors
Karen Stamieszkin (Bigelow Laboratory for Ocean Sciences)
Nicole Millette (Virginia Institute of Marine Science)
Jessica Luo (NOAA Geophysical Fluid Dynamics Laboratory)
Elizabeth Follett (University of Liverpool)
Nick Record (Bigelow Laboratory of Ocean Science)
David Johns (Marine Biological Association)


Backstory
This work and the collaboration that made it possible was catalyzed by the Eco-DAS XII symposium, attended by Karen Stamieszkin, Nicole Millette, Jessica Luo, and Elizabeth Follett in 2016. Nicole had an idea for an analysis but lacked collaborators, just as she was ready to give up on it, Karen, Jessica, and Elizabeth expressed interest in the project. Karen, Jessica, and Elizabeth each brought a unique perspective that helped make Nicole’s original idea more practical and ensured that the analysis would come to life.

The collaboration that began with this paper lead to the OCB Mixotrophs & Mixotrophy Working Group led by Karen, Jessica, and Nicole, and a successful grant proposal to study mixotrophy awarded to Nicole and Karen by NSF’s Biological Oceanography program. This story shows the importance and power of programs that connect researchers across disciplines, especially in the early stages of their careers.

Small particles contribute significantly to the biological carbon pump in the subpolar North Atlantic

Posted by mmaheigan 
· Monday, February 13th, 2023 

The ocean’s biological carbon pump (BCP) is a collection of processes that transport organic carbon from the surface to the deep ocean where the carbon is sequestered for decades to millennia. Variations in the strength of the BCP can substantially change atmospheric CO2 levels and affect the global climate. It is important to accurately estimate this carbon flux, but direct measurement is difficult so this remains a challenge.

Figure 1. (a) A schematic illustrating the downward transport of small and large POC into the deep ocean and the subsequent remineralization and fragmentation which breaks large POC into small POC. (b) Trajectories of BGC-Argo float segments. (c) Relative contributions to the annually averaged vertical carbon flux show the dominant role of gravitational sinking flux of large POC as well as the significant contributions from small POC at 100 m due to different mechanisms and at 600 m due to fragmentation.

A recent paper published in Limnology and Oceanography performed a novel mass budget analysis using observations of dissolved oxygen and particulate organic carbon (POC) from BGC-Argo floats in the subpolar North Atlantic. The authors assessed relative importance of different mechanisms contributing to the BCP and related processes, the sinking velocity and remineralization rate of different particle size classes as well as the rate of fragmentation which breaks large particles into smaller ones. Results suggest that on annual timescales, the gravitational settling of large POC is the dominant mechanism. Small POC supplements the vertical carbon flux at 100 m significantly, through various mechanisms, and contributes to carbon sequestration below 600 m due to fragmentation of large POC. In addition, sensitivity experiments highlight the importance of considering remineralization and fragmentation when estimating the vertical carbon flux of small POC.

This novel method provides additional independent constraints on current estimates and improves our mechanistic understanding of the BCP. In addition, it demonstrates the great potential of BGC-Argo float data for studying the biological carbon pump.


Authors:
Bin Wang (Dalhousie University)
Katja Fennel (Dalhousie University)

Using BGC-Argo to obtain depth-resolved net primary production

Posted by mmaheigan 
· Friday, July 23rd, 2021 

Net primary production (NPP)—the organic carbon produced by the phytoplankton minus the organic carbon respired by phytoplankton themselves—serves as a major energy source of the marine ecosystem. Traditional methods for measuring NPP rely on ship-based discrete sampling and bottle incubations (e.g., 14C incubation), which introduce potential artifacts and limit the spatial and temporal data coverage of the global ocean. The global distribution of NPP has been estimated using satellite observations, but the satellite remote sensing approach cannot provide direct information at depth.

Figure 1. Panel A. Trajectories of 5 BGC-Argo and 1 SOS-Argo with the initial float deployment locations denoted by filled symbols. The dash-line at 47° N divided the research area into the northern (temperate) and southern (subtropical) regions. Stars indicate ship stations where 14C NPP values were measured during NAAMES cruises and compared with NPP from nearby Argo floats. Panels B and C. Monthly climatologies of net primary production (NPP, mmol m-3 d-1) profiles in the northern and southern regions of the research area, derived from BGC-Argo measurements using the PPM model. The shadings indicate one standard deviation. The red dotted line indicates mixed layer depth (MLD, m), and the yellow dashed line shows euphotic depth (Z1%, m).

To fill this niche, a recent study in Journal of Geophysical Research: Biogeosciences, applied bio-optical measurements from Argo profiling floats to study the year-round depth-resolved NPP of the western North Atlantic Ocean (39° N to 54° N). The authors calculated NPP with two bio-optical models (Carbon-based Productivity Model, CbPM; and Photoacclimation Productivity Model, PPM). A comparison with NPP profiles from 14C incubation measurements showed advantages and limitations of both models. CbPM reproduced the magnitude of NPP in most cases, but had artifacts in the summer (a large NPP peak in the subsurface) due to the subsurface chlorophyll maximum caused by photoacclimation. PPM avoided the artifacts in the summer from photoacclimation, but the magnitude of PPM-derived NPP was smaller than the 14C result. Latitudinally varying NPP were observed, including higher winter NPP/lower summer NPP in the south, timing differences in NPP seasonal phenology, and different NPP depth distribution patterns in the summer months. With a 6-month record of concurrent oxygen and bio-optical measurements from two Argo floats, the authors also demonstrated the ability of Argo profiling floats to obtain estimates of the net community production (NCP) to NPP ratio (f-ratio), ranging from 0.3 in July to -1.0 in December 2016.

This work highlights the utility of float bio-optical profiles in comparison to traditional measurements and indicates that environmental conditions (e.g. light availability, nutrient supply) are major factors controlling the seasonality and spatial (horizontal and vertical) distributions of NPP in the western North Atlantic Ocean.


Authors:
Bo Yang (University of Virginia, UM CIMAS/NOAA AOML)
James Fox (Oregon State University)
Michael J. Behrenfeld (Oregon State University)
Emmanuel S. Boss (University of Maine)
Nils Haëntjens (University of Maine)
Kimberly H. Halsey (Oregon State University)
Steven R. Emerson (University of Washington)
Scott C. Doney (University of Virginia)

Autonomous platforms yield new insights on North Atlantic bloom phenology

Posted by mmaheigan 
· Wednesday, April 22nd, 2020 

Phytoplankton produces organic carbon, which serves as a major energy source in marine food webs and plays an important role in the global carbon cycle. Studies of phytoplankton seasonal timing (phenology) have been a major focus in oceanography, especially in the subpolar North Atlantic region, where massive increases in phytoplankton biomass (blooms) occur during the winter-spring transition.

Figure 1. Panel a: Each line represents the trajectory of a profiling Argo float deployed during the North Atlantic Aerosols and Marine Ecosystems Study (NAAMES) expeditions (12 total); the initial float deployment location is denoted by a filled circle. The bar chart (inset right bottom) indicates float deployment durations. Panel b: Seasonal climatologies of Cphyto (green), µ (blue), l (red), and r (grey) from Argo floats for all 4 regions (D1-D4 as indicated on map in Panel a).

Many hypotheses based on data from shipboard discrete sampling or satellite remote sensing have been proposed to explain drivers of phytoplankton bloom formation and dynamics. However, discrete shipboard sampling limits both spatial and temporal coverage, and satellite approaches cannot provide direct information at depth. To address this gap in spatiotemporal coverage, a recent study in Frontiers in Marine Science, applied bio-optical measurements from 12 Argo profiling floats to study the year-round phytoplankton phenology in a north-south section of the western North Atlantic Ocean (40° N to 60° N). The authors calculated phytoplankton division rate (µ), loss rate (l), and carbon accumulation rate (r) using the Argo-based Chlorophyll-a (Chl) and phytoplankton carbon (Cphyto) estimates. Latitudinally varying phytoplankton dynamics were observed, with a higher (and later) Cphyto peak in the north, and stronger μ–r decoupling and increased proportion of winter to total annual production in the south (Figure 1). Seasonal phenology patterns arise from interactions between “bottom-up” (e.g., resources for growth) and “top-down” (e.g., grazing, mortality) factors that involve both biological and physical drivers. The Argo float data are consistent with the disturbance recovery hypothesis (DRH) over a full annual cycle. Float-based mixed layer phytoplankton phenology observations were comparable to satellite remote sensing observations. In a data-model comparison, outputs from an eddy-resolving ocean simulation only reproduced some of the observed phytoplankton phenology, indicating possible biases in the simulated physical forcing, turbulent dynamics, and biophysical interactions.

In addition to seasonal patterns in the mixed layer, float-based measurements provide information on the vertical distribution of physical and biogeochemical quantities and therefore are complementary to the satellite measurements. This powerful combination of observing assets enhances spatiotemporal coverage, thus enabling us to better observe, compare, model, and predict seasonal phytoplankton dynamics in the subpolar North Atlantic.


Authors:
Bo Yang (University of Virginia)
Emmanuel S. Boss (University of Maine)
Nils Haëntjens (University of Maine)
Matthew C. Long (National Center for Atmospheric Research)
Michael J. Behrenfeld (Oregon State University)
Rachel Eveleth (Oberlin College)
Scott C. Doney (University of Virginia)

Estimating the large-scale biological pump: Do eddies matter?

Posted by mmaheigan 
· Wednesday, December 4th, 2019 

One factor that limits our capacity to quantify the ocean biological carbon pump is uncertainty associated with the physical injection of particulate (POC) and dissolved (DOC) organic carbon to the ocean interior. It is challenging to integrate the effects of these pumps, which operate at small spatial (<100 km) and temporal (<1 month) scales. Previous observational and fine-scale modeling studies have thus far been unable to quantify these small-scale effects. In a recent study published in Global Biogeochemical Cycles, authors explored the influence of these physical carbon pumps relative to sinking (gravity-driven) particles on annual and regional scales using a high-resolution (2 km) biophysical model of the North Atlantic that simulates intense eddy-driven subduction hotspots that are consistent with observations.

Figure 1: North Atlantic idealized double gyre ocean biophysical model. Top: Sea surface temperature, surface chlorophyll and mixed-layer depth during the spring bloom (March 21). Bottom: total export of organic carbon (POC+DOC) at 100 and individual contributions from the gravitational (particle sinking) and subduction (mixing, eddy advection and Ekman pumping) pumps for one day during the spring bloom (March 21) and averaged annually. Physical subduction hotspots visible on the daily export contribute little to the annual export due to strong compensation of upward and downward motions.

The authors showed that eddy dynamics can transport carbon below the mixed-layer (500-1000 m depth), but this mechanism contributes little (<5%) to annual export at the basin scale due to strong compensation between upward and downward fluxes (Figure 1). Additionally, the authors evidenced that small-scale mixing events intermittently export large amounts of suspended DOC and POC.

These results underscore the need to expand the traditional view of the mixed-layer carbon pump (wintertime export of DOC) to include downward mixing of POC associated with short-lived springtime mixing events, as well as eddy-driven subduction, which can contribute to longer-term ocean carbon storage. High-resolution measurements are needed to validate these model results and constrain the magnitude of the compensation between upward and downward carbon transport by small-scale physical processes.


Authors:
Laure Resplandy (Princeton University)
Marina Lévy (Sorbonne Université)
Dennis J. McGillicuddy Jr. (WHOI)

Industrial era climate forcing drives multi-century decline in North Atlantic productivity

Posted by mmaheigan 
· Wednesday, October 2nd, 2019 

Phytoplankton respond directly to climate forcing, and due to their central role in global oxygen production and atmospheric carbon sequestration, they are critical components of the Earth’s climate system. There are however few observations detailing past variability in marine primary productivity, particularly over multi-decadal to centennial timescales. This limits our understanding of the long-term impact of climatic forcing on both past and future marine productivity.

Multi-century decline of subarctic Atlantic productivity. From top: standardized (z-score units relative to ad 1958-2016) indices of Continuous Plankton Recorder (CPR)-based diatom, dinoflagellate and coccolithophore relative-abundances; North Atlantic [chlorophyll-α] reconstruction from Boyce et al. (2010, Nature); ice core-based [MSA] PC1 productivity index. The “Industrial Onset” range shows the estimated initiation of declining subarctic Atlantic productivity; reconstructed (Rahmstorf et al., 2015, Nat. Clim. Change) and observed sea-surface temperature-based Atlantic Meridional Overturning Circulation (i.e., AMOC) index, alongside 5-year averaged subarctic Atlantic freshwater storage anomalies (relative to A.D. 1955) from Curry and Mauritzen (2005; Science).

Authors of a new study published in Nature used a high-resolution signal of marine biogenic aerosol emissions (methanesulfonic acid, or “MSA”) preserved within twelve Greenland ice cores to reconstruct a ~250-year record of marine productivity variations across the subarctic Atlantic basin, one of the most biologically productive and climatically sensitive regions on Earth. These results provide the most continuous proxy-based reconstruction of basin-scale productivity to date in this region, illuminating the following major findings: (1) subarctic Atlantic marine productivity has declined over the industrial era by as much as 10 ± 7%; (2) the early 19th century onset of declining productivity coincides with the regional onset of industrial-era surface warming, and also strongly covaries with regional sea surface temperatures and basin-scale gyre circulation strength; (3) there is strong decadal- to centennial-scale coherence between northern Atlantic productivity variability and declining Atlantic Meridional Overturning Circulation (AMOC) strength, as predicted by prior model-based studies.

Future atmospheric warming is predicted to contribute to accelerating Greenland Ice Sheet runoff, ocean-surface freshening, and AMOC slowdown, suggesting the potential for continued declines in productivity across this dynamic and climatically important region. Such declines will, in turn, have important implications for future maritime economies, global food security, and drawdown of atmospheric carbon dioxide.


Authors:
Matthew Osman (Massachusetts Institute of Technology)
Sarah Das (Woods Hole Oceanographic Institution)
Luke Trusel (Rowan University)
Matthew Evans (Wheaton College)
Hubertus Fischer (University of Bern)
Mackenzie Griemann (University of California, Irvine)
Sepp Kipfstuhl (Alfred-Wegener-Institute)
Joseph McConnell (Desert Research Institute)
Eric Saltzman (University of California, Irvine)


Figure references:
Boyce, D. G., Lewis, M. R. & Worm, B. (2010) Global phytoplankton decline over the past century. Nature 466, 591–596.

Curry, R. & Mauritzen, C. (2005) Dilution of the northern North Atlantic Ocean in recent decades. Science 308, 1772–1774.

Rahmstorf, S. et al. (2015) Exceptional twentieth-century slowdown in Atlantic Ocean overturning circulation. Nat. Clim. Change 5, 475–480.

Forecasting air-sea CO2 flux variations several years in advance

Posted by mmaheigan 
· Tuesday, July 9th, 2019 

Year-to-year changes in the flux of CO2 between the atmosphere and the ocean impact the global carbon cycle and climate system, and challenge our ability to verify fossil fuel CO2 emissions. A new study published in Earth System Dynamics suggests that these air-sea CO2 flux variations are predictable several years in advance.

A novel set of initialized forecasts of past air-sea CO2 flux from an Earth system model (Figure 1a) confidently predicts year-to-year variations in the globally-integrated flux up to two years in advance. At regional scales, the forecast lead time increases. The predictability of CO2 flux from the initialized forecast system exceeds that obtained solely from foreknowledge of variations in external forcing (e.g., volcanic eruptions) or a simple persistence forecast (e.g., CO2 flux this year will be the same as next year). The longest-lasting forecast enhancements are in the subantarctic Southern Ocean and the northern North Atlantic (Figure 1b).

Figure 1: (a) Forecasts of the past evolution of air-sea CO2 flux in the South Pacific using an Earth System model indicate the potential to predict the future evolution of this quantity. (b) In each biome, the maximum forecast lead time in which the initialized forecast of air-sea CO2 flux beats out other forecast methods.

These results are particularly meaningful for those forecasting year-to-year changes in the global carbon budget, especially as these forecasting efforts are blind to the externally-forced variability in advance (i.e., the external forcing of the future is unknown).  In this way, forecasts of air-sea CO2 flux variations can help to inform future predictions of land-air CO2 flux and atmospheric CO2 concentration.

Authors:
Nicole Lovenduski (University of Colorado Boulder)
Stephen G. Yeager (National Center for Atmospheric Research)
Keith Lindsay (National Center for Atmospheric Research)
Matthew C. Long (National Center for Atmospheric Research)

See also the OCB Ocean-Atmosphere Interactions: Scoping directions for U.S. research Workshop to be held in October 1-3, 2019

Volcanic carbon dioxide drove ancient global warming event

Posted by mmaheigan 
· Thursday, March 29th, 2018 

A study recently published in Nature suggests that an extreme global warming event 56 million years ago known as the Palaeocene-Eocene Thermal Maximum (PETM) was driven by massive CO2 emissions from volcanoes during the formation of the North Atlantic Ocean. Using a combination of new geochemical measurements and novel global climate modelling, the study revealed that atmospheric CO2 more than doubled in less than 25,000 years during the PETM.

The PETM lasted ~150,000 years and is the most rapid and extreme natural global warming event of the last 66 million years. During the PETM, global temperatures increased by at least 5°C, comparable to temperatures projected in the next century and beyond. While it has long been suggested that the PETM event was caused by the injection of carbon into the ocean and atmosphere, the source and total amount of carbon, as well as the underlying mechanism have thus far remained elusive. The PETM roughly coincided with the formation of massive flood basalts resulting from of a series of eruptions that occurred as Greenland and North America started separating from Europe, thereby creating the North Atlantic Ocean. What was missing is evidence linking the volcanic activity to the carbon release and warming that marks the PETM.

To identify the source of carbon, the authors measured changes in the balance of isotopes of the element boron in ancient sediment-bound marine fossils called foraminifera to generate a new record of ocean pH throughout the PETM. Ocean pH tells us about the amount of carbon absorbed by ancient seawater, but we can get even more information by also considering changes in the isotopes of carbon, which provide information about the carbon source. When forced with these ocean pH and carbon isotope data, a numerical global climate model implicates large-scale volcanism associated with the opening of the North Atlantic as the primary driver of the PETM.


North Atlantic microfossil-derived isotope records from extinct planktonic foraminiferal species M. subbotinae relative to the onset of the PETM carbon isotope excursion (CIE). The negative trend in carbon isotope composition (A) during the carbon emission phase is accompanied by decreasing pH (decreasing δ11B, panel B) and increasing temperature (decreasing δ18O, panel C). Panels D and E zoom in on the PETM CIE, showing microfossil δ13C (D) and δ11B-based pH (E) reconstructions. Also included in E are data from Penman et al. (2014) on their original age model, with recalculated (lab-based) pH values.


These new results suggest that the PETM was associated with a total input of >12,000 petagrams of carbon from a predominantly volcanic source. This is a vast amount of carbon—30 times larger than all of the fossil fuels burned to date and equivalent to all current conventional and unconventional fossil fuel reserves. In the following Earth System Model simulations, it resulted in the concentration of atmospheric CO2 increasing from ~850 parts per million to >2000 ppm. The Earth’s mantle contains more than enough carbon to explain this dramatic rise, and it would have been released as magma poured from volcanic rifts at the Earth’s surface.

How the ancient Earth system responded to this carbon injection at the PETM can tell us a great deal about how it might respond in the future to man-made climate change. Earth’s warming at the PETM was about what we would expect given the CO2 emitted and what we know about the sensitivity of the climate system based on Intergovernmental Panel on Climate Change (IPCC) reports. However, the rate of carbon addition during the PETM was about twenty times slower than today’s human-made carbon emissions.

In the model outputs, carbon cycle feedbacks such as methane release from gas hydrates—once the favoured explanation of the PETM—did not play a major role in driving the event. Additionally, one unexpected result was that enhanced organic matter burial was important in ultimately drawing down the released carbon out of the atmosphere and ocean and thereby accelerating the recovery of the Earth system.


Authors:
Marcus Gutjahr (National Oceanography Centre Southamption, GEOMAR)
Andy Ridgwell (Bristol University, University of California Riverside)
Philip F. Sexton (The Open University, UK)
Eleni Anagnostou (National Oceanography Centre Southamption)
Paul N. Pearson (Cardiff University)
Heiko Pälike (University of Bremen)
Richard D. Norris (Scripps Institution of Oceanography)
Ellen Thomas (Yale University, Wesleyan University)
Gavin L. Foster (National Oceanography Centre Southamption)


Role for iron in controlling microbial phosphorus acquisition in the ocean

Posted by mmaheigan 
· Thursday, October 12th, 2017 

In the subtropical North Atlantic, dissolved inorganic phosphorus (DIP) concentrations are depleted and might co-limit N2 fixation and microbial productivity. There are relatively large pools of dissolved organic phosphorus (DOP), but microbes need an enzyme to access this P source. One such alkaline phosphatase (APase) enzyme requires zinc (Zn) as its activating cofactor. This has been known for almost 30 years. However, recent crystallography studies revealed that two other widespread APase enzymes contain Fe. Via this requirement, Fe availability could regulate microbial access to the DOP pool.

As detailed in a recent publication in Nature Communications (Browning et al. 2017), this hypothesis was tested on a cruise across the tropical North Atlantic by adding Fe and Zn to incubated seawater and monitoring changes in bulk APase using a simple fluorescence assay. Adding Fe significantly increased APase activity in seawater samples collected in areas that were far-removed from coastal and aerosol Fe sources. Despite seawater Zn concentrations being much lower than Fe, it appeared not to be limiting.


Iron (Fe) and zinc (Zn) enrichment experiments conducted in the DIP-depleted tropical North Atlantic suggested that Fe, not Zn, could limit alkaline phosphatase activity (APA). DIP*=DIP–DIN/16, and represents excess DIP availability assuming a 16-fold higher microbial N requirement. Results in the bar chart represent a subset of treatments from one experiment (out of eight conducted).

DIP is depleted in surface waters of the tropical North Atlantic because inputs of North African aerosol Fe stimulates N2 fixation and leads to microbial drawdown of DIP. If the modern ocean is a good analog for the past, the lack of APase stimulation following experimental Zn addition could reflect limited evolutionary selection for Zn-containing APase. In general, DIP is only substantially depleted where there is enhanced Fe input fueling N2 fixation; it therefore follows that any significant requirement for APases might be restricted to these relatively high-Fe, low-Zn waters.

On a shorter timescale, growing anthropogenic nitrogen input to the ocean relative to phosphorus could result in more prevalent oceanic phosphorus deficiency. Corresponding iron inputs might then serve as an important control on phosphorus availability for microbes in these regions.


Authors:

Tom Browning (GEOMAR Helmholtz Centre for Ocean Research, Kiel, Germany)
Eric Achterberg (GEOMAR) 
Jaw Chuen Yong (GEOMAR)
Insa Rapp (GEOMAR)
Caroline Utermann (GEOMAR) 
Anja Engel (GEOMAR)
Mark Moore (Ocean and Earth Science, University of Southampton, Southampton, UK)


Tiny marine animals strongly influence the carbon cycle

Posted by mmaheigan 
· Thursday, August 31st, 2017 

What controls the amount of organic carbon entering the deep ocean? In the sunlit layer of the ocean, phytoplankton transform inorganic carbon to organic carbon via a process called photosynthesis. As these particulate forms of organic carbon stick together, they become dense enough to sink out of the sunlit layer, transferring large quantities of organic carbon to the deep ocean and out of contact with the atmosphere.

However, all is not still in the dark ocean. Microbial organisms such as bacteria, and zooplankton consume the sinking, carbon-rich particles and convert the organic carbon back to its original inorganic form. Depending on how deep this occurs, the carbon can be physically mixed back up into the surface layers for exchange with the atmosphere or repeat consumption by phytoplankton. In a recent study published in Biogeosciences, researchers used field data and an ecosystem model in three very different oceanic regions to show that zooplankton are extremely important in determining how much carbon reaches the deep ocean.

Figure 1. Particle export and transfer efficiency to the deep ocean in the Southern Ocean (SO, blue circles), North Atlantic Porcupine Abyssal Plain site (PAP, red squares) and the Equatorial Tropical North Pacific (ETNP, orange triangles) oxygen minimum zone. a) particle export efficiency of fast sinking particles (Fast PEeff) against primary production on a Log10 scale. b) transfer efficiency of particles to the deep ocean expressed as Martin’s b (high b = low efficiency). Error bars in b) are standard error of the mean for observed particles, error too small in model to be seen on this plot.

In the Southern Ocean (SO), zooplankton graze on phytoplankton and produce rapidly sinking fecal pellets, resulting in an inverse relationship between particle export and primary production (Fig. 1a). In the North Atlantic (NA), the efficiency with which particles are transferred to the deep ocean is comparable to that of the Southern Ocean, suggesting similar processes apply; but in both regions, there is a large discrepancy between the field data and the ecosystem model (Fig. 1b), which poorly represents particle processing by zooplankton. Conversely, much better data-model matches are observed in the equatorial Pacific, where lower oxygen concentrations mean fewer zooplankton; this reduces the potential for zooplankton-particle interactions that reduce particle size and density, resulting in a lower transfer efficiency.

This result suggests that mismatches between the data and model in the SO and NA may be due to the lack of zooplankton-particle parameterizations in the model, highlighting the potential importance of zooplankton in regulating carbon export and storage in the deep ocean. Zooplankton parameterizations in ecosystem models must be enhanced by including zooplankton fragmentation of particles as well as consumption. Large field programs such as EXPORTS could help constrain these parameterisation by collecting data on zooplankton-particle interaction rates. This will improve our model estimates of carbon export and our ability to predict future changes in the biological carbon pump. This is especially important in the face of climate-driven changes in zooplankton populations (e.g. oxygen minimum zone (OMZ) expansion) and associated implications for ocean carbon storage and atmospheric carbon dioxide levels.


Authors:
Emma L. Cavan (University of Tasmania)
Stephanie A. Henson (National Oceanography Centre, Southampton)
Anna Belcher (University of Southampton)
Richard Sanders (National Oceanography Centre, Southampton)

Next Page »

Filter by Keyword

abundance acidification additionality advection africa air-sea air-sea interactions algae alkalinity allometry ammonium AMO AMOC anoxic Antarctic Antarctica anthro impacts anthropogenic carbon anthropogenic impacts appendicularia aquaculture aquatic continuum aragonite saturation arctic Argo argon arsenic artificial seawater Atlantic atmospheric CO2 atmospheric nitrogen deposition authigenic carbonates autonomous platforms bacteria bathypelagic BATS BCG Argo benthic bgc argo bio-go-ship bio-optical bioavailability biogeochemical cycles biogeochemical models biogeochemistry Biological Essential Ocean Variables biological pump biophysics bloom blue carbon bottom water boundary layer buffer capacity C14 CaCO3 calcification calcite carbon carbon-climate feedback carbon-sulfur coupling carbonate carbonate system carbon budget carbon cycle carbon dioxide carbon export carbon fluxes carbon sequestration carbon storage Caribbean CCA CCS changing marine chemistry changing marine ecosystems changing marine environments changing ocean chemistry chemical oceanographic data chemical speciation chemoautotroph chesapeake bay chl a chlorophyll circulation CO2 coastal and estuarine coastal darkening coastal ocean cobalt Coccolithophores commercial community composition competition conservation cooling effect copepod copepods coral reefs CTD currents cyclone daily cycles data data access data assimilation database data management data product Data standards DCM dead zone decadal trends decomposers decomposition deep convection deep ocean deep sea coral denitrification deoxygenation depth diatoms DIC diel migration diffusion dimethylsulfide dinoflagellate dinoflagellates discrete measurements distribution DOC DOM domoic acid DOP dust DVM ecology economics ecosystem management ecosystems eddy Education EEZ Ekman transport emissions ENSO enzyme equatorial current equatorial regions ESM estuarine and coastal carbon fluxes estuary euphotic zone eutrophication evolution export export fluxes export production extreme events faecal pellets fecal pellets filter feeders filtration rates fire fish Fish carbon fisheries fishing floats fluid dynamics fluorescence food webs forage fish forams freshening freshwater frontal zone functional role future oceans gelatinous zooplankton geochemistry geoengineering geologic time GEOTRACES glaciers gliders global carbon budget global ocean global warming go-ship grazing greenhouse gas greenhouse gases Greenland ground truthing groundwater Gulf of Maine Gulf of Mexico Gulf Stream gyre harmful algal bloom high latitude human food human impact human well-being hurricane hydrogen hydrothermal hypoxia ice age ice cores ice cover industrial onset inland waters in situ inverse circulation ions iron iron fertilization iron limitation isotopes jellies katabatic winds kelvin waves krill kuroshio lab vs field land-ocean continuum larvaceans lateral transport LGM lidar ligands light light attenuation lipids low nutrient machine learning mangroves marine carbon cycle marine heatwave marine particles marine snowfall marshes mCDR mechanisms Mediterranean meltwater mesopelagic mesoscale mesoscale processes metagenome metals methane methods microbes microlayer microorganisms microplankton microscale microzooplankton midwater mitigation mixed layer mixed layers mixing mixotrophs mixotrophy model modeling model validation mode water molecular diffusion MPT MRV multi-decade n2o NAAMES NCP nearshore net community production net primary productivity new ocean state new technology Niskin bottle nitrate nitrogen nitrogen cycle nitrogen fixation nitrous oxide north atlantic north pacific North Sea nuclear war nutricline nutrient budget nutrient cycles nutrient cycling nutrient limitation nutrients OA observations ocean-atmosphere ocean acidification ocean acidification data ocean alkalinity enhancement ocean carbon storage and uptake ocean carbon uptake and storage ocean color ocean modeling ocean observatories ocean warming ODZ oligotrophic omics OMZ open ocean optics organic particles oscillation outwelling overturning circulation oxygen pacific paleoceanography PAR parameter optimization parasite particle flux particles partnerships pCO2 PDO peat pelagic PETM pH phenology phosphate phosphorus photosynthesis physical processes physiology phytoplankton PIC piezophilic piezotolerant plankton POC polar polar regions policy pollutants precipitation predation predator-prey prediction pressure primary productivity Prochlorococcus productivity prokaryotes proteins pteropods pycnocline radioisotopes remineralization remote sensing repeat hydrography residence time resource management respiration resuspension rivers rocky shore Rossby waves Ross Sea ROV salinity salt marsh satellite scale seafloor seagrass sea ice sea level rise seasonal seasonality seasonal patterns seasonal trends sea spray seawater collection seaweed secchi sediments sensors sequestration shelf ocean shelf system shells ship-based observations shorelines siderophore silica silicate silicon cycle sinking sinking particles size SOCCOM soil carbon southern ocean south pacific spatial covariations speciation SST state estimation stoichiometry subduction submesoscale subpolar subtropical sulfate surf surface surface ocean Synechococcus technology teleconnections temperate temperature temporal covariations thermocline thermodynamics thermohaline thorium tidal time-series time of emergence titration top predators total alkalinity trace elements trace metals trait-based transfer efficiency transient features trawling Tris trophic transfer tropical turbulence twilight zone upper ocean upper water column upwelling US CLIVAR validation velocity gradient ventilation vertical flux vertical migration vertical transport warming water clarity water mass water quality waves weathering western boundary currents wetlands winter mixing zooplankton

Copyright © 2025 - OCB Project Office, Woods Hole Oceanographic Institution, 266 Woods Hole Rd, MS #25, Woods Hole, MA 02543 USA Phone: 508-289-2838  •  Fax: 508-457-2193  •  Email: ocb_news@us-ocb.org

link to nsflink to noaalink to WHOI

Funding for the Ocean Carbon & Biogeochemistry Project Office is provided by the National Science Foundation (NSF) and the National Aeronautics and Space Administration (NASA). The OCB Project Office is housed at the Woods Hole Oceanographic Institution.