Do you work with over-determined datasets of seawater carbon dioxide system chemistry? QUODcarb (Quantifying Uncertainty in an Over-Determined marine carbonate system), a new over-determined CO2-system solver is described in the recently published “QUODcarb: A Bayesian solver for over-determined datasets of seawater carbon dioxide system chemistry.” The Bayesian formulation of the novel solver and demonstrates its use on an over-determined dataset from the Gulf of Mexico (COMECC-3) that included measurements of DIC, AT, pH, pCO2, and [CO3]. The over-determined calculations, with self-consistent uncertainty quantification, can calculate carbonate ion concentration uncertainty within the GOA-ON climate uncertainty target of 1% with implications for ocean acidification monitoring projects.
Find the Matlab code on GitHub: https://github.com/fprimeau/QUODcarb
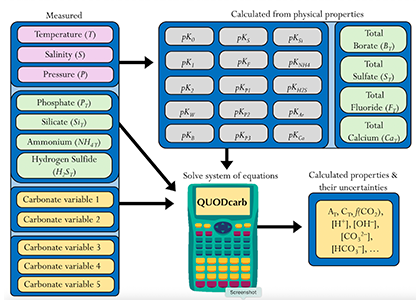
Figure caption: Diagram depicting the measured quantities (left side) and the use of thermodynamic constant (pK) formulations and mass balance total (_T) formulations in seawater carbonate chemistry calculations. Adapted from Figure 1 in Carter et al., 2024 a, to illustrate how QUODcarb can replace CO2SYS calculations to include three or more carbonate variable measurements in over-determined calculations while also enabling uncertainty quantification.
Physical measurements are shown with pink backgrounds, mass balance total contents are shown with light green backgrounds, thermodynamic constants are in gray, and carbonate chemistry variables are in yellow. Temperature dependent carbonate chemistry measurements (e.g., pH and pCO2) may be included at different input temperatures. The calculator reflects the analogy that QUODcarb acts as a calculator for solving the system of nonlinear equations.
Authors
Marina Fennell (University of California, Irvine)
Francois Primeau (University of California, Irvine)