Ocean Carbon & Biogeochemistry
Studying marine ecosystems and biogeochemical cycles in the face of environmental change
  • Home
  • About OCB
    • About Us
    • Scientific Breadth
      • Biological Pump
      • Changing Marine Ecosystems
      • Changing Ocean Chemistry
      • Estuarine and Coastal Carbon Fluxes
      • Ocean Carbon Uptake and Storage
      • Ocean Observatories
    • Code of Conduct
    • Get Involved
    • Project Office
    • Scientific Steering Committee
    • OCB committees
      • Ocean Time-series
      • US Biogeochemical-Argo
      • Ocean-Atmosphere Interaction
  • Activities
    • Summer Workshop
    • OCB Webinars
    • Guidelines for OCB Workshops & Activities
    • Topical Workshops
      • CMIP6 Models Workshop
      • Coastal BGS Obs with Fisheries
      • C-saw extreme events workshop
      • Expansion of BGC-Argo and Profiling Floats
      • Fish, fisheries and carbon
      • Future BioGeoSCAPES program
      • GO-BCG Scoping Workshop
      • Lateral Carbon Flux in Tidal Wetlands
      • Leaky Deltas Workshop – Spring 2025
      • Marine CDR Workshop
      • Ocean Nucleic Acids ‘Omics
      • Pathways Connecting Climate Changes to the Deep Ocean
    • Small Group Activities
      • Aquatic Continuum OCB-NACP Focus Group
      • Arctic-COLORS Data Synthesis
      • BECS Benthic Ecosystem and Carbon Synthesis WG
      • Carbon Isotopes in the Ocean Workshop
      • CMIP6 WG
      • Filling the gaps air–sea carbon fluxes WG
      • Fish Carbon WG
      • Meta-eukomics WG
      • mCDR
      • Metaproteomic Intercomparison
      • Mixotrophs & Mixotrophy WG
      • N-Fixation WG
      • Ocean Carbonate System Intercomparison Forum
      • Ocean Carbon Uptake WG
      • OOI BGC sensor WG
      • Operational Phytoplankton Observations WG
      • Phytoplankton Taxonomy WG
    • Other Workshops
    • Science Planning
      • Coastal CARbon Synthesis (CCARS)
      • North Atlantic-Arctic
    • Ocean Acidification PI Meetings
    • Training Activities
      • PACE Hackweek 2025
      • PACE Hackweek 2024
      • PACE Training Activity 2022
  • Science Support
    • Data management and archival
    • Early Career
    • Funding Sources
    • Jobs & Postdocs
    • Meeting List
    • OCB Topical Websites
      • Ocean Fertilization
      • Trace gases
      • US IIOE-2
    • Outreach & Education
    • Promoting your science
    • Student Opportunities
    • OCB Activity Proposal Solicitations
      • Guidelines for OCB Workshops & Activities
    • Travel Support
  • Publications
    • OCB Workshop Reports
    • Science Planning and Policy
    • Newsletter Archive
  • Science Highlights
  • News

Archive for surface ocean

Microbial Iron limitation in the ocean’s twilight zone

Posted by mmaheigan 
· Monday, March 31st, 2025 

How deep in the ocean do microbes feel the effects of nutrient limitation? Microbial production in one third of the surface ocean is limited by the essential micronutrient iron (Fe). This limitation extends to at least the bottom of the euphotic zone, but what happens below that?

In a study that recently published in Nature we investigated the abundance and distribution of siderophores, small metabolites synthesized by bacteria to promote Fe uptake. When environmental Fe concentrations become limiting and microbes become Fe deficient, some bacteria release siderophores into the environment to bind iron and facilitate its uptake. Siderophores are therefore a window into how microbes “see” environmental Fe. We found that siderophore concentrations were high in low Fe surface waters, but surprisingly we also found siderophores to be abundant in the twilight zone (200-500 m) underlying the North and South Pacific subtropical gyres, two key ecosystems for the marine carbon cycle. In shipboard experiments with siderophores labeled with the rare 57Fe isotope, we found rapid uptake of the label in twilight zone samples. After removing 57Fe from the 57Fe-siderophores complex, bacteria released the now unlabeled siderophores back into seawater to complex additional Fe (Figure. 1).

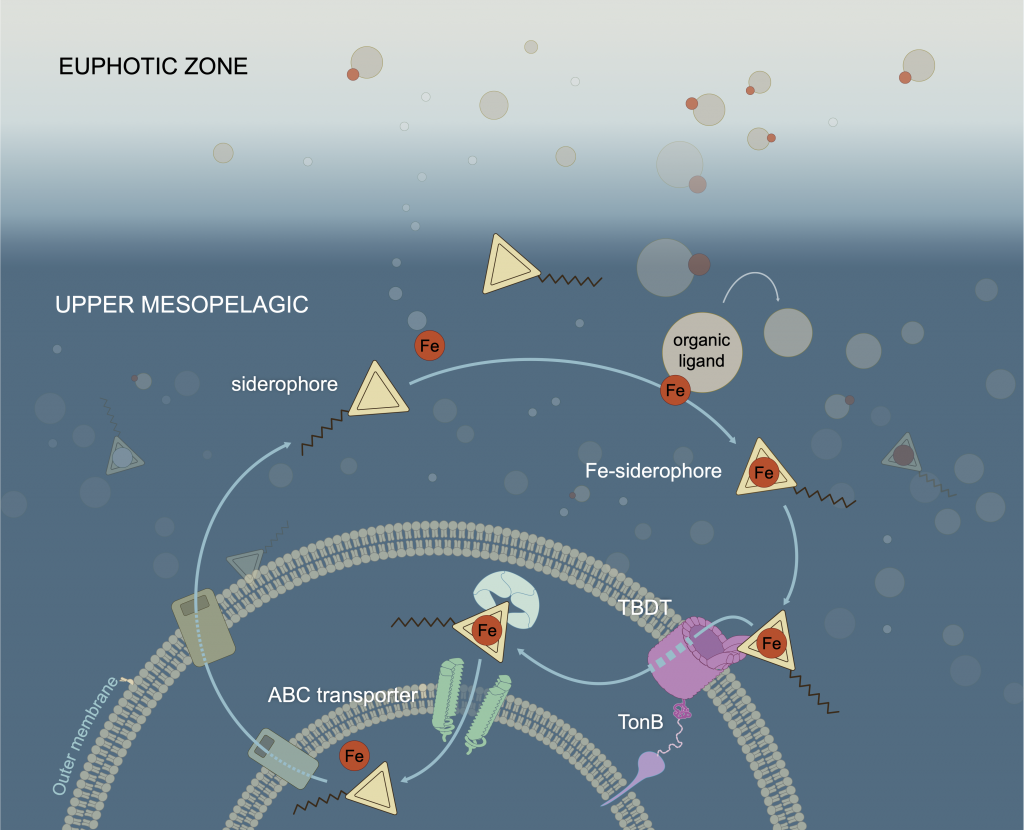
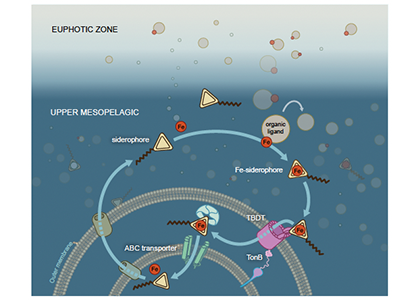
Figure 1: Iron-siderophore cycling in the twilight zone. When the seawater becomes Fe-deficient, some bacteria are able to synthesize siderophores and release them into the environment (middle left). These metabolites bind Fe (middle right) and the Fe-siderophore complex is taken up by bacteria using specialized TonB dependent transporters (TBDT; bottom right). Inside the cell, Fe is recovered from the Fe-siderophore complex (bottom left) and the siderophore excreted back into the environment to start the cycle anew.

Our results show that in large parts of the ocean microbes feel the effects of nutrient limitation deep in the water column, to at least 500 m. This greatly expands the region of the ocean where nutrients limit microbial metabolism. The effects of limitation this deep in the water column are unexplored, but twilight zone Fe deficiency could have unanticipated consequences for the efficiency of the ocean’s biological carbon pump.


Authors
Jingxuan Li, Lydia Babcock-Adams and Daniel Repeta
(all at Woods Hole Oceanographic Institution)

Unveiling the Past and Future of Ocean Acidification: A Novel Data Product covering 10 Global Surface OA Indicators

Posted by mmaheigan 
· Wednesday, August 23rd, 2023 

Accurately predicting future ocean acidification (OA) conditions is crucial for advancing research at regional and global scales, and guiding society’s mitigation and adaptation efforts.

As an update to Jiang et al. 2019, this new model-data fusion product:
1. Utilizes an ensemble of 14 distinct Earth System Models from the Coupled Model Intercomparison Project Phase 6 (CMIP6) along with three recent observational ocean carbon data products –>instead of relying on just one model (i.e., the GFDL-ESM2M) this approach reduces potential projection biases in OA indicators.
2. Eliminates model biases using observational data, and model drift with pre-Industrial controls.
3. Covers 10 OA indicators, an expansion from the usual pH, acidity, and buffer capacity.
4. Incorporates the new Shared Socioeconomic Pathways (SSPs).

The use of the most recent observational datasets and a large Earth System Model ensemble is a major step forward in the projection of future surface ocean OA indicators and provides critical information to guide OA mitigation and adaptation efforts.

Figure X. Temporal changes of global average surface ocean OA indicators as reconstructed and projected from 14 CMIP6 Earth System Models after applying adjustments with observational data: (a) fugacity of carbon dioxide (fCO2), (b) total hydrogen ion content ([H+]total), (c) carbonate ion content ([CO32-]), (d) total dissolved inorganic carbon content (DIC), (e) pH on total scale (pHT), (f) aragonite saturation state (Ωarag), (g) total alkalinity content (TA), (h) Revelle Factor (RF), and (i) calcite saturation state (Ωcalc). The asterisk signs on the left-side y-axes show the values in 1750. The numbers along right-side y-axes, i.e., 1-1.9, 1-2.6, 2-4.5, 3-7.0, and 5-8.5, indicate the shared socioeconomic pathway SSP1-1.9, SSP1-2.6, SSP2-4.5, SSP3-7.0, and SSP5-8.5, respectively. These are missing from panel g because the trajectories were more dependent on the model than the SSP.

Authors
Li-Qing Jiang (University Maryland)
John Dunne (NOAA/Geophysical Fluid Dynamics Laboratory)
Brendan R. Carter (University of Washington)
Jerry F. Tjiputra (NORCE Norwegian Research Centre Bjerknes)
Jens Terhaar (Woods Hole Oceanographic Institution)
Jonathan D. Sharp (University of Washington)
Are Olsen (University of Bergen and Bjerknes Centre for Climate Research)
Simone Alin (NOAA/Pacific Marine Environmental Laboratory)
Dorothee C. E. Bakker (University of East Anglia)
Richard A. Feely (NOAA/Pacific Marine Environmental Laboratory)
Jean-Pierre Gattuso (Sorbonne Université)
Patrick Hogan (NOAA/National Centers for Environmental Information)
Tatiana Ilyina (Max Planck Institute for Meteorology)
Nico Lange (GEOMAR Helmholtz Centre for Ocean Research)
Siv K. Lauvset (NORCE Norwegian Research Centre)
Ernie R. Lewis (Brookhaven National Laboratory)
Tomas Lovato (Fondazione Centro Euro-Mediterraneo sui Cambiamenti Climatici)
Julien Palmieri (National Oceanography Centre)
Yeray Santana-Falcón (Université de Toulouse)
Jörg Schwinger (NORCE Norwegian Research Centre)
Roland Séférian (Université de Toulouse)
Gary Strand (US National Center for Atmospheric Research)
Neil Swart (Canadian Centre for Climate Modelling and Analysis)
Toste Tanhua (GEOMAR Helmholtz Centre for Ocean Research)
Hiroyuki Tsujino (JMA Meteorological Research Institute)
Rik Wanninkhof (NOAA/Atlantic Oceanographic Meteorological Laboratory)
Michio Watanabe (Japan Agency for Marine-Earth Science and Technology)
Akitomo Yamamoto (Japan Agency for Marine-Earth Science and Technology)
Tilo Ziehn (CSIRO Oceans and Atmosphere)

Twitter:
@JiangLiqing, @JensTerhaar, @jpGattuso, @j_d_sharp, @AreOlsen, @SimoneAlin, @Dorothee_Bakker, @RFeely, @ilitat, @sivlauvset, @yeraysf, @TosteTanhua,

Severe warming = 15% increase in bacterial respiration: Southern Ocean most impacted

Posted by mmaheigan 
· Thursday, March 30th, 2023 

The utilization, respiration, and remineralization of organic matter exported from the ocean surface to its depths are key processes in the ocean carbon cycle. Marine heterotrophic Bacteria play a critical role in these activities. However, most three-dimensional (3-D) coupled physical-biogeochemical models do not explicitly include Bacteria as a state variable. Instead, they rely on parameterization to account for the bacteria’s impact on particle flux attenuation.

A recent study examined how bacteria respond to climate change by employing a 3-D coupled ocean biogeochemical model that incorporates explicit bacterial dynamics. The model (CMCC-ESM2) is a part of the Coupled Model Intercomparison Project Phase 6. The authors first evaluated the reliability of century-scale forecasts (2015-2099) for bacterial stocks and rates in the upper 100 m layer against the compiled measurements from the contemporary period (1988-2011). Next the authors analyzed the predicted trends in bacterial stocks and rates under diverse climate scenarios and explored their association with regional differences in temperature and organic carbon stocks. Three crucial findings were revealed. There is a global-scale decrease in bacterial biomass of 5-10%, with a 3-5% increase in the Southern Ocean (Figure 1). In the Southern Ocean, the rise in semi-labile dissolved organic carbon (DOC) leads to an increase in DOC uptake rates of free-living bacteria; in the northern high and low latitudes, the increase in temperature drives the increase in their DOC uptake rates. Importantly, extreme warming could result in a global increase (up to 15%) and even higher in the Southern Ocean (21% increase) in bacterial respiration (Figure 1), potentially leading to a decline in the biological carbon pump.

This analysis is an unprecedented and early effort to understand the climate-induced changes in bacterial dynamics on a global scale in a systematic manner. This study takes us one step closer to comprehending how bacteria influence the functioning of the biological carbon pump and the distribution of organic carbon pools between surface and deep layers, especially their response to climate change.

Figure 1. Global projections of bacterial carbon stocks and rates during the baseline period (1990-2013) and their changes as anomalies under the most-severe climate change scenario (i.e., SSP5-8.5) relative to the baseline period (2076-2099). The stocks and rates during the baseline period (a, b, c, g, h, i) and their changes as anomalies under the most-severe climate change scenario (d, e, f, j, k, l). All variables are depth-integrated in the upper 100 m. Solid-line contours as standard deviation from averaging over 1990-2013. Anomalies are 2076-2099 average values relative to 1990-2013 average values. Global bacterial biomass has decreased by 5-10%, with a 3-5% increase in the Southern Ocean. However, extreme warming may increase bacterial respiration worldwide, thereby reducing the efficiency of the biological carbon pump. This study provides an early attempt to understand the response of bacteria to climate change and their impact on the distribution of organic carbon in the ocean.


Author
Heather Kim, Woods Hole Oceanographic Institution

Drivers of recent Chesapeake Bay warming

Posted by mmaheigan 
· Friday, August 26th, 2022 

Coastal water temperatures have been increasing globally with more frequent marine heat waves threatening marine life and nearshore communities reliant upon these ecosystems. Often, this warming is assumed to be uniform in space and time; however, this is not the case in the Chesapeake Bay, where warming waters play a major role in exacerbating low oxygen levels and indirectly limiting the efficacy of nutrient reduction efforts on land.

New research published in the Journal of the American Water Resources Association combined long-term observations and a hydrodynamic model to quantify the temporal and spatial variability in warming Chesapeake Bay waters, and identify the contributions of different mechanisms driving these historical temperature changes. While winter temperatures have warmed by less than a half a degree over the past 30 years, summer temperatures have warmed by nearly 1.5 °C, with similar increases at the surface and bottom. In cooler months, the atmosphere was the dominant driver of warming throughout the majority of the Bay, but oceanic warming explained more than half of the increased summer temperatures in the southern Bay nearest the Atlantic.

Figure 1: Relative contribution of different factors to warm-month Chesapeake Bay temperature change over the period 1985-2015. Percentages correspond to average main channel contributions for each component.

Warming temperatures have potentially significant implications for the future size of the Chesapeake Bay dead zone, and the marine species directly affected by these low oxygen conditions. Better quantifying warming contributions from the atmosphere, ocean, sea level, and rivers will also help constrain regional temperature projections throughout the estuary. More accurate projections of future Bay temperatures can help coastal managers better understand the potential for invasive species expansion and endemic species loss, impacts to fisheries and aquaculture, and how changes to ecosystem processes may impact coastal communities dependent on a healthy Bay.


Authors:
Kyle E. Hinson (Virginia Institute of Marine Science, William & Mary)
Marjorie A. M. Friedrichs (Virginia Institute of Marine Science, William & Mary)
Pierre St-Laurent (Virginia Institute of Marine Science, William & Mary)
Fei Da (Virginia Institute of Marine Science, William & Mary)
Raymond G. Najjar (The Pennsylvania State University)

Integrated analysis of carbon dioxide and oxygen concentrations as a quality control of ocean float data

Posted by mmaheigan 
· Friday, August 26th, 2022 

A recent study in Communications Earth & Environment, examined spatiotemporal patterns of the two dissolved gases CO2 and O2 in the surface ocean, using the high-quality global dataset GLODAPv2.2020. We used surface ocean data from GLODAP to make plots of carbon dioxide and oxygen relative to saturation (CORS plots). These plots of CO2 deviations from saturation (ΔCO2) against oxygen deviations from saturation (ΔO2) (Figure 1) provide detailed insight into the identity and intensity of biogeochemical processes operating in different basins.

Figure 1: Relationships between ΔCO2 and ΔO2 in the global ocean basins based on surface data in the GLODAPv2.2020 database. The black dashed lines are the least-squares best-fit lines to the data; unc denotes the uncertainty in the y-intercept value with 95% confidence; r is the associated Pearson correlation coefficient; n is the number of data points.

In addition, data in all basins and all seasons shares some common behaviors: (1) negative slopes of best fit lines to the data, and (2) near-zero y-intercepts of those lines. We utilized these findings to compare patterns in CORS plots from GLODAP with those from BGC-Argo float data from the Southern Ocean Carbon and Climate Observations and Modeling (SOCCOM) program. Given that the float O2 data is likely to be more accurate than the float pH data (from which the float CO2 is calculated), CORS plots are useful for detecting questionable float CO2 data, by comparing trends in float CORS plots (e.g. Figure 2) to trends in GLODAP CORS plots (Figure 1). As well as the immediately detected erroneous data, we discovered significant discrepancies in ΔCO2-ΔO2 y-intercepts compared to the global reference (i.e., GLODAPv2.2020 y-intercepts, Figure 1). The y-intercepts of 48 floats with QCed O2 and CO2 data (at regions south of 55°S) were on average greater by 0.36 μmol kg−1 than the GLODAP-derived ones, implying the overestimations of float-based CO2 release in the Southern Ocean.

Figure 2. CORS plots from data collected by SOCCOM floats F9096 and F9099 in the high-latitude Southern Ocean. Circles with solid edges denote data flagged as ‘good’, whereas crosses denote data flagged as ‘questionable’.

Our study demonstrates CORS plots’ ability to identify questionable data (data shown to be questionable by other QC methods) and to reveal issues with supposed ‘good’ data (i.e., quality issues not picked up by other QC methods). CORS plots use only surface data, hence this QC method complements existing methods based on analysis of deep data. As the oceanographic community becomes increasingly reliant on data collected from autonomous platforms, techniques like CORS will help diagnose data quality, and immediately detect questionable data.


Authors:
Yingxu Wu (Polar and Marine Research Institute, Jimei University, Xiamen, China; University of Southampton)
Dorothee C.E. Bakker (University of East Anglia)
Eric P. Achterberg (GEOMAR Helmholtz Centre for Ocean Research Kiel)
Amavi N. Silva (University of Southampton)
Daisy D. Pickup (University of Southampton)
Xiang Li (George Washington University)
Sue Hartman (National Oceanography Centre, Southampton)
David Stappard (University of Southampton)
Di Qi (Polar and Marine Research Institute, Jimei University, Xiamen, China)
Toby Tyrrell (University of Southampton)

How does the competition between phytoplankton and bacteria for iron alter ocean biogeochemical cycles?

Posted by mmaheigan 
· Friday, August 26th, 2022 

Free-living bacteria play a key role in cycling essential biogeochemical resources in the ocean, including iron, via their uptake, transformation, and release of organic matter throughout the water column. Bacteria process half of the ocean’s primary production, remineralize dissolved organic matter, and re-direct otherwise lost organic matter to higher trophic levels. For these reasons, it is crucial to understand what factors limit the growth of bacteria and how bacteria activities impact global ocean biogeochemical cycles.

In a recent study, Pham and colleagues used a global ocean ecosystem model to dive into how iron limits the growth of free-living marine bacteria, how bacteria modulate ocean iron cycling, and the consequences to marine ecosystems of the competition between bacteria and phytoplankton for iron.

Figure 1: (a) Iron limitation status of bacteria in December, January, and February (DJF) in the surface ocean. Low values (in blue color = close to zero) mean that iron is the limiting factor for the growth of bacteria; (b) Bacterial iron consumption in the upper 120m of the ocean and (c) Changes (anomalies) in export carbon production when bacteria have a high requirement for iron.

Through a series of computer simulations performed in the global ocean ecosystem model, the authors found that iron is a limiting factor for bacterial growth in iron-limited regions in the Southern Ocean, the tropical, and the subarctic Pacific due to the high iron requirement and iron uptake capability of bacteria. Bacteria act as an iron sink in the upper ocean due to their significant iron consumption, a rate comparable to phytoplankton. The competition between bacteria and phytoplankton for iron alters phytoplankton bloom dynamics, ocean carbon export, and the availability of dissolved organic carbon needed for bacterial growth. These results suggest that earth system models that omit bacteria ignore an important organism modulating biogeochemical responses of the ocean to future changes.

Authors: 
Anh Le-Duy Pham (Laboratoire d’Océanographie et de Climatologie: Expérimentation et Approches Numériques (LOCEAN), IPSL, CNRS/UPMC/IRD/MNHN, Paris, France)
Olivier Aumont (Laboratoire d’Océanographie et de Climatologie: Expérimentation et Approches Numériques (LOCEAN), IPSL, CNRS/UPMC/IRD/MNHN, Paris, France)
Lavenia Ratnarajah (University of Liverpool, United Kingdom)
Alessandro Tagliabue (University of Liverpool, United Kingdom)

pH: the secrets that you keep

Posted by mmaheigan 
· Monday, September 20th, 2021 

The Intergovernmental Panel on Climate Change (IPCC) defines ocean acidification as “a reduction in pH of the ocean over an extended period, typically decades or longer, caused primarily by the uptake of carbon dioxide (CO2) from the atmosphere” (Rhein et al., 2013, p. 295). Does this mean that a greater change in pH at the ocean surface relative to the subsurface, or at one location relative to another, always indicates greater acidification? Based on this IPCC definition of ocean acidification, the answer is yes. But does that make sense?

Seawater pH is the negative base 10 logarithm of the seawater’s hydrogen ion concentration ([H+]) and is a useful way to display a wide range of [H+] in a compact form. A change in pH reflects a relative change in [H+]. Thus, anytime we speak of pH changes, we are really referring to a relative change in the chemical species of interest ([H+]). On the other hand, changes in all the other carbonate system variables that we measure are usually absolute. This characteristic of pH can lead to ambiguity in the interpretation and presentation of rates and patterns of change. Improved understanding comes from also studying changes in [H+], which can reveal aspects that studying changes in pH alone may conceal or overemphasize.

A recent Biogeosciences article reviewed the history leading to this unintuitive relationship between changes in pH and changes in [H+]. The article provides three real-world examples to display how examining pH changes alone can hide the ocean acidification signals of interest (Figure 1). These examples highlight potential challenges associated with comparing surface and subsurface pH changes across ocean domains without accounting for differences in the initial pH values. The authors recommend reporting both pH and [H+] in studies that assess changes in ocean chemistry to improve the clarity of ocean acidification research.

Figure Caption: Data used in this figure come from the GFDL ESM2M model for the combined historical and RCP8.5 experiments. Top: the 1950s surface ocean (left) pH and (right) [H+]. Bottom: the 1950s to 2090s change (Δ) in surface ocean (left) pH and (right) [H+]. The color bar for ΔpH is reversed to ease comparison with patterns of Δ[H+]

Authors:
Andrea J. Fassbender (NOAA Pacific Marine Environmental Laboratory)
Andrew G. Dickson (Scripps Institution of Oceanography, University of California, San Diego)
James C. Orr (LSCE/IPSL, Laboratoire des Sciences du Climat et de l’Environnement)

Exploiting phytoplankton as a biosensor for nutrient limitation

Posted by mmaheigan 
· Wednesday, September 15th, 2021 

In the surface ocean, phytoplankton growth is often limited by a scarcity of key nutrients such as nitrogen, phosphorus, and iron. While this is important, there are methodological and conceptual difficulties in characterizing these nutrient limitations.

A recent paper published in Science Magazine leveraged a global metagenomic dataset from Bio-GO-SHIP to address these challenges. The authors characterized the abundance of genes that confer adaptations to nutrient limitation within the picocyanobacteria Prochlorococcus. Using the relative abundance of these genes as an indicator of nutrient limitation allowed the authors to capture expected regions of nutrient limitation, and novel regions that had not previously been studied. This gene-derived indicator of nutrient limitation matched previous methods of assessing nutrient limitation, such as bottle incubation experiments.

These findings have important implications for the global ocean. Characterizing the impact of nutrient limitation on primary production is especially critical in light of future stratification driven by climate change. In addition, this novel methodological approach allows scientists to use microbial communities as an eco-genomic biosensor of adaptation to changing nutrient regimes. For instance, future studies of coastal microbes or other ecosystems may help communities and environmental managers better understand how local microbial populations are adapting to climate change.


Watch an illustrated video overview of this research

Authors:
Lucas J. Ustick, Alyse A. Larkin, Catherine A. Garcia, Nathan S. Garcia, Melissa L. Brock, Jenna A. Lee, Nicola A. Wiseman, J. Keith Moore, Adam C. Martiny
(all University of California, Irvine)

How atmospheric and oceanographic forcing impact the carbon sequestration in an ultra-oligotrophic marine system

Posted by mmaheigan 
· Wednesday, August 11th, 2021 

Sinking particles are a critical conduit for the export of material from the surface to the deep ocean. Despite their importance in oceanic carbon cycling, little is known about the composition and seasonal variability of sinking particles which reach abyssal depths. Oligotrophic waters cover ~75% of the ocean surface and contribute over 30% of the global marine carbon fixation. Understanding the processes that control carbon export to the deep oligotrophic areas is crucial to better characterize the strength and efficiency of the biological pump as well as to project the response of these systems to climate fluctuations and anthropogenic perturbations.

In a recent study published in Frontiers in Earth Science, authors synthesized data from atmospheric and oceanographic parameters, together with main mass components, and stable isotope and source-specific lipid biomarker composition of sinking particles collected in the deep Eastern Mediterranean Sea (4285m, Ierapetra Basin) for a three-year period (June 2010-June 2013). In addition, this study compared the sinking particulate flux data with previously reported deep-sea surface sediments from the study area to shed light on the benthic–pelagic coupling.

Figure Caption: a) Biplot of net primary productivity vs export efficiency (top and bottom horizontal dashed lines indicate threshold for high and low export efficiency regimes). b) Biplot of POC-normalized concentrations of terrestrial vs. phytoplankton-derived lipid biomarkers of the sinking particles collected in the deep Eastern Mediterranean Sea (Ierapetra Basin, NW Levantine Basin) from June 2010–June 2013, and surface sediments collected from January 2007 to June 2012 in the study area.

Both seasonal and episodic pulses are crucial for POC export to the deep Eastern Mediterranean Sea. POC fluxes peaked in spring April–May 2012 (12.2 mg m−2 d−1) related with extreme atmospheric forcing. Overall, summer particle export fuels more efficient carbon sequestration than the other seasons. The results of this study highlight that the combination of extreme weather events and aerosol deposition can trigger an influx of both marine labile carbon and anthropogenic compounds to the deep. Finally, the comparison of the sinking particles flux data with surface sediments revealed an isotopic discrimination, as well as a preferential degradation of labile organic matter during deposition and burial, along with higher preservation of land-derived POC in the underlying sediments. This study provides key knowledge to better understand the export, fate and preservation vs. degradation of organic carbon, and for modeling the organic carbon burial rates in the Mediterranean Sea.


Authors:
Rut Pedrosa-Pamies (The Ecosystems Center, Marine Biological Laboratory, US; Research Group in Marine Geosciences, University of Barcelona, Spain)
Constantine Parinos (Institute of Oceanography, Hellenic Centre for Marine Research, Greece)
Anna Sanchez-Vidal (Group in Marine Geosciences, University of Barcelona, Spain)
Antoni Calafat (Group in Marine Geosciences, University of Barcelona, Spain)
Miquel Canals (Group in Marine Geosciences, University of Barcelona, Spain)
Dimitris Velaoras (Institute of Oceanography, Hellenic Centre for Marine Research, Greece)
Nikolaos Mihalopoulos (Environmental Chemical Processes Laboratory, University of Crete; National Observatory of Athens, Greece)
Maria Kanakidou (Environmental Chemical Processes Laboratory, University of Crete Greece)
Nikolaos Lampadariou (Institute of Oceanography, Hellenic Centre for Marine Research, Greece)
Alexandra Gogou (Institute of Oceanography, Hellenic Centre for Marine Research, Greece)

A new proxy for ocean iron bioavailability

Posted by mmaheigan 
· Monday, July 26th, 2021 

In many oceanic regions, iron exerts strong control on phytoplankton growth, ecosystem structure and carbon cycling. Yet, iron bioavailability and uptake rates by phytoplankton in the ocean are poorly constrained.

Recently, Shaked et al. (2020) (see GEOTRACES highlight), established a new approach for quantifying the availability of dissolved Fe (dFe) in natural seawater based on its uptake kinetics by Fe-limited cultured phytoplankton. In a follow up study published in GBC, this approach was extended to in situ phytoplankton, establishing a standardized proxy for dFe bioavailability in low-Fe ocean regions.

As explained in the short video lecture above, Yeala Shaked, Ben Twining, and their colleagues have analyzed large datasets collected during 10 research cruises (including 3 GEOTRACES section and process cruises) in multiple ocean regions. Dissolved Fe bioavailability was estimated through single cell Fe uptake rates, calculated by combining measured Fe contents of individual phytoplankton cells collected with concurrently-measured dFe concentrations, as well as modeled growth rates (Figure). Then the authors applied this proxy for: a) comparing dFe bioavailability among organisms and regions; b) calculating dFe uptake rates and residence times in low-Fe oceanic regions; and c) constraining Fe uptake parameters of earth system models to better predict ocean productivity in response to climate-change.

The data suggest that dFe species are highly available in low-Fe settings, likely due to photochemical reactions in sunlit waters.

Figure 1: The new bioavailability proxy (an uptake rate constant-kin-app) was calculated for ~1000 single cells from multiple ocean regions. For each cell, the iron quota was measured with synchrotron x-ray fluorescence (left panel), a growth rate was estimated from the PISCES model for the corresponding phytoplankton group (right panel), and the dissolved Fe concentration was measured concurrently (middle panel).

Authors:
Y. Shaked (Hebrew University and Interuniversity Institute for Marine Sciences)
B.S. Twining (Bigelow Lab)
A. Tagliabue (University of Liverpool)
M.T. Maldonado (University of British Columbia)
K.N. Buck (University of South Florida)
T. Mellett (University of South Florida)

References:
Shaked, Y., Twining, B. S., Tagliabue, A., & Maldonado, M. T. (2021). Probing the bioavailability of dissolved iron to marine eukaryotic phytoplankton using in situ single cell iron quotas. Global Biogeochemical Cycles, e2021GB006979. https://doi.org/10.1029/2021GB006979

Shaked, Y., Buck, K. N., Mellett, T., & Maldonado, M. T. (2020). Insights into the bioavailability of oceanic dissolved Fe from phytoplankton uptake kinetics. The ISME Journal, 1–12. https://doi.org/10.1038/s41396-020-0597-3


Joint highlight with GEOTRACES – read here.

Next Page »

Filter by Keyword

abundance acidification additionality advection africa air-sea air-sea interactions algae alkalinity allometry ammonium AMO AMOC anoxic Antarctic Antarctica anthro impacts anthropogenic carbon anthropogenic impacts appendicularia aquaculture aquatic continuum aragonite saturation arctic Argo argon arsenic artificial seawater Atlantic atmospheric CO2 atmospheric nitrogen deposition authigenic carbonates autonomous platforms bacteria bathypelagic BATS BCG Argo benthic bgc argo bio-go-ship bio-optical bioavailability biogeochemical cycles biogeochemical models biogeochemistry Biological Essential Ocean Variables biological pump biophysics bloom blue carbon bottom water boundary layer buffer capacity C14 CaCO3 calcification calcite carbon carbon-climate feedback carbon-sulfur coupling carbonate carbonate system carbon budget carbon cycle carbon dioxide carbon export carbon fluxes carbon sequestration carbon storage Caribbean CCA CCS changing marine chemistry changing marine ecosystems changing marine environments changing ocean chemistry chemical oceanographic data chemical speciation chemoautotroph chesapeake bay chl a chlorophyll circulation CO2 coastal and estuarine coastal darkening coastal ocean cobalt Coccolithophores commercial community composition competition conservation cooling effect copepod copepods coral reefs CTD currents cyclone daily cycles data data access data assimilation database data management data product Data standards DCM dead zone decadal trends decomposers decomposition deep convection deep ocean deep sea coral denitrification deoxygenation depth diatoms DIC diel migration diffusion dimethylsulfide dinoflagellate dinoflagellates discrete measurements distribution DOC DOM domoic acid DOP dust DVM ecology economics ecosystem management ecosystems eddy Education EEZ Ekman transport emissions ENSO enzyme equatorial current equatorial regions ESM estuarine and coastal carbon fluxes estuary euphotic zone eutrophication evolution export export fluxes export production extreme events faecal pellets fecal pellets filter feeders filtration rates fire fish Fish carbon fisheries fishing floats fluid dynamics fluorescence food webs forage fish forams freshening freshwater frontal zone functional role future oceans gelatinous zooplankton geochemistry geoengineering geologic time GEOTRACES glaciers gliders global carbon budget global ocean global warming go-ship grazing greenhouse gas greenhouse gases Greenland ground truthing groundwater Gulf of Maine Gulf of Mexico Gulf Stream gyre harmful algal bloom high latitude human food human impact human well-being hurricane hydrogen hydrothermal hypoxia ice age ice cores ice cover industrial onset inland waters in situ inverse circulation ions iron iron fertilization iron limitation isotopes jellies katabatic winds kelvin waves krill kuroshio lab vs field land-ocean continuum larvaceans lateral transport LGM lidar ligands light light attenuation lipids low nutrient machine learning mangroves marine carbon cycle marine heatwave marine particles marine snowfall marshes mCDR mechanisms Mediterranean meltwater mesopelagic mesoscale mesoscale processes metagenome metals methane methods microbes microlayer microorganisms microplankton microscale microzooplankton midwater mitigation mixed layer mixed layers mixing mixotrophs mixotrophy model modeling model validation mode water molecular diffusion MPT MRV multi-decade n2o NAAMES NCP nearshore net community production net primary productivity new ocean state new technology Niskin bottle nitrate nitrogen nitrogen cycle nitrogen fixation nitrous oxide north atlantic north pacific North Sea nuclear war nutricline nutrient budget nutrient cycles nutrient cycling nutrient limitation nutrients OA observations ocean-atmosphere ocean acidification ocean acidification data ocean alkalinity enhancement ocean carbon storage and uptake ocean carbon uptake and storage ocean color ocean modeling ocean observatories ocean warming ODZ oligotrophic omics OMZ open ocean optics organic particles oscillation outwelling overturning circulation oxygen pacific paleoceanography PAR parameter optimization parasite particle flux particles partnerships pCO2 PDO peat pelagic PETM pH phenology phosphate phosphorus photosynthesis physical processes physiology phytoplankton PIC piezophilic piezotolerant plankton POC polar polar regions policy pollutants precipitation predation predator-prey prediction pressure primary productivity Prochlorococcus productivity prokaryotes proteins pteropods pycnocline radioisotopes remineralization remote sensing repeat hydrography residence time resource management respiration resuspension rivers rocky shore Rossby waves Ross Sea ROV salinity salt marsh satellite scale seafloor seagrass sea ice sea level rise seasonal seasonality seasonal patterns seasonal trends sea spray seawater collection seaweed secchi sediments sensors sequestration shelf ocean shelf system shells ship-based observations shorelines siderophore silica silicate silicon cycle sinking sinking particles size SOCCOM soil carbon southern ocean south pacific spatial covariations speciation SST state estimation stoichiometry subduction submesoscale subpolar subtropical sulfate surf surface surface ocean Synechococcus technology teleconnections temperate temperature temporal covariations thermocline thermodynamics thermohaline thorium tidal time-series time of emergence titration top predators total alkalinity trace elements trace metals trait-based transfer efficiency transient features trawling Tris trophic transfer tropical turbulence twilight zone upper ocean upper water column upwelling US CLIVAR validation velocity gradient ventilation vertical flux vertical migration vertical transport warming water clarity water mass water quality waves weathering western boundary currents wetlands winter mixing zooplankton

Copyright © 2025 - OCB Project Office, Woods Hole Oceanographic Institution, 266 Woods Hole Rd, MS #25, Woods Hole, MA 02543 USA Phone: 508-289-2838  •  Fax: 508-457-2193  •  Email: ocb_news@us-ocb.org

link to nsflink to noaalink to WHOI

Funding for the Ocean Carbon & Biogeochemistry Project Office is provided by the National Science Foundation (NSF) and the National Aeronautics and Space Administration (NASA). The OCB Project Office is housed at the Woods Hole Oceanographic Institution.