Ocean Carbon & Biogeochemistry
Studying marine ecosystems and biogeochemical cycles in the face of environmental change
  • Home
  • About OCB
    • About Us
    • Scientific Breadth
      • Biological Pump
      • Changing Marine Ecosystems
      • Changing Ocean Chemistry
      • Estuarine and Coastal Carbon Fluxes
      • Ocean Carbon Uptake and Storage
      • Ocean Observatories
    • Code of Conduct
    • Get Involved
    • Project Office
    • Scientific Steering Committee
    • OCB committees
      • Ocean-Atmosphere Interaction
      • Ocean Time-series
      • US Biogeochemical-Argo
  • Activities
    • Summer Workshop
    • OCB Webinars
    • Guidelines for OCB Workshops & Activities
    • Topical Workshops
      • CMIP6 Models Workshop
      • Coastal BGS Obs with Fisheries
      • C-saw extreme events workshop
      • Expansion of BGC-Argo and Profiling Floats
      • Fish, fisheries and carbon
      • Future BioGeoSCAPES program
      • GO-BCG Scoping Workshop
      • Lateral Carbon Flux in Tidal Wetlands
      • Leaky Deltas Workshop – Spring 2025
      • Marine CDR Workshop
      • Ocean Nucleic Acids ‘Omics
      • Pathways Connecting Climate Changes to the Deep Ocean
    • Small Group Activities
      • Aquatic Continuum OCB-NACP Focus Group
      • Arctic-COLORS Data Synthesis
      • BECS Benthic Ecosystem and Carbon Synthesis WG
      • Carbon Isotopes in the Ocean Workshop
      • CMIP6 WG
      • Filling the gaps air–sea carbon fluxes WG
      • Fish Carbon WG
      • Meta-eukomics WG
      • mCDR
      • Metaproteomic Intercomparison
      • Mixotrophs & Mixotrophy WG
      • N-Fixation WG
      • Ocean Carbonate System Intercomparison Forum
      • Ocean Carbon Uptake WG
      • OOI BGC sensor WG
      • Operational Phytoplankton Observations WG
      • Phytoplankton Taxonomy WG
    • Other Workshops
    • Science Planning
      • Coastal CARbon Synthesis (CCARS)
      • North Atlantic-Arctic
    • Ocean Acidification PI Meetings
    • Training Activities
      • PACE Hackweek 2025
      • PACE Hackweek 2024
      • PACE Training Activity 2022
  • Science Support
    • Data management and archival
    • Early Career
    • Funding Sources
    • Jobs & Postdocs
    • Meeting List
    • OCB Topical Websites
      • Ocean Fertilization
      • Trace gases
      • US IIOE-2
    • Outreach & Education
    • Promoting your science
    • Student Opportunities
    • OCB Activity Proposal Solicitations
      • Guidelines for OCB Workshops & Activities
    • Travel Support
  • Publications
    • OCB Workshop Reports
    • Science Planning and Policy
    • Newsletter Archive
  • Science Highlights
  • News

Archive for New OCB Research – Page 12

Water clarity impacts temperature and biogeochemistry in Chesapeake Bay

Posted by mmaheigan 
· Thursday, December 3rd, 2020 

Estuarine water clarity is determined by suspended materials in the water, including colored dissolved organic matter, phytoplankton, sediment, and detritus. These constituents directly affect temperature because when water is opaque, sunlight heats only the shallowest layers near the surface, but when water is clear, sunlight can penetrate deeper, warming the waters below the surface. Despite the importance of accurately predicting temperature variability, many numerical modeling studies do not adequately parameterize this fundamental relationship between water clarity and temperature.

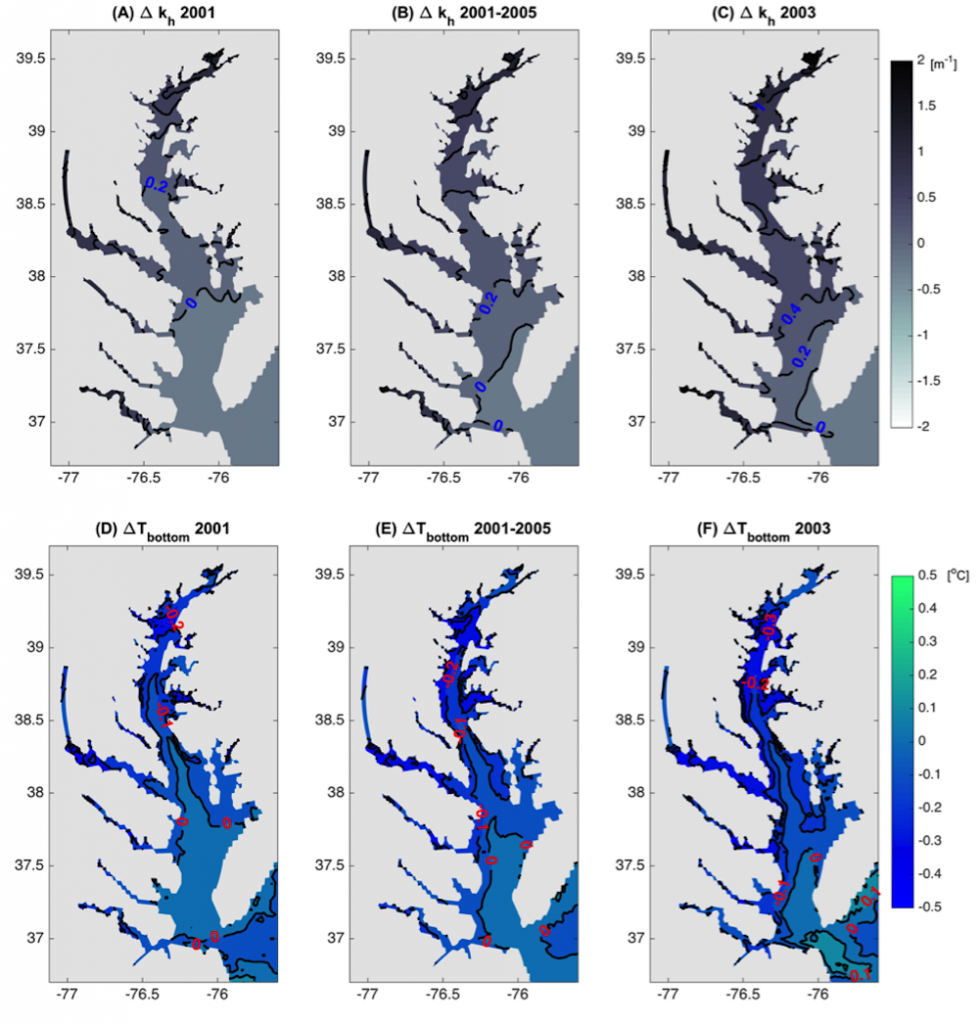
In a recent study published in Estuaries and Coasts, the authors quantified the impact of a more realistic representation of water clarity in a hydrodynamic-biogeochemical model of the Chesapeake Bay by comparing two simulations: (1) water clarity is constant in space and time for the calculation of solar heating vs. (2) water clarity varies with modeled concentrations of light-attenuating materials. In the variable water clarity simulation (2), the water is more opaque, particularly in the northern region of the Bay. During the spring and summer months, the lower water clarity in the northern Bay is associated with warmer surface temperatures and colder bottom temperatures. Warmer surface temperatures encourage phytoplankton growth and nutrient uptake near the head of the Bay, thus fewer nutrients are transported downstream. These conditions are exacerbated during high-river flow years, when differences in temperature, nutrients, phytoplankton, and zooplankton extend further seaward.

Figure 1: Top row: Difference in the light attenuation coefficient for shortwave heating, kh[m-1] (variable minus constant light attenuation simulation). June, July, and August average for (A) 2001, (B) average of 2001-2005, and (C) 2003; difference in bottom temperatures [oC] (variable minus constant). Bottom row: Difference in June, July, and August average bottom temperature for (D) 2001, (E) average of 2001-2005, and (F) 2003. Data for 2001 are representative of low river discharge, and 2003 are representative high river discharge years.

This work demonstrates that a constant light attenuation scheme for heating calculations in coupled hydrodynamic-biogeochemical models underestimates temperature variability, both temporally and spatially. This is an important finding for researchers who use models to predict future temperature variability and associated impacts on biogeochemistry and species habitability.


Authors:
Grace E. Kim (NASA, Goddard Space Flight Center)
Pierre St-Laurent (VIMS, William & Mary)
Marjorie A.M. Friedrichs (VIMS, William & Mary)
Antonio Mannino (NASA, Goddard Space Flight Center)

Tiny phytoplankton seen from space

Posted by mmaheigan 
· Thursday, November 19th, 2020 

Picophytoplankton, the smallest phytoplankton on Earth, are dominant in over half of the global surface ocean, growing in low-nutrient “ocean deserts” where diatoms and other large phytoplankton have difficult to thrive. Despite their small size, picophytoplankton collectively account for well over 50% of primary production in oligotrophic waters, thus playing a major role in sustaining marine food webs.

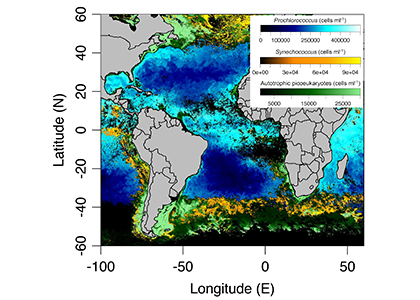
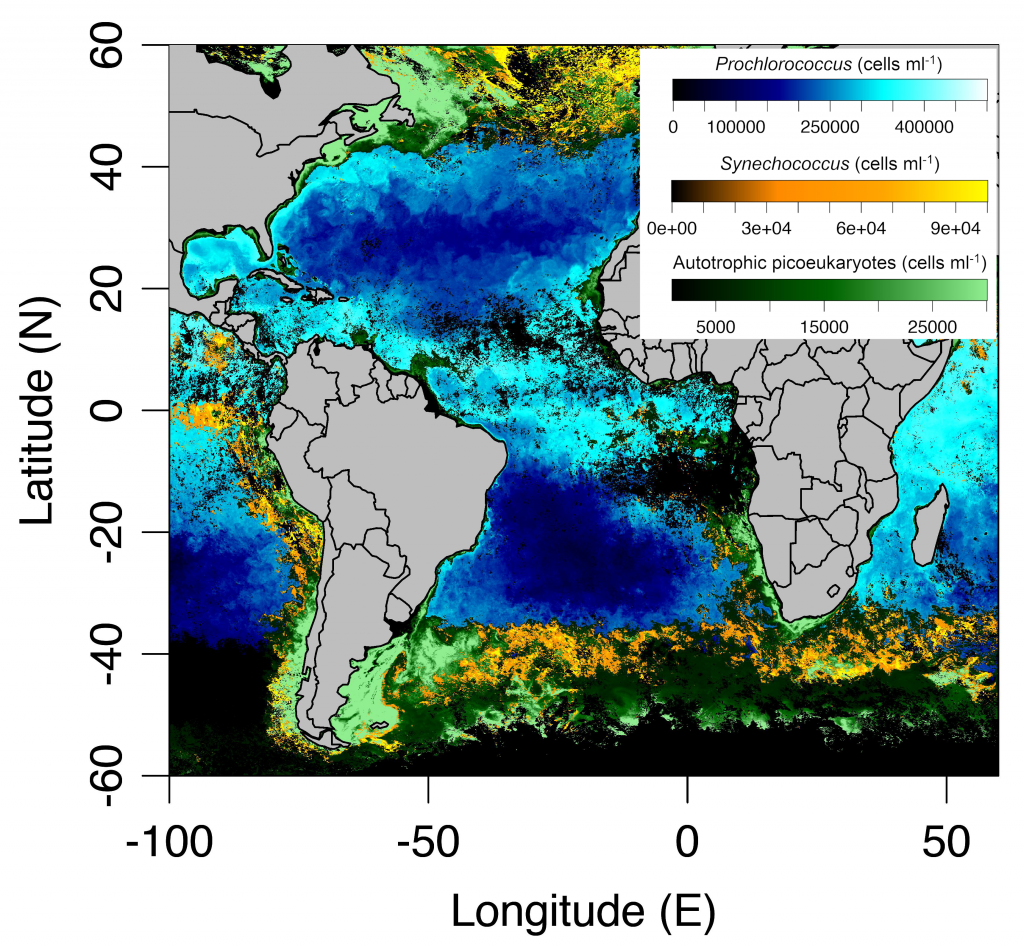
In a recent paper published in Optics Express, the authors use satellite-detected ocean color (namely remote-sensing reflectance, Rrs(λ)) and sea surface temperature to estimate the abundance of the three picophytoplankton groups—the cyanobacteria Prochlorococcus and Synechococcus, and autotrophic picoeukaryotes. The authors analysed Rrs(λ) spectra using principal component analysis, and principal component scores and SST were used in the predictive models. Then, they trained and independently evaluated the models with in-situ data from the Atlantic Ocean (Atlantic Meridional Transect cruises). This approach allows for the satellite detection of the succession of species across ocean oligotrophic ecosystem boundaries, where these cells are most abundant (Figure 1).

Figure 1. Cell abundances of the three major picophytoplankton groups (the cyanobacteria Prochlorococcus and Synechococcus, and a collective group of autotrophic picoeukaryotes) in surface waters of the Atlantic Ocean. Abundances are shown for the dominant group in terms of total biovolume (converted from cell abundance).

Since these organisms can be used as proxies for marine ecosystem boundaries, this method can be used in studies of climate and ecosystem change, as it allows a synoptic observation of changes in picophytoplankton distributions over time and space. For exploring spectral features in hyperspectral Rrs(λ) data, the implementation of this model using data from future hyperspectral satellite instruments such as NASA PACE’s Ocean Color Instrument (OCI) will extend our knowledge about the distribution of these ecologically relevant phytoplankton taxa. These observations are crucial for broad comprehension of the effects of climate change in the expansion or shifts in ocean ecosystems.


Authors:
Priscila K. Lange (NASA Goddard Space Flight Center / Universities Space Research Association / Blue Marble Space Institute of Science)
Jeremy Werdell (NASA Goddard Space Flight Center)
Zachary K. Erickson (NASA Goddard Space Flight Center)
Giorgio Dall’Olmo (Plymouth Marine Laboratory)
Robert J. W. Brewin (University of Exeter)
Mikhail V. Zubkov (Scottish Association for Marine Science)
Glen A. Tarran (Plymouth Marine Laboratory)
Heather A. Bouman (University of Oxford)
Wayne H. Slade (Sequoia Scientific, Inc)
Susanne E. Craig (NASA Goddard Space Flight Center / Universities Space Research Association)
Nicole J. Poulton (Bigelow Laboratory for Ocean Sciences)
Astrid Bracher (Alfred-Wegener-Institute Helmholtz Center for Polar and Marine Research / University of Bremen)
Michael W. Lomas (Bigelow Laboratory for Ocean Sciences)
Ivona Cetinić (NASA Goddard Space Flight Center / Universities Space Research Association)


A new Regional Earth System Model of the Mediterranean Sea biogeochemical dynamics

Posted by mmaheigan 
· Thursday, November 19th, 2020 

The Mediterranean Sea is a semi-enclosed mid-latitude oligotrophic basin with a lower net primary production than the global ocean. A west-east productivity trophic gradient results from the superposition of biogeochemical and physical processes, including the biological pump and associated carbon and nutrient (nitrogen, phosphorus) fluxes, the spatial asymmetric distribution of nutrient sources (rivers, atmospheric deposition, coastal upwelling, etc.), the estuarine inverse circulation associated with the inflow of Atlantic water through the Gibraltar Strait. The complex and highly variable interface between land and sea throughout this basin add a further layer of complexity in the Mediterranean oceanic and atmospheric circulation and on the associated biogeochemistry dynamics, emphasizing the need for high-resolution truly integrated Regional Earth System Models to track and understand fine-scale processes and ecosystem dynamics.

In a recent paper published in the Journal of Advances in Modeling Earth System, the authors introduced a new version of the Regional Earth System model RegCM-ES and evaluated its performance in the Mediterranean region. RegCM-ES fully integrates the regional climate model RegCM4, the land surface scheme CLM4.5 (Community Land Model), the river routing model HD (Hydrological Discharge Model), the ocean model MITgcm (MIT General Circulation model) and the Biogeochemical Flux Model BFM.

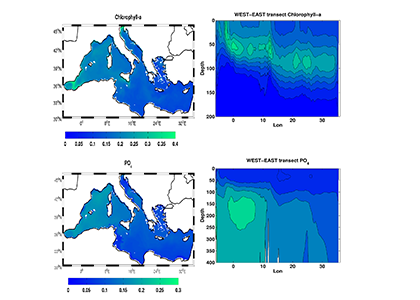
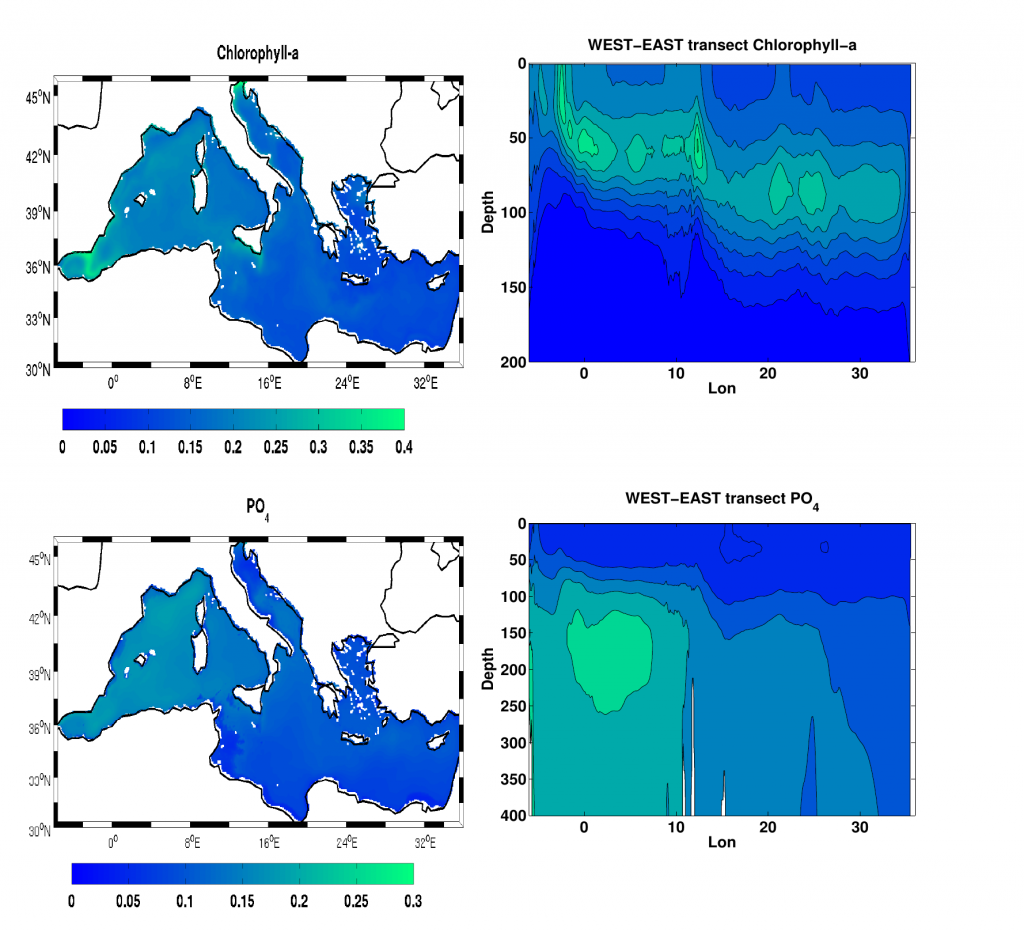
A comparison with available observations has shown that RegCM-ES was able to capture the mean climate of the region and to reproduce horizontal and vertical patterns of chlorophyll-a and PO4 (the limiting nutrient in the basin) (Figure 1). The same comparison revealed a systematic underestimation of simulated dissolved oxygen (which will be fixed by the use of a new parametrization of oxygen solubility), and an overestimation of NO3, possibly due to uncertainties in initial and boundary conditions (mostly traced to river and Dardanelles nutrient discharges) and an overly vigorous vertical mixing simulated by the ocean model in some parts of the Basin.

Figure.1 Distributions of chlorophyll-a mg/m3 (top) and PO4 mmol/m3 (bottom) in the Mediterranean Sea as simulated by RegCM-ES.

Overall, this analysis has demonstrated that RegCM-ES has the capabilities required to become a powerful tool for studying regional dynamics and impacts of climate change on the Mediterranean Sea and other ocean basins around the world.


Authors:
Marco Reale (Abdus Salam International Centre for theoretical physics-ICTP, National Institute of Oceanography and Experimental Geophysics-OGS)
Filippo Giorgi (Abdus Salam International Centre for theoretical physics-ICTP)
Cosimo Solidoro (National Institute of Oceanography and Experimental Geophysics-OGS)
Valeria Di Biagio (National Institute of Oceanography and Experimental Geophysics-OGS)
Fabio Di Sante (Abdus Salam International Centre for theoretical physics-ICTP)
Laura Mariotti (National Institute of Oceanography and Experimental Geophysics-OGS)
Riccardo Farneti (Abdus Salam International Centre for theoretical physics-ICTP)
Gianmaria Sannino (Italian National Agency for New Technologies, Energy and Sustainable Economic Development-ENEA)

Warming counteracts acidification in temperate crustose coralline algae communities

Posted by mmaheigan 
· Friday, November 6th, 2020 

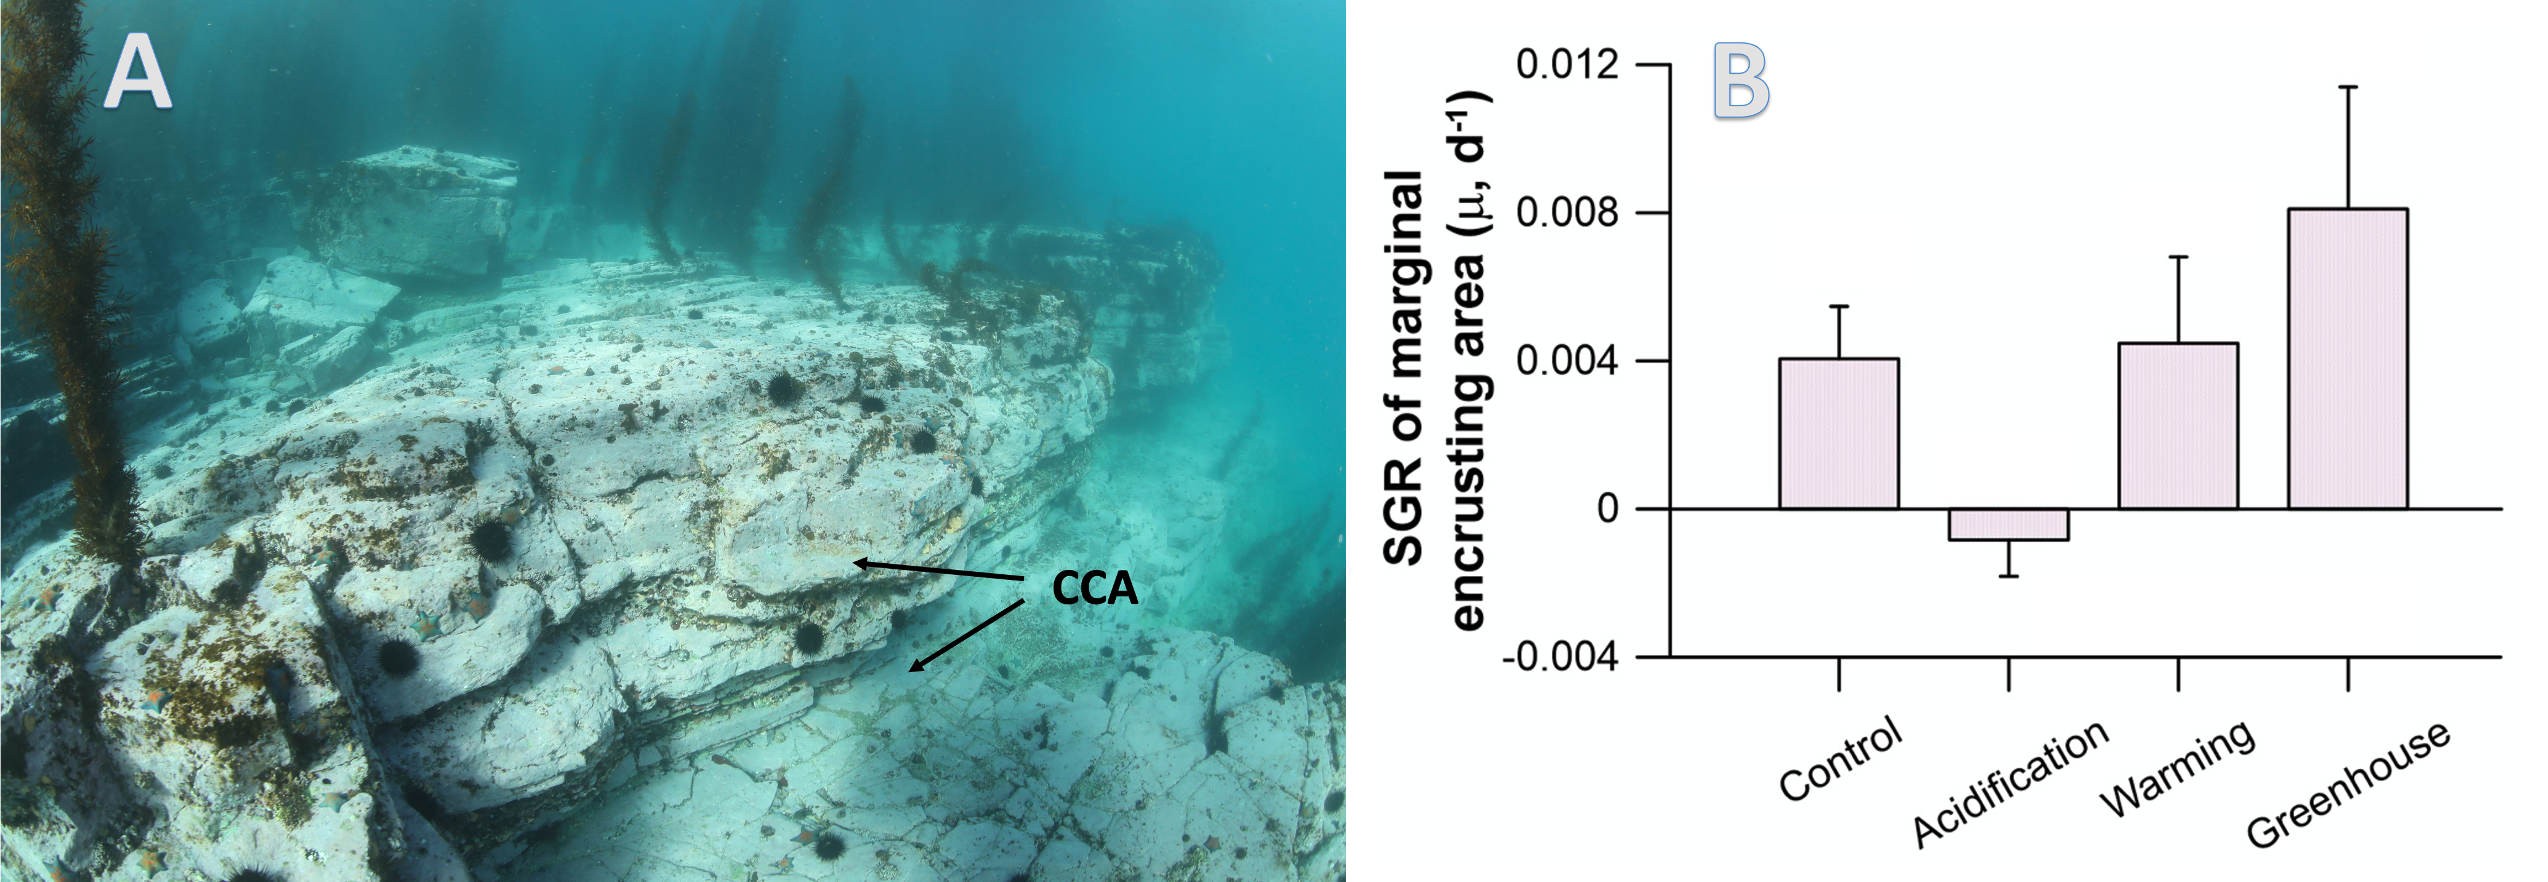
Seawater carbonate chemistry has been altered by dramatic increases in anthropogenic CO2 release and global temperatures, leading to significant changes in rocky shore habitats and the metabolism of most marine organisms. There has been recent interest in how these anthropogenic stresses affect crustose coralline algae (CCA) communities because CCA photosynthesis and calcification are directly influenced by seawater carbonate chemistry. CCA is a foundation species in temperate macroalgal communities, where species succession and rocky shore community structure are particularly susceptible to anthropogenic disturbance. In particular, the disappearance of turf and foliose macroalgae caused by climate change and herbivore pressure results in the dominance of CCA (Figure 1a).

Figure 1: (a) Examples of crustose coralline algae (CCA)-dominated seaweed bed in the East Sea of Korea showing barren ground dominated by CCA (bright white and pink color on the rock; see arrows) on a rocky subtidal zone grazed by sea urchins. (b) Specific growth rate of marginal encrusting area under future climate conditions.

In a recent study published in Marine Pollution Bulletin, the authors conducted a mesocosm experiment to investigate the sensitivity of temperate CCA Chamberlainium sp. to future climate stressors, as simulated by three experimental treatments: 1) Acidification: doubled CO2; 2) Warming: +5ºC; and 3) Greenhouse: doubled CO2 and +5ºC. After a 47-day acclimation period, when compared with present-day (control: 490 μatm and 20ºC) conditions, the Acidification treatment showed decreased photosynthesis rates of Chamberlainium sp, whereas the Warming treatment showed increased photosynthesis. The Acidification treatment also showed reduced encrusting growth rates relative to the Control, but when acidification was combined with warming in the Greenhouse treatment, encrusting growth rates increased substantially (Figure 1b). Taken together, these results suggest that the negative ecophysiological responses of Chamberlainium sp to acidification are ameliorated by elevated temperatures in a greenhouse world. In other words, if the foliose macroalgal community responses negatively in the greenhouse environment, the dominance of CCA will increase further, and the biodiversity of the algae community will be reduced.


Authors:
Ju-Hyoung Kim (Faculty of Marine Applied Biosciences, Kunsan National University)
Il-Nam Kim (Department of Marine Science, Incheon National University)

Timing matters: Correcting float-based measurements of diurnal oxygen variability

Posted by mmaheigan 
· Friday, November 6th, 2020 

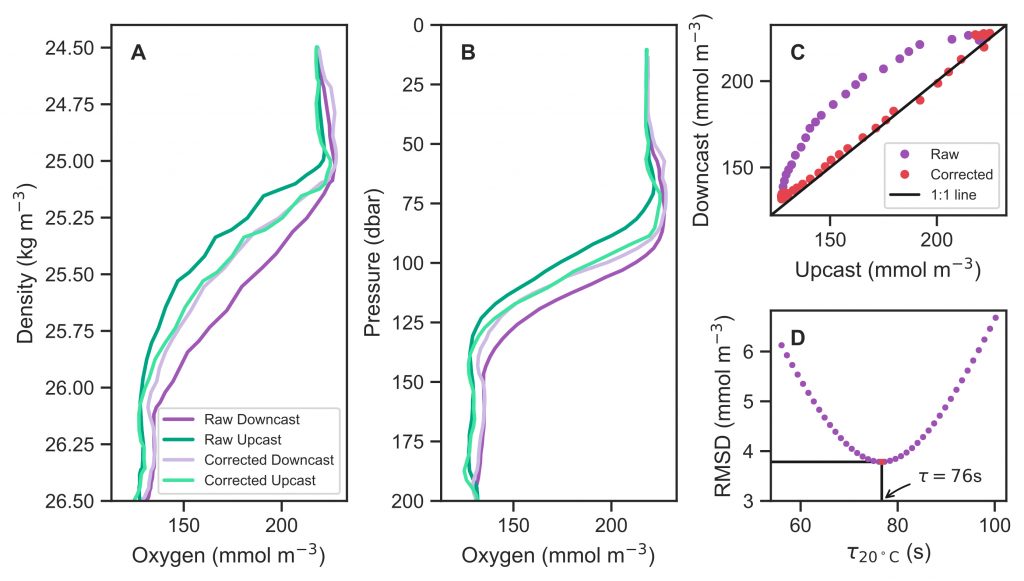
Despite its fundamental importance to the global carbon cycle, climate, and marine ecosystems, oceanic primary production is grossly under-sampled. Autonomous platforms represent an important frontier for expanding measurements of marine primary productivity in time and space, but this requires the establishment of robust, standardized methods to obtain reliable data from these platforms. Using data from profiling floats deployed in the northern Gulf of Mexico, authors of a recent study published in Biogeosciences demonstrated, for the first time, that daily cycles of dissolved oxygen can be observed with Argo-type profiling floats. The floats were instructed to profile continuously, resulting in about one profile every three hours. The floats recorded data both on the ascent (upcast) and the descent (downcast). Adjacent casts showed hysteresis in gradient areas, i.e. a lag in the concentration measurement, due to the slow response time of oxygen sensors.

Figure 1: Example of raw oxygen measurements from a downcast (dark purple line) and an upcast (dark green line) and corrected profiles (lighter purple and green lines) in (a) density and (b) pressure coordinates. (c) Upcasts and downcasts (top 150 m) plotted against each other with raw data (purple) and data corrected according to the new method (red). (d) The root-mean-square difference (RMSD) between the upcast and downcast after correcting casts for a range of time constants (τ), showing an optimal τ value in this case of 76 s (red dot).

To correct for these measurement errors, the authors developed a method to determine sensor response time in situ, using an established process for correcting sensor response time errors. This method requires a timestamp associated with each observation. The response time parameter (τ) was determined by correcting consecutive profiles taken in opposite directions using a range of possible values and finding the minimum root-mean-square-difference between them (Figure 1). In light of these findings, future oxygen measurements from Argo floats should be transmitted with time stamps for a calibration period during which up- and downcasts are recorded to facilitate response time correction. The method developed here will contribute to more accurate measurement of dissolved oxygen, thus improving the quality of derived quantities such as primary productivity.


Authors
Christopher Gordon (Dalhousie University)
Katja Fennel (Dalhousie University)
Clark Richards (Fisheries and Oceans Canada)
Nick Shay (University of Miami)
Jodi Brewster (University of Miami)

Austral summer vertical migration patterns in Antarctic zooplankton

Posted by mmaheigan 
· Thursday, October 15th, 2020 

Sunrise and sunset are the main cues driving zooplankton diel vertical migration (DVM) throughout the world’s oceans. These marine animals balance the trade-off between feeding in surface waters at night and avoiding predation during the day at depth. Near-constant daylight during polar summer was assumed to dampen these daily migrations. In a recent paper published in Deep-Sea Research I, authors assessed austral summer DVM patterns for 15 taxa over a 9-year period. Despite up to 22 hours of sunlight, a diverse array of zooplankton – including copepods, krill, pteropods, and salps – continued DVM.

Figure caption: Mean day (orange) and night (blue) abundance of (A) the salp Salpa thompsoni, (B) the krill species Thysanoessa macrura, (C) the pteropod Limacina helicina, and (D) chaetognaths sampled at discrete depth intervals from 0-500m. Horizontal dashed lines indicate weighted mean depth (WMD). N:D is the night to day abundance ratio for 0-150 m. Error bars indicate one standard error. Sample size n = 12 to 22. Photos by Larry Madin, Miram Gleiber, and Kharis Schrage.

The Palmer Antarctica Long-Term Ecological Research (LTER) Program conducted this study using a MOCNESS (Multiple Opening/Closing Net and Environmental Sensing System) to collect depth-stratified samples west of the Antarctic Peninsula. The depth range of migrations during austral summer varied across taxa and with daylength and phytoplankton biomass and distribution. While most taxa continued some form of DVM, others (e.g., carnivores and detritivores) remained most abundant in the mesopelagic zone, regardless of photoperiod, which likely impacted the attenuation of vertical carbon flux. Given the observed differences in vertical distribution and migration behavior across taxa, ongoing changes in Antarctic zooplankton assemblages will likely impact carbon export pathways. More regional, taxon-specific studies such as this are needed to inform efforts to model zooplankton contributions to the biological carbon pump.


Authors:
John Conroy (VIMS, William & Mary)
Deborah Steinberg (VIMS, William & Mary)
Patricia Thibodeau (VIMS, William & Mary; currently University of Rhode Island)
Oscar Schofield (Rutgers University)

Marine heatwave implications for future phytoplankton blooms

Posted by mmaheigan 
· Thursday, October 15th, 2020 

Ocean temperature extreme events such as marine heatwaves are expected to intensify in coming decades due to anthropogenic warming. Although the effects of marine heatwaves on large plants and animals are becoming well documented, little is known about how these warming events will impact microbes that regulate key biogeochemical processes such as ocean carbon uptake and export, which represent important feedbacks on the global carbon cycle and climate.

Figure caption: Relationship between phytoplankton bloom response to marine heatwaves and background nitrate concentration in the 23 study regions. X-axis denotes the annual-mean sea-surface nitrate concentration based on the model simulation (1992-2014; OFAM3, blue) and the in situ climatology (WOA13, orange). Y-axis denotes the mean standardised anomalies (see Equation 1 of the paper) of simulated sea-surface phytoplankton nitrogen biomass (1992-2014; OFAM3, blue) and observed sea-surface chlorophyll a concentration (2002-2018; MODIS, orange) during the co-occurrence of phytoplankton blooms and marine heatwaves.

In a recent study published in Global Change Biology, authors combined model simulations and satellite observations in tropical and temperate oceanographic regions over recent decades to characterize marine heatwave impacts on phytoplankton blooms. The results reveal regionally‐coherent anomalies depicted by shallower surface mixed layers and lower surface nitrate concentrations during marine heatwaves, which counteract known light and nutrient limitation effects on phytoplankton growth, respectively (Figure 1). Consequently, phytoplankton bloom responses are mixed, but derive from the background nutrient conditions of a study region such that blooms are weaker (stronger) during marine heatwaves in nutrient-poor (nutrient-rich) waters.

Given the projected expansion of nutrient-poor waters in the 21st century ocean, the coming decades are likely to see an increased occurrence of weaker blooms during marine heatwaves, with implications for higher trophic levels and biogeochemical cycling of key elements.

Authors:
Hakase Hayashida (University of Tasmania)
Richard Matear (CSIRO)
Pete Strutton (University of Tasmania)

Chesapeake Bay acidification partially offset by submerged aquatic vegetation

Posted by mmaheigan 
· Wednesday, September 30th, 2020 

Ocean acidification is often enhanced by eutrophication and subsequent hypoxia and anoxia in coastal waters, which collectively threaten marine organisms and ecosystems. Acidification is particularly of concern for organisms that form shells and skeletons from calcium carbonate (CaCO3) such as commercially important shellfish species. Given that CaCO3 mineral dissolution can increase the total alkalinity of water and neutralize anthropogenic and metabolic CO2, it is important to include CaCO3 cycle in the coastal water acidification study.  However, very few studies have linked CaCO3 dissolution to the timing and location of its formation in coastal waters. A recent study from the Chesapeake Bay published in Nature Geoscience reveals the occurrence of a bay-wide pH-buffering mechanism resulting from spatially decoupled CaCO3 mineral cycling (Figure 1). Photosynthesis by submerged aquatic vegetation at the head of the Bay and in other shallow, nearshore waters can remove nutrient pollution from the Bay, generate very high pH, and elevate the carbonate mineral saturation state (Figure 1). This facilitates the formation of CaCO3 minerals, which are then transported downstream along with other biologically produced carbonate shells into acidic subsurface waters, where they dissolve. This dissolution of carbonate minerals helps “buffer” the water against pH decreases and even drive pH increases. This finding has great ecological and natural resource management significance, in that coastal nutrient management and reduction via the resurgence of submerged aquatic vegetation can help mitigate low oxygen and acidification stress for these environments and organisms.

Figure 1: Conceptual model of the self-regulated pH-buffering mechanism in the Chesapeake Bay. Calcium carbonate is formed within the high-pH submerged aquatic vegetation beds in shallow waters (top left and upper part of diagram, all Shoals with SAV), where it could be subsequently transported longitudinally and/or laterally into the deep main channel of the mid and lower bay (center) and upon dissolution, increase pH buffering capacity and alleviate coastal acidification (lower section).


Authors:
Jianzhong Su (University of Delaware, Xiamen University)
Wei-Jun Cai (University of Delaware)
Jean Brodeur (University of Delaware)
Baoshan Chen (University of Delaware)
Najid Hussain (University of Delaware)
Yichen Yao (University of Delaware)
Chaoying Ni (University of Delaware)
Jeremy Testa (University of Maryland Center for Environmental Science)
Ming Li (University of Maryland Center for Environmental Science)
Xiaohui Xie (University of Maryland Center for Environmental Science, Second Institute of Oceanography)
Wenfei Ni (University of Maryland Center for Environmental Science)
K. Michael Scaboo (University of Delaware)
Yuanyuan Xu (University of Delaware)
Jeffrey Cornwell (University of Maryland Center for Environmental Science)
Cassie Gurbisz (St. Mary’s College of Maryland)
Michael S. Owens (University of Maryland Center for Environmental Science)
George G. Waldbusser (Oregon State University)
Minhan Dai (Xiamen University)
W. Michael Kemp (University of Maryland Center for Environmental Science)

Will global change “stress out” ocean DOC cycling?

Posted by mmaheigan 
· Tuesday, September 29th, 2020 

The dissolved organic carbon (DOC) pool is vital for the functioning of marine ecosystems. DOC fuels marine food webs and is a cornerstone of the earth’s carbon cycle. As one of the largest pools of organic matter on the planet, disruptions to marine DOC cycling driven by climate and environmental global changes can impact air-sea CO2 exchange, with the added potential for feedbacks on Earth’s climate system.

Figure 1. Simplified view of major dissolved organic carbon (DOC) sources (black text) and sinks (yellow text) in the ocean.

Since DOC cycling involves multiple processes acting concurrently over a range of time and space scales, it is especially challenging to characterize and quantify the influence of global change. In a recent review paper published in Frontiers in Marine Science, the authors synthesize impacts of global change-related stressors on DOC cycling such as ocean warming, stratification, acidification, deoxygenation, glacial and sea ice melting, inflow from rivers, ocean circulation and upwelling, and atmospheric deposition. While ocean warming and acidification are projected to stimulate DOC production and degradation, in most regions, the outcomes for other key climate stressors are less clear, with much more regional variation. This synthesis helps advance our understanding of how global change will affect the DOC pool in the future ocean, but also highlights important research gaps that need to be explored. These gaps include for example a need for studies that allow to understand the adaptation of degradation/production pathways to global change stressors, and their cumulative impacts (e.g. temperature with acidification).


Authors:
C. Lønborg (Aarhus University)
C. Carreira (CESAM, Universidade de Aveiro)
Tim Jickells (University of East Anglia)
X.A. Álvarez-Salgado (CSIC, Instituto de Investigacións Mariñas)

Sea ice loss and the changing Arctic carbon cycle

Posted by mmaheigan 
· Friday, September 18th, 2020 

Loss of Arctic Ocean ice cover is altering the carbon cycle in ways that are not well understood. Effectively “popping the top off” the Arctic Ocean, ice loss exposes the sea surface to warming and exchange of CO2 with the atmosphere. These processes are expected to increase CO2 levels in the Arctic Ocean, changing its contribution to the global carbon cycle, but limited data collection in the region has thus far precluded the establishment of a clear relationship between CO2 and ice cover. In a recent study published in Geophysical Research Letters, authors report on observed partial pressure of CO2 (pCO2) trends from several years of data collection in the surface waters of the Canada Basin of the Arctic Ocean. These data show that the pCO2 is higher during years when ice cover is low. Uptake of atmospheric CO2 and heating are the primary sources of the CO2 increase, with only a small counteracting offset from biological production. These processes vary significantly from year to year, masking the likely increase in pCO2 over time. Based on these results, we can expect that, while the Arctic Ocean has thus far been a significant sink for atmospheric CO2, if ice loss continues the uptake of CO2 will diminish in coming years.

Figure caption: Sea surface pCO2 increases with decreasing ice concentration (left), determined using the mean of spatially gridded data. The sea surface pCO2 data were collected on five research cruises on the Canadian icebreaker, CCGS Louis S. St-Laurent, from 2012 to 2017 (shown at right for 2017). The pCO2 levels are indicated by the color along the ship cruise track (right color bar). The dark shading (left color bar) represents sea ice concentration averaged from the daily satellite data collected during the cruise.

Authors:
Michael DeGrandpre (University of Montana-Missoula)
Wiley Evans (Hakai Institute)
Mary-Louise Timmermans (Yale University)
Richard Krishfield (Woods Hole Oceanographic Institution)
Bill Williams (Institute of Ocean Sciences)
Michael Steele (University of Washington)

« Previous Page
Next Page »

Filter by Keyword

abundance acidification additionality advection africa air-sea air-sea interactions algae alkalinity allometry ammonium AMO AMOC anoxic Antarctic Antarctica anthro impacts anthropogenic carbon anthropogenic impacts appendicularia aquaculture aquatic continuum aragonite saturation arctic Argo argon arsenic artificial seawater AT Atlantic atmospheric CO2 atmospheric nitrogen deposition authigenic carbonates autonomous platforms AUVs bacteria bathypelagic BATS BCG Argo benthic bgc argo bio-go-ship bio-optical bioavailability biogeochemical cycles biogeochemical models biogeochemistry Biological Essential Ocean Variables biological pump biophysics bloom blue carbon bottom water boundary layer buffer capacity C14 CaCO3 calcification calcite carbon carbon-climate feedback carbon-sulfur coupling carbonate carbonate system carbon budget carbon cycle carbon dioxide carbon export carbon fluxes carbon sequestration carbon storage Caribbean CCA CCS changing marine chemistry changing marine ecosystems changing marine environments changing ocean chemistry chemical oceanographic data chemical speciation chemoautotroph chesapeake bay chl a chlorophyll circulation clouds CO2 CO3 coastal and estuarine coastal darkening coastal ocean cobalt Coccolithophores commercial community composition competition conservation cooling effect copepod copepods coral reefs CTD currents cyclone daily cycles data data access data assimilation database data management data product Data standards DCM dead zone decadal trends decomposers decomposition deep convection deep ocean deep sea coral denitrification deoxygenation depth diatoms DIC diel migration diffusion dimethylsulfide dinoflagellate dinoflagellates discrete measurements distribution DOC DOM domoic acid DOP dust DVM ecology economics ecosystem management ecosystems eddy Education EEZ Ekman transport emissions ENSO enzyme equatorial current equatorial regions ESM estuarine and coastal carbon fluxes estuary euphotic zone eutrophication evolution export export fluxes export production extreme events faecal pellets fecal pellets filter feeders filtration rates fire fish Fish carbon fisheries fishing floats fluid dynamics fluorescence food webs forage fish forams freshening freshwater frontal zone functional role future oceans gelatinous zooplankton geochemistry geoengineering geologic time GEOTRACES glaciers gliders global carbon budget global ocean global ocean models global warming go-ship grazing greenhouse gas greenhouse gases Greenland ground truthing groundwater Gulf of Maine Gulf of Mexico Gulf Stream gyre harmful algal bloom high latitude human food human impact human well-being hurricane hydrogen hydrothermal hypoxia ice age iceberg ice cores ice cover industrial onset inland waters in situ inverse circulation ions iron iron fertilization iron limitation isotopes jellies katabatic winds kelvin waves krill kuroshio lab vs field land-ocean continuum larvaceans lateral transport LGM lidar ligands light light attenuation lipids low nutrient machine learning mangroves marine carbon cycle marine heatwave marine particles marine snowfall marshes mCDR mechanisms Mediterranean meltwater mesopelagic mesoscale mesoscale processes metagenome metals methane methods microbes microlayer microorganisms microplankton microscale microzooplankton midwater migration minerals mitigation mixed layer mixed layers mixing mixotrophs mixotrophy model modeling model validation mode water molecular diffusion MPT MRV multi-decade N2 n2o NAAMES NCP nearshore net community production net primary productivity new ocean state new technology Niskin bottle nitrate nitrogen nitrogen cycle nitrogen fixation nitrous oxide north atlantic north pacific North Sea NPP nuclear war nutricline nutrient budget nutrient cycles nutrient cycling nutrient limitation nutrients OA observations ocean-atmosphere ocean acidification ocean acidification data ocean alkalinity enhancement ocean carbon storage and uptake ocean carbon uptake and storage ocean color ocean modeling ocean observatories ocean warming ODZ oligotrophic omics OMZ open ocean optics organic particles oscillation outwelling overturning circulation oxygen pacific paleoceanography PAR parameter optimization parasite particle flux particles partnerships pCO2 PDO peat pelagic PETM pH phenology phosphate phosphorus photosynthesis physical processes physiology phytoplankton PIC piezophilic piezotolerant plankton POC polar polar regions policy pollutants precipitation predation predator-prey predators prediction pressure primary productivity Prochlorococcus productivity prokaryotes proteins pteropods pycnocline radioisotopes remineralization remote sensing repeat hydrography residence time resource management respiration resuspension rivers rocky shore Rossby waves Ross Sea ROV salinity salt marsh satellite scale seafloor seagrass sea ice sea level rise seasonal seasonality seasonal patterns seasonal trends sea spray seawater collection seaweed secchi sediments sensors sequestration shelf ocean shelf system shells ship-based observations shorelines siderophore silica silicate silicon cycle sinking sinking particles size SOCCOM soil carbon southern ocean south pacific spatial covariations speciation SST state estimation stoichiometry subduction submesoscale subpolar subtropical sulfate surf surface surface ocean Synechococcus technology teleconnections temperate temperature temporal covariations thermocline thermodynamics thermohaline thorium tidal time-series time of emergence titration top predators total alkalinity trace elements trace metals trait-based transfer efficiency transient features trawling Tris trophic transfer tropical turbulence twilight zone upper ocean upper water column upwelling US CLIVAR validation velocity gradient ventilation vertical flux vertical migration vertical transport warming water clarity water mass water quality waves weathering western boundary currents wetlands winter mixing zooplankton

Copyright © 2025 - OCB Project Office, Woods Hole Oceanographic Institution, 266 Woods Hole Rd, MS #25, Woods Hole, MA 02543 USA Phone: 508-289-2838  •  Fax: 508-457-2193  •  Email: ocb_news@us-ocb.org

link to nsflink to noaalink to WHOI

Funding for the Ocean Carbon & Biogeochemistry Project Office is provided by the National Science Foundation (NSF) and the National Aeronautics and Space Administration (NASA). The OCB Project Office is housed at the Woods Hole Oceanographic Institution.