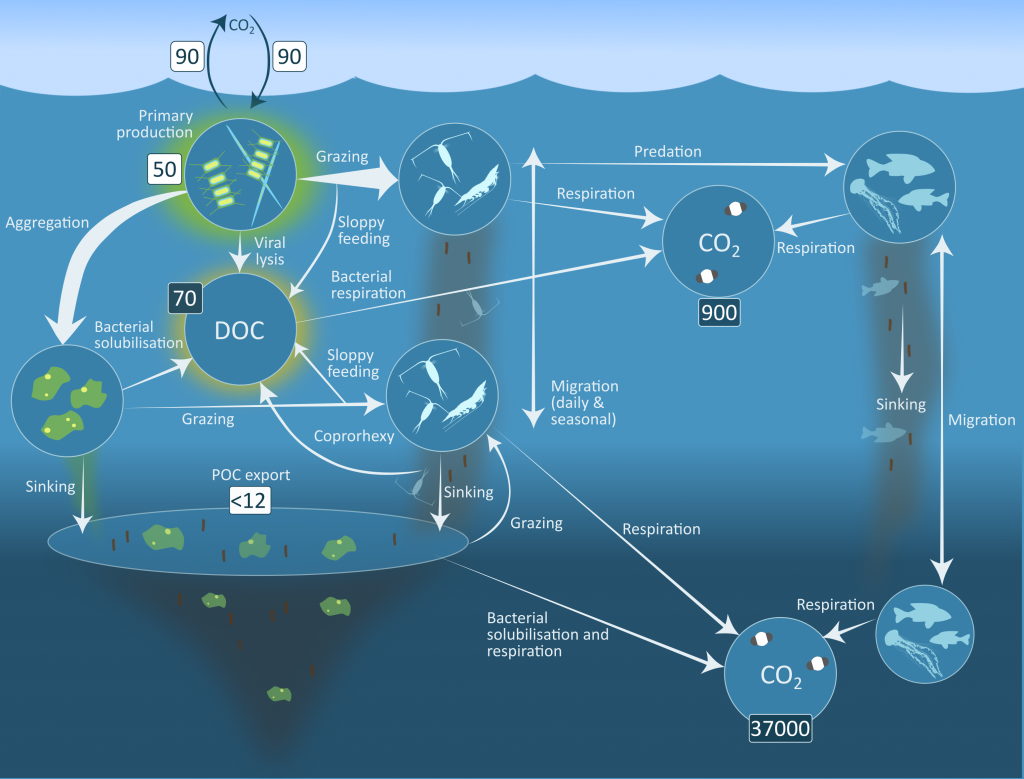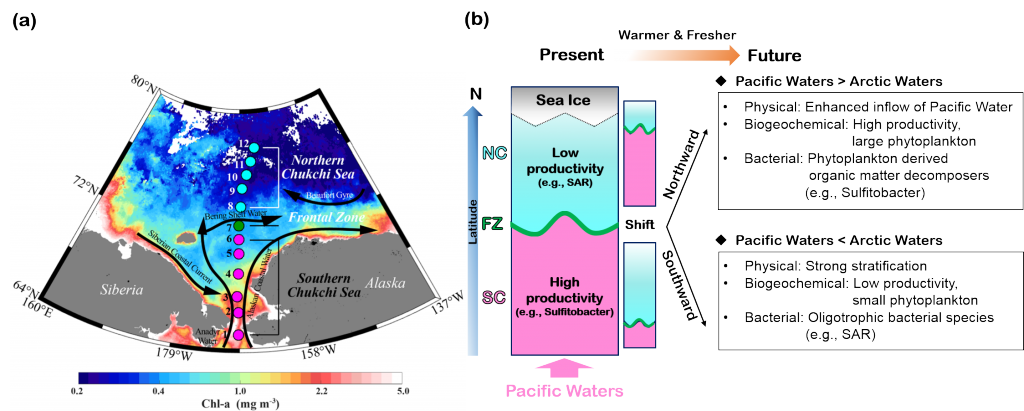
Iron (Fe) is a key element to sustaining life, but it is present at extremely low concentrations in seawater. This scarcity limits phytoplankton growth in large swaths of the global ocean, with implications for marine food webs and carbon cycling. The acquisition of Fe by phytoplankton is an important process that mediates the movement of carbon to the deep ocean and across trophic levels. It is a challenge to evaluate the ability of marine phytoplankton to obtain Fe from seawater since it is bound by a variety of poorly defined organic complexes.
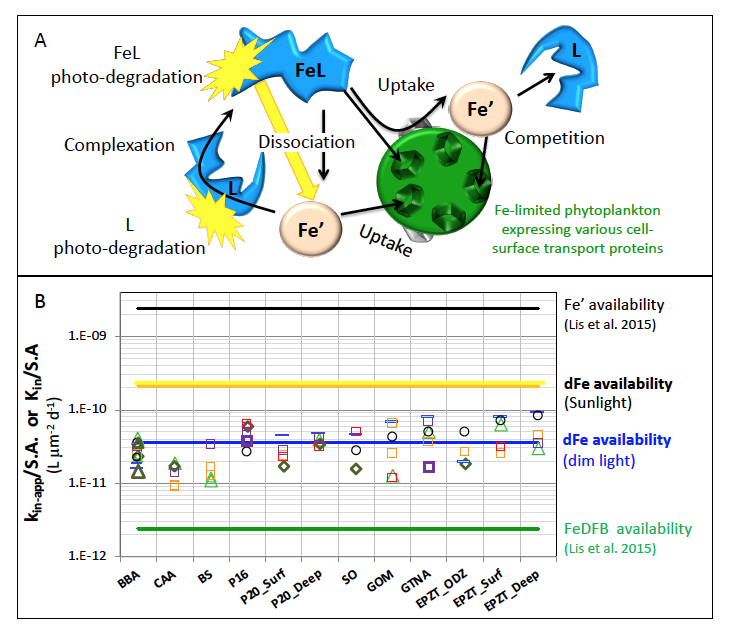
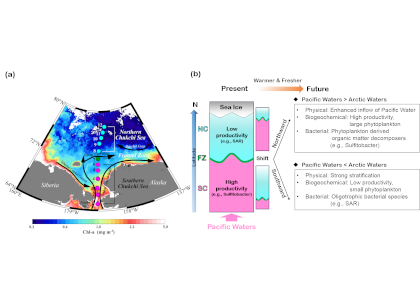
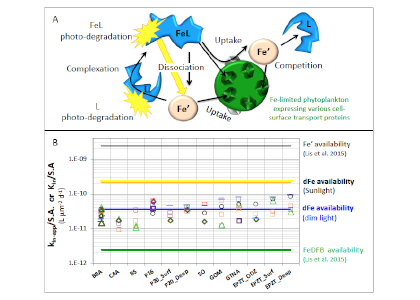
Figure 1: Schematic representation of the reactions governing dissolved Fe (dFe) bioavailability to phytoplankton (a) Bioavailability of dFe in seawater collected from various basins and depth and probed with different iron-limited phytoplankton species under dim laboratory light and sunlight (b) (See paper for further details on samples and species)
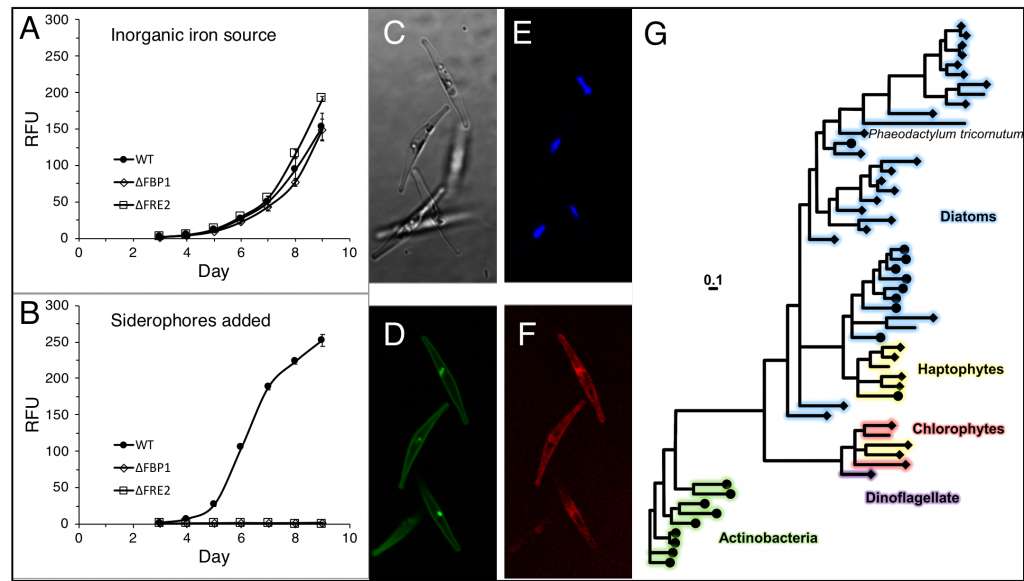
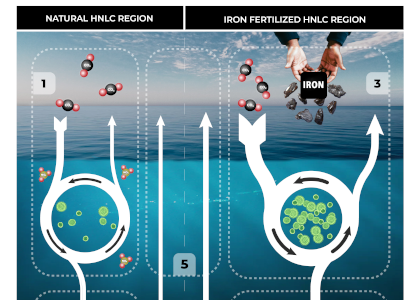
A recent study in The ISME Journal proposes a new approach for evaluating seawater dissolved Fe (dFe) bioavailability based on its uptake rate constant by Fe-limited cultured phytoplankton. The authors collected samples from distinct regions across the global ocean, measured the properties of organic complexation, loaded these complexes with a radioactive Fe isotope, and then tracked the internalization rates from these forms to a diverse set of Fe-limited phytoplankton species. Regardless of origin, all of the phytoplankton acquired natural organic complexes at similar rates (accounting for cell surface area). This confirms that multiple Fe-limited phytoplankton species can be used to probe dFe bioavailability in seawater. Among water types, dFe bioavailability varied by ~4-fold and did not clearly correlate with Fe concentrations or any of the measured Fe speciation parameters. This new approach provides a novel way to determine Fe bioavailability in samples from across the oceans and enables modeling of in situ Fe uptake rates by phytoplankton based simply on measured Fe concentrations.
Authors:
Yeala Shaked (Hebrew University of Jerusalem)
Kristen N. Buck (University of South Florida)
Travis Mellett (University of South Florida)
Maria. T. Maldonado (University of British Columbia)