Flow cytometry can sort hundreds of thousands of phytoplankton cells in minutes, a tool that has been exploited for over thirty years in marine science. However, skilled analysts are still needed for manual interpretation of these cells into different types and then further into size distributions and optical properties.
In a recent study published in Applied Optics, the authors developed and implemented an automated scheme on the large Atlantic Meridional Transect flow cytometric database, which contains around 104 samples and 109 cells (the entire AMT flowcytometric dataset which spans a decade of transects (AMT18 – AMT27). This unique, well-calibrated dataset spans 100° of latitude between the UK and the Falklands, with multiple samples between 0-200m. The results clearly show that Prochlorococcus, very small marine cyanobacteria, are consistently larger than previously thought (>0.65 µm), and their size distribution reveals a distinctive double peak (0.75 µm and 1.75 µm) that varies strongly with depth. This is coupled with changes in Prochlorococcus optical properties, a term we have coined “opto-types.” By contrast, Synechococcus are typically 1.5 µm in diameter and more homogeneously dispersed.
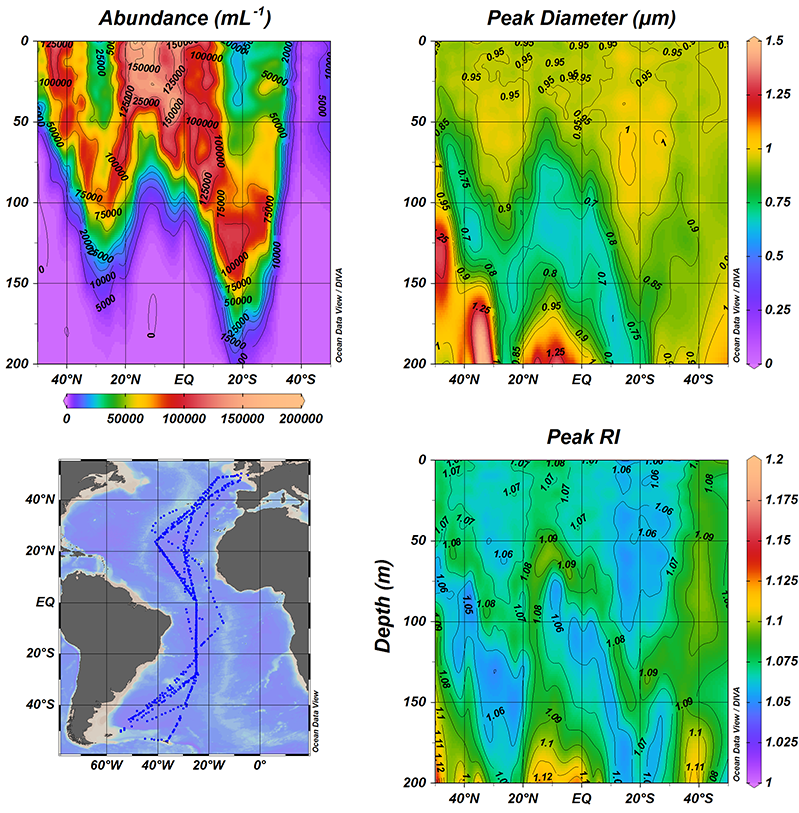
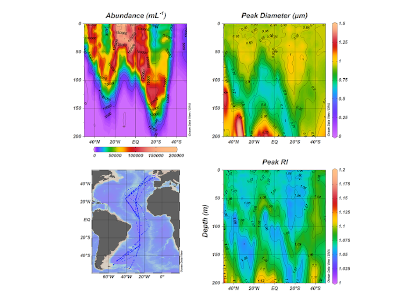
Figure 1: North to South transect (bottom left) of the Atlantic Ocean showing the variability in the abundance (top left), size (top right) and refractive index (bottom right) of Prochlorococcus
This work has uncovered new information regarding the size distribution of the ocean’s smallest phytoplankton, which has implications for how energy is transferred between different biological organisms.
Authors:
Tim Smyth (Plymouth Marine Laboratory)
Glen Tarran (Plymouth Marine Laboratory)
Shubha Sathyendranath (Plymouth Marine Laboratory)