The ocean is one of the largest sinks of atmospheric carbon dioxide (CO2) on our planet, driven in part by CO2 uptake by phytoplankton in the upper ocean during photosynthesis. Eventually, a portion of the resulting organic carbon is transported to depth, where it is sequestered from the atmosphere for centuries or even millennia. Our current understanding of the biological pump is based on the export of organic material in the form of large, fast-sinking (hundreds of meters per day) particles. However, using lipids as biomarkers, a recent study from the Equatorial Pacific Ocean published in JGR Biogeosciences showed that fast-sinking particles are refractory and distinctly different from plankton in the mixed layer, whereas slow-sinking particles were more labile and had a more similar composition to mixed layer particles (Fig. 1).
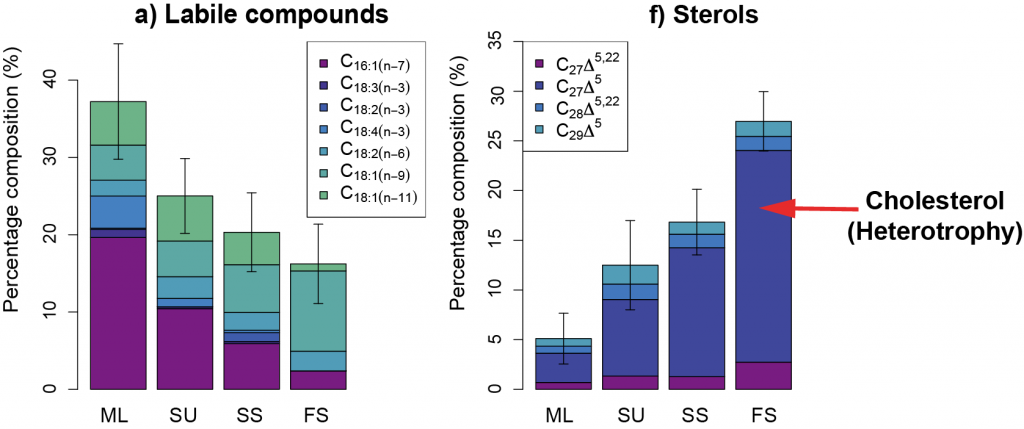
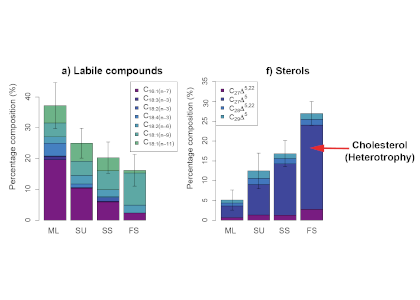
Figure 1. Particle lipid compositions for different particle fractions: ML = homogenous mixed layer particles, SU = suspended, SS = slow-sinking, and FS = fast-sinking of a) labile compounds known as unsaturated fatty acids synthesized by phytoplankton that provide a lot of energy for heterotrophs and b) sterols, including cholesterol (dark blue), which can be a biomarker for heterotrophy. Mixed layer particles are the most labile, showing the least degree of heterotrophic reworking, as expected. However, fast-sinking particles are most dissimilar from those in the mixed layer, with only a small proportion of labile compounds and a high degree of heterotrophic reworking.
The authors proposed a slower, less efficient export pathway, by which phytoplankton initially aggregate to smaller, slower-sinking detrital particles and then gradually form highly degraded, larger particles that sink to depth. Since smaller particles are respired more rapidly than larger particles, the proportion of phytoplankton-captured atmospheric CO2 being stored in the deep ocean is likely reduced, particularly in regions dominated by smaller phytoplankton such as the Equatorial Pacific. This study clearly demonstrates the need for improved representation of a wider range of particle dynamics in models of the ocean’s biological pump.
Authors:
E. L. Cavan (University of Tasmania, previously University of Southampton)
S. Giering (National Oceanography Centre)
G. Wolff (University of Liverpool)
M. Trimmer (Queen Mary University London)
R. Sanders (National Oceanography Centre)