Ocean Carbon & Biogeochemistry
Studying marine ecosystems and biogeochemical cycles in the face of environmental change
  • Home
  • About OCB
    • About Us
    • Scientific Breadth
      • Biological Pump
      • Changing Marine Ecosystems
      • Changing Ocean Chemistry
      • Estuarine and Coastal Carbon Fluxes
      • Ocean Carbon Uptake and Storage
      • Ocean Observatories
    • Code of Conduct
    • Get Involved
    • Project Office
    • Scientific Steering Committee
    • OCB committees
      • Ocean Time-series
      • US Biogeochemical-Argo
      • Ocean-Atmosphere Interaction
  • Activities
    • Summer Workshop
    • OCB Webinars
    • Guidelines for OCB Workshops & Activities
    • Topical Workshops
      • CMIP6 Models Workshop
      • Coastal BGS Obs with Fisheries
      • C-saw extreme events workshop
      • Expansion of BGC-Argo and Profiling Floats
      • Fish, fisheries and carbon
      • Future BioGeoSCAPES program
      • GO-BCG Scoping Workshop
      • Lateral Carbon Flux in Tidal Wetlands
      • Leaky Deltas Workshop – Spring 2025
      • Marine CDR Workshop
      • Ocean Nucleic Acids ‘Omics
      • Pathways Connecting Climate Changes to the Deep Ocean
    • Small Group Activities
      • Aquatic Continuum OCB-NACP Focus Group
      • Arctic-COLORS Data Synthesis
      • BECS Benthic Ecosystem and Carbon Synthesis WG
      • Carbon Isotopes in the Ocean Workshop
      • CMIP6 WG
      • Filling the gaps air–sea carbon fluxes WG
      • Fish Carbon WG
      • Meta-eukomics WG
      • mCDR
      • Metaproteomic Intercomparison
      • Mixotrophs & Mixotrophy WG
      • N-Fixation WG
      • Ocean Carbonate System Intercomparison Forum
      • Ocean Carbon Uptake WG
      • OOI BGC sensor WG
      • Operational Phytoplankton Observations WG
      • Phytoplankton Taxonomy WG
    • Other Workshops
    • Science Planning
      • Coastal CARbon Synthesis (CCARS)
      • North Atlantic-Arctic
    • Ocean Acidification PI Meetings
    • Training Activities
      • PACE Hackweek 2025
      • PACE Hackweek 2024
      • PACE Training Activity 2022
  • Science Support
    • Data management and archival
    • Early Career
    • Funding Sources
    • Jobs & Postdocs
    • Meeting List
    • OCB Topical Websites
      • Ocean Fertilization
      • Trace gases
      • US IIOE-2
    • Outreach & Education
    • Promoting your science
    • Student Opportunities
    • OCB Activity Proposal Solicitations
      • Guidelines for OCB Workshops & Activities
    • Travel Support
  • Publications
    • OCB Workshop Reports
    • Science Planning and Policy
    • Newsletter Archive
  • Science Highlights
  • News

Archive for modeling – Page 2

Drivers of recent Chesapeake Bay warming

Posted by mmaheigan 
· Friday, August 26th, 2022 

Coastal water temperatures have been increasing globally with more frequent marine heat waves threatening marine life and nearshore communities reliant upon these ecosystems. Often, this warming is assumed to be uniform in space and time; however, this is not the case in the Chesapeake Bay, where warming waters play a major role in exacerbating low oxygen levels and indirectly limiting the efficacy of nutrient reduction efforts on land.

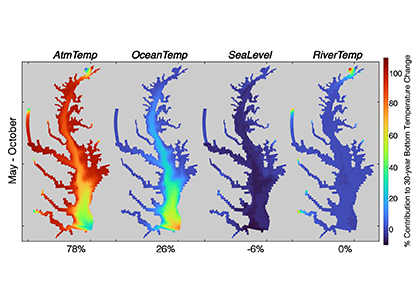
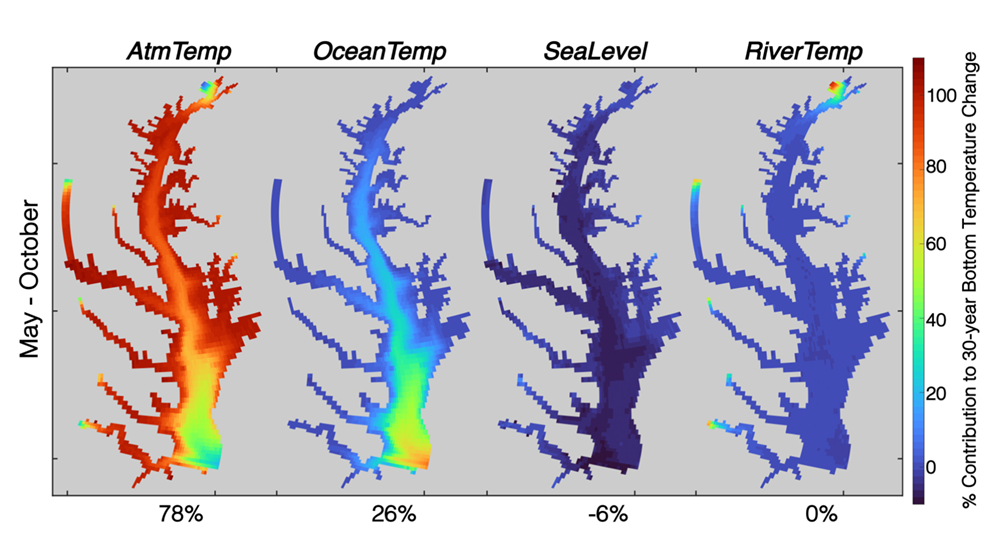
New research published in the Journal of the American Water Resources Association combined long-term observations and a hydrodynamic model to quantify the temporal and spatial variability in warming Chesapeake Bay waters, and identify the contributions of different mechanisms driving these historical temperature changes. While winter temperatures have warmed by less than a half a degree over the past 30 years, summer temperatures have warmed by nearly 1.5 °C, with similar increases at the surface and bottom. In cooler months, the atmosphere was the dominant driver of warming throughout the majority of the Bay, but oceanic warming explained more than half of the increased summer temperatures in the southern Bay nearest the Atlantic.

Figure 1: Relative contribution of different factors to warm-month Chesapeake Bay temperature change over the period 1985-2015. Percentages correspond to average main channel contributions for each component.

Warming temperatures have potentially significant implications for the future size of the Chesapeake Bay dead zone, and the marine species directly affected by these low oxygen conditions. Better quantifying warming contributions from the atmosphere, ocean, sea level, and rivers will also help constrain regional temperature projections throughout the estuary. More accurate projections of future Bay temperatures can help coastal managers better understand the potential for invasive species expansion and endemic species loss, impacts to fisheries and aquaculture, and how changes to ecosystem processes may impact coastal communities dependent on a healthy Bay.


Authors:
Kyle E. Hinson (Virginia Institute of Marine Science, William & Mary)
Marjorie A. M. Friedrichs (Virginia Institute of Marine Science, William & Mary)
Pierre St-Laurent (Virginia Institute of Marine Science, William & Mary)
Fei Da (Virginia Institute of Marine Science, William & Mary)
Raymond G. Najjar (The Pennsylvania State University)

Nutrient management improves hypoxia in the Chesapeake Bay despite record-breaking precipitation and warming

Posted by mmaheigan 
· Friday, August 26th, 2022 

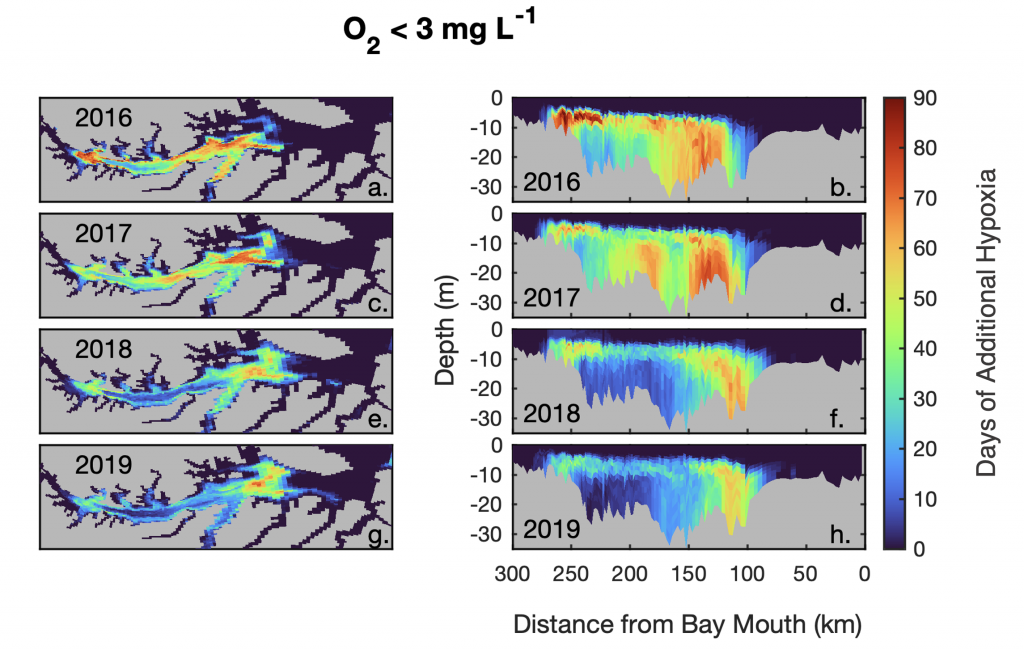
Hypoxia is currently one of the greatest threats to coastal and estuarine ecosystems around the world, and this threat is projected to get worse as waters warm and human populations continue to increase. Over the past 35-years, a massive effort has been underway to decrease hypoxia in the Chesapeake Bay by reducing nutrient input from land. Despite this effort, record-breaking precipitation in 2018-2019 fueled particularly large hypoxic volumes in the Bay, calling into question the efficacy of management actions.

Figure 1. The number of days of additional hypoxia (O2 < 3 mg L-1) that would have occurred in the Chesapeake Bay if the 35 years of nutrient reductions never occurred, as calculated by differences between a realistic numerical model simulation and one with 1985 nitrogen levels. This management effort has had the greatest impact at the northern and southern edges of the hypoxia in the Bay, where there would have been an additional 60-90 days of O2 < 3 mg L-1 if nutrient reductions never occurred.

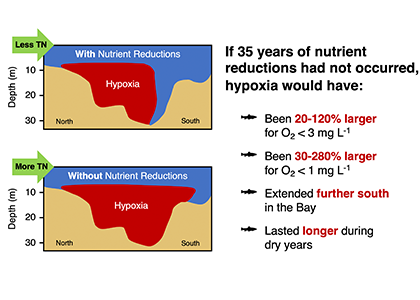
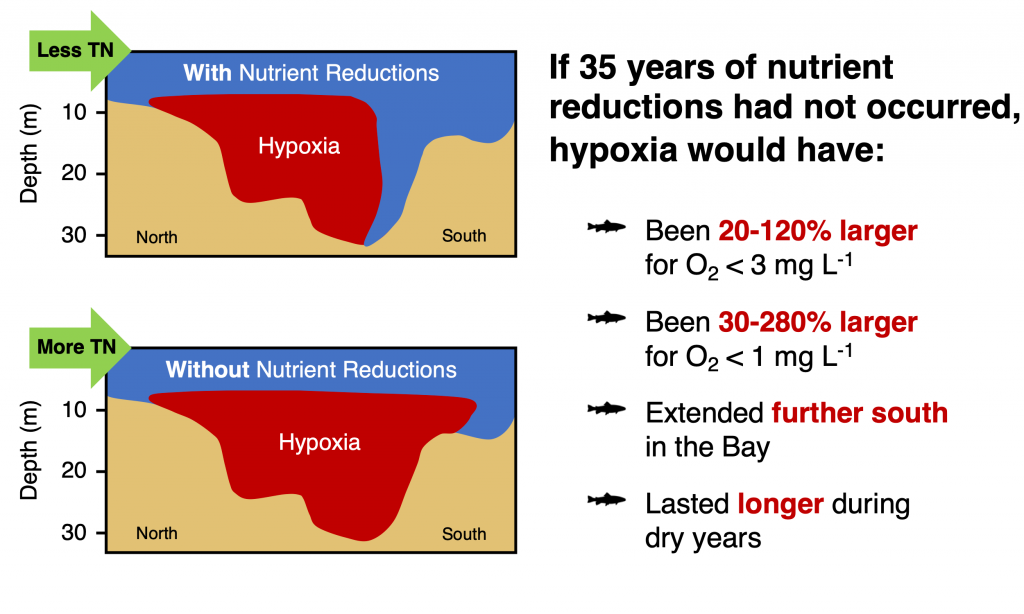
In a recent paper published in Science of the Total Environment, researchers used empirical and numerical modeling to quantify the impact of nutrient management efforts on hypoxia in the Chesapeake Bay. Results suggest that if the nutrient reduction efforts beginning in 1985 had not taken place, hypoxia would have been ~50–120% greater during the average discharge years of 2016–2017 and ~20–50% greater during the wet years of 2018–2019. The management impact was most pronounced in regions of the Bay where the hypoxia season would have been 60-90 days longer if nutrient reductions did not occur (Figure 1).

Although these results suggest that management has reduced hypoxic conditions in the Bay, additional analysis revealed that warming temperatures have already offset 6-34% of this improvement. This highlights the importance of factoring in climate change when setting future management goals.

Figure 2. The number of days of additional hypoxia (O2 < 3 mg L-1) that would have occurred in the Chesapeake Bay if the 35 years of nutrient reductions never occurred, as calculated by differences between a realistic numerical model simulation and one with 1985 nitrogen levels. This management effort has had the greatest impact at the northern and southern edges of the hypoxia in the Bay, where there would have been an additional 60-90 days of O2 < 3 mg L-1 if nutrient reductions never occurred.


Authors:
Luke T. Frankel (Virginia Institute of Marine Science, William & Mary)
Marjorie A. M. Friedrichs (Virginia Institute of Marine Science, William & Mary)
Pierre St-Laurent (Virginia Institute of Marine Science, William & Mary)
Aaron J. Bever (Anchor QEA)
Romuald N. Lipcius (Virginia Institute of Marine Science, William & Mary)
Gopal Bhatt (Pennsylvania State University; Chesapeake Bay Program)
Gary W. Shenk (USGS; Chesapeake Bay Program)

How does the competition between phytoplankton and bacteria for iron alter ocean biogeochemical cycles?

Posted by mmaheigan 
· Friday, August 26th, 2022 

Free-living bacteria play a key role in cycling essential biogeochemical resources in the ocean, including iron, via their uptake, transformation, and release of organic matter throughout the water column. Bacteria process half of the ocean’s primary production, remineralize dissolved organic matter, and re-direct otherwise lost organic matter to higher trophic levels. For these reasons, it is crucial to understand what factors limit the growth of bacteria and how bacteria activities impact global ocean biogeochemical cycles.

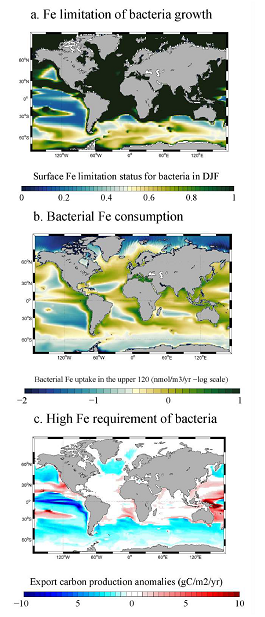
In a recent study, Pham and colleagues used a global ocean ecosystem model to dive into how iron limits the growth of free-living marine bacteria, how bacteria modulate ocean iron cycling, and the consequences to marine ecosystems of the competition between bacteria and phytoplankton for iron.

Figure 1: (a) Iron limitation status of bacteria in December, January, and February (DJF) in the surface ocean. Low values (in blue color = close to zero) mean that iron is the limiting factor for the growth of bacteria; (b) Bacterial iron consumption in the upper 120m of the ocean and (c) Changes (anomalies) in export carbon production when bacteria have a high requirement for iron.

Through a series of computer simulations performed in the global ocean ecosystem model, the authors found that iron is a limiting factor for bacterial growth in iron-limited regions in the Southern Ocean, the tropical, and the subarctic Pacific due to the high iron requirement and iron uptake capability of bacteria. Bacteria act as an iron sink in the upper ocean due to their significant iron consumption, a rate comparable to phytoplankton. The competition between bacteria and phytoplankton for iron alters phytoplankton bloom dynamics, ocean carbon export, and the availability of dissolved organic carbon needed for bacterial growth. These results suggest that earth system models that omit bacteria ignore an important organism modulating biogeochemical responses of the ocean to future changes.

Authors: 
Anh Le-Duy Pham (Laboratoire d’Océanographie et de Climatologie: Expérimentation et Approches Numériques (LOCEAN), IPSL, CNRS/UPMC/IRD/MNHN, Paris, France)
Olivier Aumont (Laboratoire d’Océanographie et de Climatologie: Expérimentation et Approches Numériques (LOCEAN), IPSL, CNRS/UPMC/IRD/MNHN, Paris, France)
Lavenia Ratnarajah (University of Liverpool, United Kingdom)
Alessandro Tagliabue (University of Liverpool, United Kingdom)

Chemical thermodynamic models of artificial seawater and the Tris buffers used to define the ‘total’ pH scale

Posted by mmaheigan 
· Thursday, August 25th, 2022 

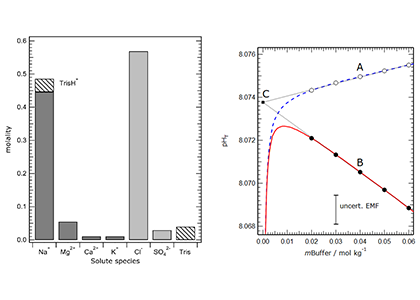
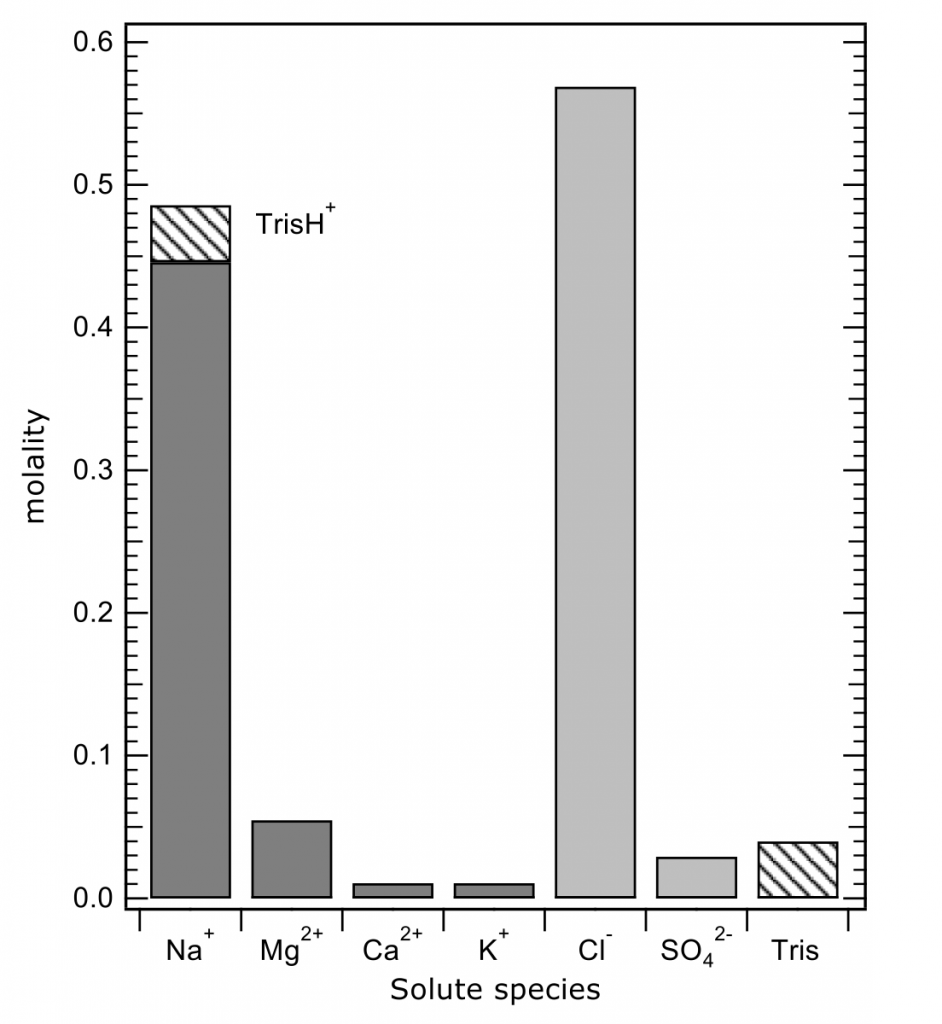
The total pH scale used by oceanographers (for salinities 20 – 40, and temperatures 0 to 45°C) is calibrated from a combination of electromotive force measurements of artificial seawaters containing either added HCl of various molalities, or equimolal Tris and its protonated form TrisH+. In both cases, the added H+ or TrisH+ is substituted for Na+ on a mole-for-mole-basis, so as to change the properties of the artificial seawater medium as little as possible. The artificial seawater itself consists of the major ions of seawater (those present in constant ratios to one another in natural seawater), with substitutions for the inorganic acid-base species present in natural seawater (principally carbonate and borate). Figure 1 shows the composition of a typical Tris buffer.

Figure 1. The composition of a buffer solution containing 0.04 mol kg-1 of Tris and TrisH+ in artificial seawater of salinity 35. The TrisH+ is substituted for an equal amount of Na+, so that the buffer has the same ionic strength as a pure artificial seawater of the same nominal salinity.

The operational definition of the total pH scale in use today involves a number of assumptions associated with the small differences between pure artificial seawater, and artificial seawater containing the buffer substance. These cannot be determined experimentally. However, a chemical thermodynamic model of the ion activities and concentrations in the buffer solutions can be used to calculate these quantities and to link measured total pH to the conventional thermodynamic total of H+ and HSO4–. Such a model can also address a series of important future applications and uses of the total pH scale:

  • The measurement of the total pH of natural waters whose compositions differ from seawater stoichiometry, and the extension of the scale to low salinity waters
  • Conversion between total pH, a measure of [H+] + [HSO4–], and ‘free’ pH (a measure of [H+])
  • Calibration of electrode pairs such as H+/Cl– or H+/Na+ for the potentiometric measurement of pH

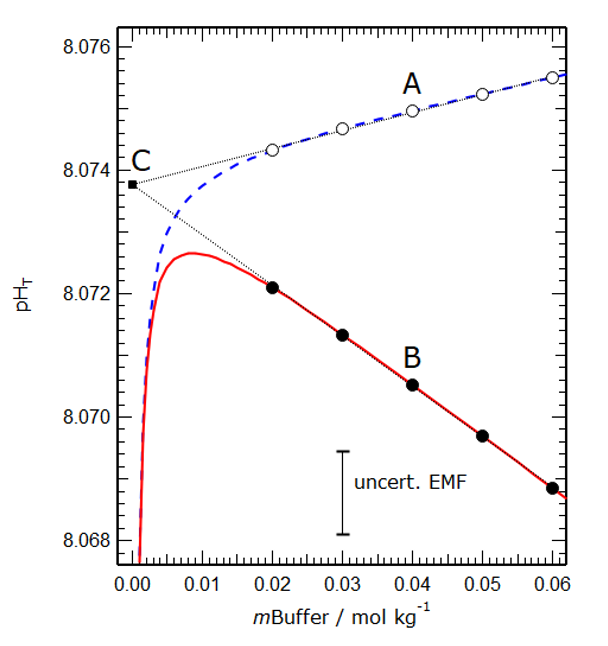
Figure 2 shows a model simulation of the operationally defined total pH and the conventional thermodynamic sum [H+] + [HSO4–] in a buffer solution of salinity 35. The linear extrapolation to zero buffer molality yields a hypothetical total pH that is used by oceanographers and is shown to be the same for both cases, demonstrating that they are the same.

Figure 2. Modelled values of the operational total pH (dashed blue line) and the conventional thermodynamic total pH (solid red line) plotted against buffer molality (mBuffer) for a salinity 35 artificial seawater at 25°C. The fine dotted lines are extrapolations of linear fits to the two groups of points. The vertical distance between marked points A and B (about 0.0045 pH units) represents the effect of differences between the two solutions – hitherto assumed out of necessity to be zero, and here calculated for the first time. The two extrapolations (fine dotted lines) intercept at point C, for which mBuffer is equal to zero and the two definitions are numerically the same.

In these two papers, we describe the development of the model of solutions containing the ions of artificial seawater plus Tris buffer. The models include uncertainty propagation (a first, for models of this type). We assess the needs for further measurements to both improve the accuracy of the model and extend it over the full range of temperatures of interest to oceanographers. We have an ongoing programme of measurements to support this work involving colleagues at the National Institute of Standards and Technology and its equivalents in Germany and Japan. In late 2022, we will be releasing for public use the software that implements two models, and also one of seawater electrolyte. If interested, please contact Heather Benway to be added to our email list, and check the website of SCOR Working Group 145 (marchemspec.org).

Read the papers about the pH buffer and artificial seawater in Marine Chemistry.

Authors:
Simon L. Clegg (School of Environmental Sciences, University of East Anglia, United Kingdom)
Matthew P. Humphreys (NIOZ Royal Netherlands Institute for Sea Research, Netherlands)
Jason F. Waters (National Institute of Standards and Technology, Gaithersburg, USA
David R. Turner (University of Gothenburg, Sweden)
Andrew G. Dickson (Scripps Institution of Oceanography, La Jolla, USA)

How do coccolithophores survive the darkness?

Posted by mmaheigan 
· Friday, April 1st, 2022 

Coccolithophores have survived several major extinction events over geologic time. The most significant was the asteroid impact at the K/T boundary, followed by months of darkness. Additionally, coccolithophores regularly reside in the twilight zone, just beyond the reach of sunlight. A paper recently published in the New Phytologist addresses how these photosynthetic algae can persist and grow, albeit slowly, in darkness using osmotrophy.

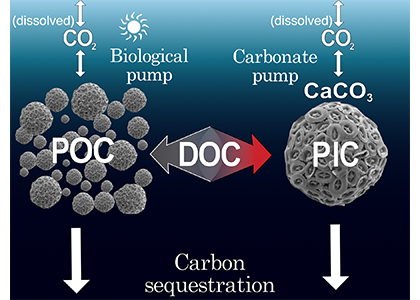
The authors discovered that the osmotrophic uptake of certain types of dissolved organic carbon (DOC) can support survival in low light. They completed a 30-day darkness experiment to determine how the concentration of several DOC compounds affects growth. The coccolithophore species Cruciplacolithus neohelis growth rate increased with the increasing concentration of dissolved organic compounds. They also examined the kinetics of short-term uptake of radiolabeled DOC compounds and found that the uptake rate generally showed Michaelis-Menten-like saturation kinetics. All radiolabeled DOC compounds were incorporated into the POC fraction, but surprisingly also into the particulate inorganic carbon (PIC) fraction (i.e., calcite coccoliths).

These results suggest that osmotrophic uptake in coccolithophores may be significant enough to be included in carbon cycle models, especially if they can simultaneously take up a wide range of organic compounds. Surprisingly, we detected 14C-DOC in the PIC fraction after only 24 hours. This remarkably rapid incorporation is most likely due to the respiration of radiolabeled DOC into dissolved inorganic carbon (DIC), subsequently used by coccolithophores for calcification. These results have implications for the biological carbon pump and alkalinity pump paradigms, as we confirmed that both POC and PIC originate from DOC on short time scales.


Introducing the Coastal Ocean Data Analysis Product in North America (CODAP-NA)

Posted by mmaheigan 
· Friday, October 22nd, 2021 

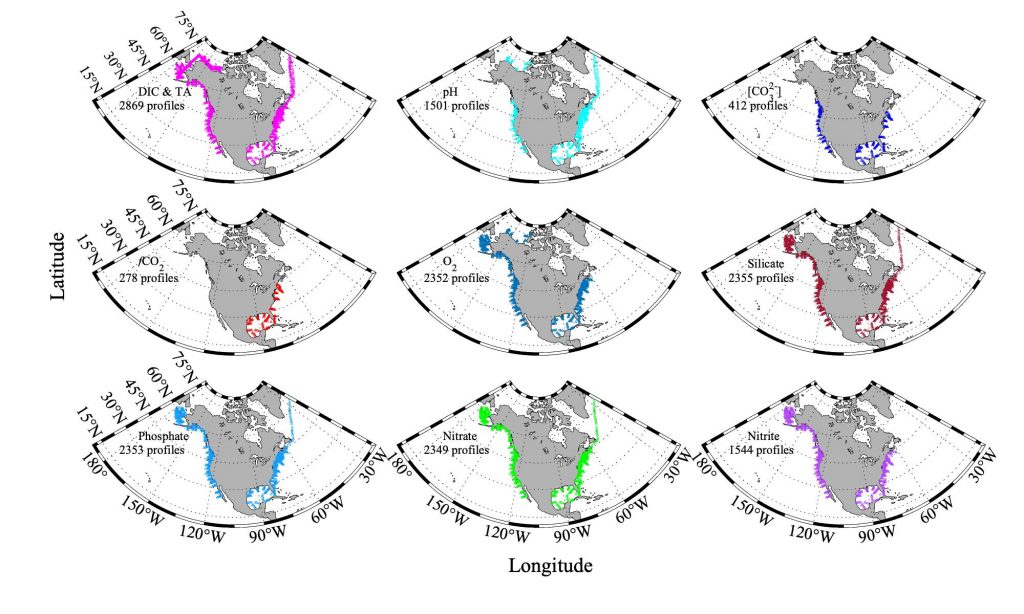
Coastal ecosystems are hotspots for commercial and recreational fisheries, and aquaculture industries that are susceptible to change or economic loss due to ocean acidification. These coastal ecosystems support about 90% of the global fisheries yield and 80% of the known marine fish species, and sustain ecosystem services worth $27.7 Trillion globally (a number larger than the U.S. economy). Despite the importance of these areas and economies, internally-consistent data products for water column carbonate and nutrient chemistry data in the coastal ocean—vital to understand and predict changes in these systems—currently do not exist. A recent study published in Earth Syst. Sci. Data compiled and quality controlled discrete sampling-based data—inorganic carbon, oxygen, and nutrient chemistry, and hydrographic parameters collected from the entire North American ocean margins—to create a data product called the Coastal Ocean Data Analysis Product for North America (CODAP-NA) to fill the gap. This effort will promote future OA research, modeling, and data synthesis in critically important coastal regions to help advance the OA adaptation, mitigation, and planning efforts by North American coastal communities; and provides a foothold for future synthesis efforts in the coastal environment.

Figure caption. Sampling stations of the CODAP-NA data product.


Authors:
Li-Qing Jiang (University of Maryland; NOAA NCEI)
Richard A. Feely (NOAA PMEL)
Rik Wanninkhof (NOAA AOML)
Dana Greeley (NOAA PMEL)
Leticia Barbero (University of Miami; NOAA AOML)
Simone Alin (NOAA PMEL)
Brendan R. Carter (University of Washington; NOAA PMEL)
Denis Pierrot (NOAA AOML)
Charles Featherstone (NOAA AOML)
James Hooper (University of Miami; NOAA AOML)
Chris Melrose (NOAA NEFSC)
Natalie Monacci (University of Alaska Fairbanks)
Jonathan Sharp (University of Washington; NOAA PMEL)
Shawn Shellito (University of New Hampshire)
Yuan-Yuan Xu (University of Miami; NOAA AOML)
Alex Kozyr (University of Maryland; NOAA NCEI)
Robert H. Byrne (University of South Florida)
Wei-Jun Cai (University of Delaware)
Jessica Cross (NOAA PMEL)
Gregory C. Johnson (NOAA PMEL)
Burke Hales (Oregon State University)
Chris Langdon (University of Miami)
Jeremy Mathis (Georgetown University)
Joe Salisbury (University of New Hampshire)
David W. Townsend (University of Maine)

The ephemeral and elusive COVID blip in ocean carbon

Posted by mmaheigan 
· Monday, September 20th, 2021 

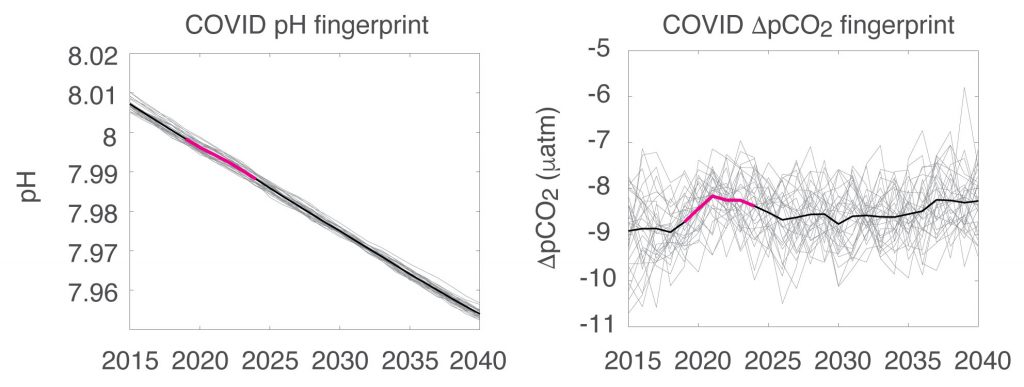
The global pandemic of the last nearly two years has affected all of us on a daily and long-term basis. Our planet is not exempt from these impacts. Can we see a signal of COVID-related CO2 emissions reductions in the ocean? In a recent study, Lovenduski et al. apply detection and attribution analysis to output from an ensemble of COVID-like simulations of an Earth system model to answer this question. While it is nearly impossible to detect a COVID-related change in ocean pH, the model produces a unique fingerprint in air-sea DpCO2 that is attributable to COVID. Challengingly, the large interannual variability in the climate system  makes this fingerprint  difficult to detect at open ocean buoy sites.

This study highlights the challenges associated with detecting statistically meaningful changes in ocean carbon and acidity following CO2 emissions reductions, and reminds the reader that it may be difficult to observe intentional emissions reductions — such as those that we may enact to meet the Paris Climate Agreement – in the ocean carbon system.

Figure caption: The fingerprint (pink line) of COVID-related CO2 emissions reductions in global-mean surface ocean pH and air-sea DpCO2, as estimated by an ensemble of COVID-like simulations in an Earth system model.   While the pH fingerprint is not particularly exciting, the air-sea DpCO2 fingerprint displays a temporary weakening of the ocean carbon sink in 2021 due to COVID emissions reductions.


Authors:
Nikki Lovenduski (University of Colorado Boulder)
Neil Swart (Canadian Centre for Climate Modeling and Analysis)
Adrienne Sutton (NOAA Pacific Marine Environmental Laboratory)
John Fyfe (Canadian Centre for Climate Modeling and Analysis)
Galen McKinley (Columbia University and Lamont Doherty Earth Observatory)
Chris Sabine (University of Hawai’i at Manoa)
Nancy Williams (University of South Florida)

Counterintuitive effects of shoreline armoring on estuarine water clarity

Posted by mmaheigan 
· Wednesday, February 24th, 2021 

Around the world, human-altered shorelines change sediment inputs to estuaries and coastal waters, altering water clarity, especially in areas of dense human population. The Chesapeake Bay estuary is recovering from historically high nutrient and sediment inputs, but water clarity improvement has been ambiguous. Long-term trends show increasing water clarity in terms of deepening light attenuation depth, yet degrading clarity in terms of shallowing Secchi depth over time. High water clarity is needed to support seagrass meadows, which act as nursery habitats for commercially important fish species such as striped bass. How are these opposing water clarity trends possible?

In a recent paper published in Science of the Total Environment, researchers performed experiments with a coupled hydrodynamic-biogeochemical model to test a simulated Chesapeake Bay under realistic conditions, more shoreline erosion, and highly armored shorelines. Comparing the two extreme conditions (Figure 1), there was a striking difference between (a) an estuary experiencing more shoreline erosion and greater resuspension versus (b) a highly armored estuary with decreased resuspension. Reduced erosion yielded improved water clarity in terms of light attenuation depth, but a shallower Secchi depth (reduced visibility). In estuaries, reducing sediment inputs is often proposed as a strategy for improving water quality. This study shows that, under certain conditions in a productive estuary, reduced sediments can have unintended secondary effects on water clarity due to enhanced production of organic particles. This study also highlights the need to consider other sediment sources in addition to rivers, such as seabed resuspension and shoreline erosion, especially at times and locations of low river input.

Figure 1. Schematic of how shoreline armoring causes deepening light attenuation depth (navy) yet shallowing Secchi depth (green) during the spring growing season in the mid-bay central channel.

Authors:
Jessica S. Turner
Pierre St-Laurent
Marjorie A. M. Friedrichs
Carl T. Friedrichs
(all Virginia Institute of Marine Science)


Species loss alters ecosystem function in plankton communities

Posted by mmaheigan 
· Monday, February 8th, 2021 

Climate change impacts on the ocean such as warming, altered nutrient supply, and acidification will lead to significant rearrangement of phytoplankton communities, with the potential for some phytoplankton species to become extinct, especially at the regional level. This leads to the question: What are phytoplankton species’ redundancy levels from ecological and biogeochemical standpoints—i.e. will other species be able to fill the functional ecological and/or biogeochemical roles of the extinct species? Authors of a paper published recently in Global Change Biology explored these ideas using a global three-dimensional computer model with diverse planktonic communities, in which single phytoplankton types were partially or fully eliminated. Complex trophic interactions such as decreased abundance of a predator’s predator led to unexpected “ripples” through the community structure and in particular, reductions in carbon transfer to higher trophic levels. The impacts of changes in resource utilization extended to regions beyond where the phytoplankton type went extinct. Redundancy appeared lowest for types on the edges of trait space (e.g., smallest) or those with unique competitive strategies. These are responses that laboratory or field studies may not adequately capture. These results suggest that species losses could compound many of the already anticipated outcomes of changing climate in terms of productivity, trophic transfer, and restructuring of planktonic communities. The authors also suggest that a combination of modeling, field, and laboratory studies will be the best path forward for studying functional redundancy in phytoplankton.

Figure caption: Examples of the modelled ecological and biogeochemical responses to the extinction of different phytoplankton species.Figure caption: Examples of the modelled ecological and biogeochemical responses to the extinction of different phytoplankton species.


Authors:
Stephanie Dutkiewicz (Massachusetts Institute of Technology)
Philip W. Boyd (Institute for Marine and Antarctic Studies, University of Tasmania)
Ulf Riebesell (GEOMAR Helmholtz Centre for Ocean Research Kiel)

Climate-driven pelagification of marine food webs: Implications for marine fish populations

Posted by mmaheigan 
· Friday, January 22nd, 2021 

Global warming changes the conditions for all ocean life, with wide-ranging consequences. It is particularly difficult to predict the impact of climate change on fish because fish production is conditioned on both temperature and food resource (zooplankton and benthic organisms) changes. Climate change projections from Earth system models show a negative amplification of changes in global ocean net primary production (NPP), with an approximate doubling of production decreases from net primary producers to mesozooplankton. This “trophic amplification” continues up the marine food web to fishes. A new study published in Frontiers in Marine Science illustrates this amplification clearly when fishes are defined by their maximum body size, which describes their position in the food web (Figure 1a). However, decreases in globally integrated biomass and production were not limited to differences in size alone. Importantly, reduced abundances also varied by fish functional type (Figure 1b).

Figure 1: a) Percent change in net primary production (NPP), mesozooplankton (MesoZ) production, all medium (M) fishes, and all large (L) fishes from Historic (1951-2000) to the RCP 8.5 Projection (2051-2100). b) Percent change in production of forage fish, large pelagic fish, demersal fish, and benthic invertebrates in Projection (2051-2100) from Historic (1951-2000). c) Absolute change in the ratio of zooplankton production to seafloor detrital flux as the difference of the Projection (2051-2100) from the Historic (1951-2000). d) Percent change in zooplankton production (dashed grey), percent change in seafloor detrital flux (solid grey), and absolute change in the ratio of their means during the Historic and Projection time periods relative to 1951.

Despite the “pelagification” of marine food webs caused by unequal decreases in secondary production (Figure 1d) and subsequent increases in pelagic zooplankton production relative to seafloor detritus production (Figure 1c,d), large pelagic fish (e.g., tunas and billfishes) suffered the greatest declines and the highest degree of projection uncertainty. The result was a shift from benthic-based ecosystems historically dominated by large demersal fish (e.g., cods and flounders) towards pelagic-based ones dominated by smaller forage fish (e.g., sardines and herring). Any positive impacts of the pelagification of food resources on large pelagic fish were overwhelmed by the negative impacts of the overall reduction in global productivity, compounded by warming-induced increases in metabolic demands. Both the degree of change in the productivity of large pelagic fish and the magnitude of trophic amplification were sensitive to the temperature dependence of metabolic rates. Thus, better constraints are needed on empirical estimates of the effect of temperature on physiological rates to project the impacts of climate change on fish biomass and marine ecosystem structure.

Ocean fish harvests currently supply ~15% of global protein demand. Reduced primary production will decrease the total amount of fish available to harvest for human food, while the pelagification of ecosystems could require large and expensive structural modifications to fisheries, including gear, location, regional and international management plans, consumer demands, and market values.


Authors:
Colleen M. Petrik (Texas A&M University)
Charles A. Stock (Geophysical Fluid Dynamics Laboratory)
Ken H. Andersen (Technical University of Denmark)
P. Daniël van Denderen (International Council for the Exploration of the Seas)
James R. Watson (Oregon State University)

« Previous Page
Next Page »

Filter by Keyword

abundance acidification additionality advection africa air-sea air-sea interactions algae alkalinity allometry ammonium AMO AMOC anoxic Antarctic Antarctica anthro impacts anthropogenic carbon anthropogenic impacts appendicularia aquaculture aquatic continuum aragonite saturation arctic Argo argon arsenic artificial seawater Atlantic atmospheric CO2 atmospheric nitrogen deposition authigenic carbonates autonomous platforms bacteria bathypelagic BATS BCG Argo benthic bgc argo bio-go-ship bio-optical bioavailability biogeochemical cycles biogeochemical models biogeochemistry Biological Essential Ocean Variables biological pump biophysics bloom blue carbon bottom water boundary layer buffer capacity C14 CaCO3 calcification calcite carbon carbon-climate feedback carbon-sulfur coupling carbonate carbonate system carbon budget carbon cycle carbon dioxide carbon export carbon fluxes carbon sequestration carbon storage Caribbean CCA CCS changing marine chemistry changing marine ecosystems changing marine environments changing ocean chemistry chemical oceanographic data chemical speciation chemoautotroph chesapeake bay chl a chlorophyll circulation CO2 coastal and estuarine coastal darkening coastal ocean cobalt Coccolithophores commercial community composition competition conservation cooling effect copepod copepods coral reefs CTD currents cyclone daily cycles data data access data assimilation database data management data product Data standards DCM dead zone decadal trends decomposers decomposition deep convection deep ocean deep sea coral denitrification deoxygenation depth diatoms DIC diel migration diffusion dimethylsulfide dinoflagellate dinoflagellates discrete measurements distribution DOC DOM domoic acid DOP dust DVM ecology economics ecosystem management ecosystems eddy Education EEZ Ekman transport emissions ENSO enzyme equatorial current equatorial regions ESM estuarine and coastal carbon fluxes estuary euphotic zone eutrophication evolution export export fluxes export production extreme events faecal pellets fecal pellets filter feeders filtration rates fire fish Fish carbon fisheries fishing floats fluid dynamics fluorescence food webs forage fish forams freshening freshwater frontal zone functional role future oceans gelatinous zooplankton geochemistry geoengineering geologic time GEOTRACES glaciers gliders global carbon budget global ocean global warming go-ship grazing greenhouse gas greenhouse gases Greenland ground truthing groundwater Gulf of Maine Gulf of Mexico Gulf Stream gyre harmful algal bloom high latitude human food human impact human well-being hurricane hydrogen hydrothermal hypoxia ice age ice cores ice cover industrial onset inland waters in situ inverse circulation ions iron iron fertilization iron limitation isotopes jellies katabatic winds kelvin waves krill kuroshio lab vs field land-ocean continuum larvaceans lateral transport LGM lidar ligands light light attenuation lipids low nutrient machine learning mangroves marine carbon cycle marine heatwave marine particles marine snowfall marshes mCDR mechanisms Mediterranean meltwater mesopelagic mesoscale mesoscale processes metagenome metals methane methods microbes microlayer microorganisms microplankton microscale microzooplankton midwater mitigation mixed layer mixed layers mixing mixotrophs mixotrophy model modeling model validation mode water molecular diffusion MPT MRV multi-decade n2o NAAMES NCP nearshore net community production net primary productivity new ocean state new technology Niskin bottle nitrate nitrogen nitrogen cycle nitrogen fixation nitrous oxide north atlantic north pacific North Sea nuclear war nutricline nutrient budget nutrient cycles nutrient cycling nutrient limitation nutrients OA observations ocean-atmosphere ocean acidification ocean acidification data ocean alkalinity enhancement ocean carbon storage and uptake ocean carbon uptake and storage ocean color ocean modeling ocean observatories ocean warming ODZ oligotrophic omics OMZ open ocean optics organic particles oscillation outwelling overturning circulation oxygen pacific paleoceanography PAR parameter optimization parasite particle flux particles partnerships pCO2 PDO peat pelagic PETM pH phenology phosphate phosphorus photosynthesis physical processes physiology phytoplankton PIC piezophilic piezotolerant plankton POC polar polar regions policy pollutants precipitation predation predator-prey prediction pressure primary productivity Prochlorococcus productivity prokaryotes proteins pteropods pycnocline radioisotopes remineralization remote sensing repeat hydrography residence time resource management respiration resuspension rivers rocky shore Rossby waves Ross Sea ROV salinity salt marsh satellite scale seafloor seagrass sea ice sea level rise seasonal seasonality seasonal patterns seasonal trends sea spray seawater collection seaweed secchi sediments sensors sequestration shelf ocean shelf system shells ship-based observations shorelines siderophore silica silicate silicon cycle sinking sinking particles size SOCCOM soil carbon southern ocean south pacific spatial covariations speciation SST state estimation stoichiometry subduction submesoscale subpolar subtropical sulfate surf surface surface ocean Synechococcus technology teleconnections temperate temperature temporal covariations thermocline thermodynamics thermohaline thorium tidal time-series time of emergence titration top predators total alkalinity trace elements trace metals trait-based transfer efficiency transient features trawling Tris trophic transfer tropical turbulence twilight zone upper ocean upper water column upwelling US CLIVAR validation velocity gradient ventilation vertical flux vertical migration vertical transport warming water clarity water mass water quality waves weathering western boundary currents wetlands winter mixing zooplankton

Copyright © 2025 - OCB Project Office, Woods Hole Oceanographic Institution, 266 Woods Hole Rd, MS #25, Woods Hole, MA 02543 USA Phone: 508-289-2838  •  Fax: 508-457-2193  •  Email: ocb_news@us-ocb.org

link to nsflink to noaalink to WHOI

Funding for the Ocean Carbon & Biogeochemistry Project Office is provided by the National Science Foundation (NSF) and the National Aeronautics and Space Administration (NASA). The OCB Project Office is housed at the Woods Hole Oceanographic Institution.