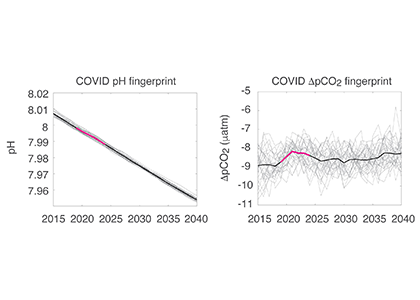
A key issue facing ocean global change scientists is predicting the fate of biota under the combined effects of ocean warming and acidification (OWA). In addition to the constraints of studying multifactor drivers, predictions are hampered by few evolutionary studies, especially for animal populations. Evolutionary studies are essential to assess the possibility of evolutionary rescue under OWA– the recovery of fitness that prevents population extirpation in the face of environmental change.
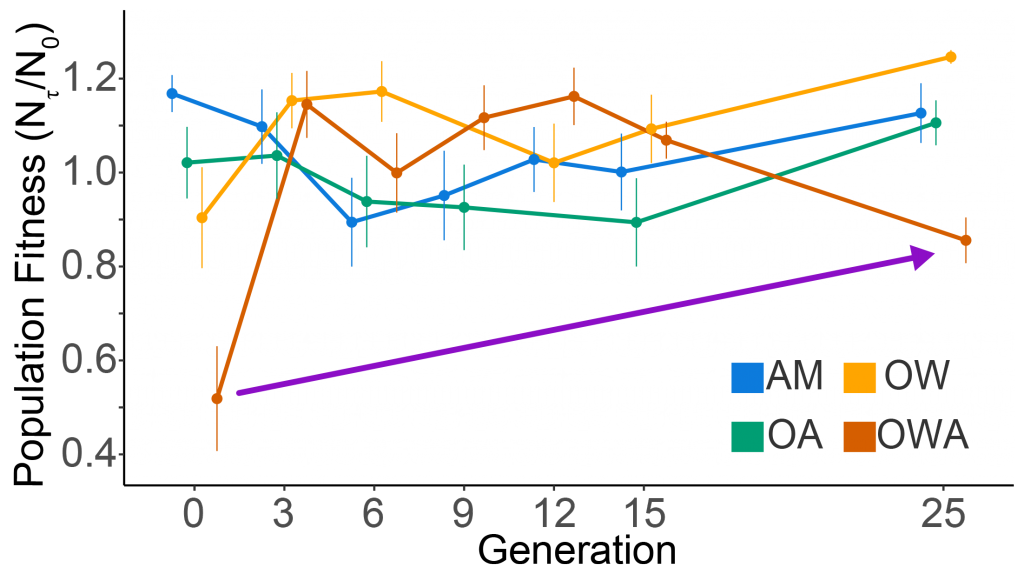
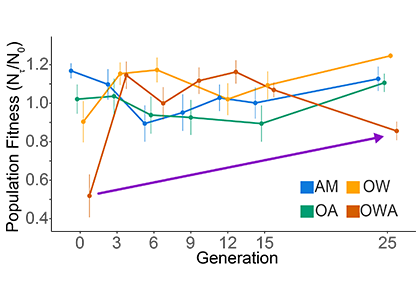
Figure 1. Population fitness of the copepod Acartia tonsa vs generation under ambient, AM (18oC, 400 µat pCO2), ocean warming, OW (22oC, 400 µat pCO2), ocean acidification, ocean acidification (18oC, 2000 µat pCO2), and ocean warming and acidification ( 22oC, 2000 µat pCO2). Shown are means and 95% confidence intervals around the mean. The purple line shows that while fitness decreased after the 12th generation, it was still considerably higher than at generation zero. Treatment lines are offset for clarity. No and Nτ (Y-axis legend) represent population size at the beginning and end of a generation (τ), and their ratio is the population fitness. Adapted from Dam et al. (2021).
A paper by Dam et al. published in Nature Climate Change examined the response of a ubiquitous copepod (zooplankter) to OWA for 25 generations to test for evolutionary rescue (Fig. 1). Using a suite of life-history traits, the researchers determined population fitness (the net reproductive rate per generation) under ambient, ocean warming, ocean acidification and OWA conditions. While population fitness decreased drastically under OWA conditions, it recovered in a few generations. However, after 12 generations under OWA, in contrast to OW or OA, fitness started to decrease again, suggesting incomplete evolutionary rescue driven by antagonistic interactions between warming and acidification. Such interactions add complexity to predictions of the fate of the oceanic biota under climate change.
Limited copepod evolutionary rescue would mean lower fisheries yields under OWA conditions as copepods are a main food source for forage fish. Copepods are also important vectors of the sequestration of CO2 to deeper waters of the ocean. Limited copepod adaptation under OWA could weaken the efficiency of the biological carbon pump.
Authors:
Hans G. Dam (University of Connecticut)
James de Mayo (University of Connecticut)
Gihong Park (University of Connecticut)
Lydia Norton (University of Connecticut)
Xuejia He (Jinan University, China)
Michael B. Finiguerra (University of Connecticut)
Hannes Baumann (University of Connecticut)
Reid S. Brennn (University of Vermont)
Melissa H. Pespeni (University of Vermont)