How will phytoplankton respond to climate changes over the next century in the Ross Sea, the most productive coastal waters of Antarctica? Model projections of physical conditions suggest substantial environmental changes in this region, but associated impacts on Ross Sea biology, specifically phytoplankton, remain unclear.
In a recent study, Kaufman et al (2017) generated and analyzed model scenarios for the mid- and late-21st century using a combination of a biogeochemical model, hydrodynamic simulations forced by a global climate projection, and new data from autonomous gliders. These scenarios indicate increases in the production of phytoplankton in the Ross Sea and increases in the downward flux of carbon in response to environmental changes over the next century. Modeled responses of the different phytoplankton groups to shoaling mixed layer depths shift the biomass composition more towards diatoms by the mid 21st century. While diatom biomass remains relatively constant in the second half of the 21st century, the haptophyte Phaeocystis antarctica biomass increases as a result of earlier seasonal sea ice melt, allowing earlier availability of low light, in which P. antarctica thrive.
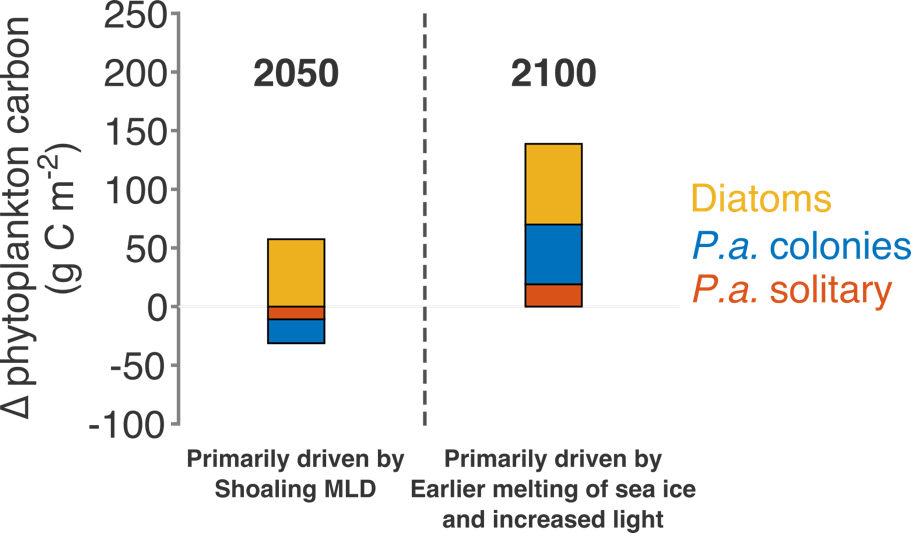
Modeled climate scenarios for the 21st century project phytoplankton composition changes and increases in primary production and carbon export flux, primarily as a result of shoaling mixed layer depths and earlier available low light.
The projected responses of phytoplankton composition, production, and carbon export to climate-related changes can have broad impacts on food web functioning and nutrient cycling, with wide-ranging potential effects as local deep waters are transported out from the Ross Sea continental shelf. Future changes to this ecosystem have taken on a new relevance as the Ross Sea became home this year to the world’s largest Marine Protected Area, designed to protect critical habitat for highly valued species that rely on the Ross Sea food web. Continued coordination between modeling and autonomous observing efforts is needed to provide vital data for global ocean assessments and to improve our understanding of ecosystem dynamics and climate change impacts in this sensitive and important region.
For other relevant work on observing phytoplankton characteristics in the Ross Sea using gliders, please see: https://doi.org/10.1016/j.dsr.2014.06.011.
And for assimilation of bio-optical glider data in the Ross Sea please see: https://doi.org/10.5194/bg-2017-258.
Authors:
Daniel E. Kaufman (VIMS, College of William and Mary)
Marjorie A. M. Friedrichs (VIMS, College of William and Mary)
Walker O. Smith Jr. (VIMS, College of William and Mary)
Eileen E. Hofmann (CCPO, Old Dominion University)
Michael S. Dinniman (CCPO, Old Dominion University)
John C. P. Hemmings (Wessex Environmental Associates; now at the UK Met Office)