Ocean Carbon & Biogeochemistry
Studying marine ecosystems and biogeochemical cycles in the face of environmental change
  • Home
  • About OCB
    • About Us
    • Scientific Breadth
      • Biological Pump
      • Changing Marine Ecosystems
      • Changing Ocean Chemistry
      • Estuarine and Coastal Carbon Fluxes
      • Ocean Carbon Uptake and Storage
      • Ocean Observatories
    • Code of Conduct
    • Get Involved
    • Project Office
    • Scientific Steering Committee
    • OCB committees
      • Ocean Time-series
      • US Biogeochemical-Argo
      • Ocean-Atmosphere Interaction
  • Activities
    • Summer Workshop
    • OCB Webinars
    • Guidelines for OCB Workshops & Activities
    • Topical Workshops
      • CMIP6 Models Workshop
      • Coastal BGS Obs with Fisheries
      • C-saw extreme events workshop
      • Expansion of BGC-Argo and Profiling Floats
      • Fish, fisheries and carbon
      • Future BioGeoSCAPES program
      • GO-BCG Scoping Workshop
      • Lateral Carbon Flux in Tidal Wetlands
      • Leaky Deltas Workshop – Spring 2025
      • Marine CDR Workshop
      • Ocean Nucleic Acids ‘Omics
      • Pathways Connecting Climate Changes to the Deep Ocean
    • Small Group Activities
      • Aquatic Continuum OCB-NACP Focus Group
      • Arctic-COLORS Data Synthesis
      • BECS Benthic Ecosystem and Carbon Synthesis WG
      • Carbon Isotopes in the Ocean Workshop
      • CMIP6 WG
      • Filling the gaps air–sea carbon fluxes WG
      • Fish Carbon WG
      • Meta-eukomics WG
      • mCDR
      • Metaproteomic Intercomparison
      • Mixotrophs & Mixotrophy WG
      • N-Fixation WG
      • Ocean Carbonate System Intercomparison Forum
      • Ocean Carbon Uptake WG
      • OOI BGC sensor WG
      • Operational Phytoplankton Observations WG
      • Phytoplankton Taxonomy WG
    • Other Workshops
    • Science Planning
      • Coastal CARbon Synthesis (CCARS)
      • North Atlantic-Arctic
    • Ocean Acidification PI Meetings
    • Training Activities
      • PACE Hackweek 2025
      • PACE Hackweek 2024
      • PACE Training Activity 2022
  • Science Support
    • Data management and archival
    • Early Career
    • Funding Sources
    • Jobs & Postdocs
    • Meeting List
    • OCB Topical Websites
      • Ocean Fertilization
      • Trace gases
      • US IIOE-2
    • Outreach & Education
    • Promoting your science
    • Student Opportunities
    • OCB Activity Proposal Solicitations
      • Guidelines for OCB Workshops & Activities
    • Travel Support
  • Publications
    • OCB Workshop Reports
    • Science Planning and Policy
    • Newsletter Archive
  • Science Highlights
  • News

Archive for satellite

An unexpected shift to a later phytoplankton bloom in the West Antarctic Peninsula

Posted by mmaheigan 
· Wednesday, May 29th, 2024 

Polar regions are changing: warming, losing sea ice, and experiencing shifts in the phenology of seasonal events. Global models predict that phytoplankton blooms will start earlier in these warming polar environments. What we don’t know is will this be true for all high-latitude regions? Is the timing of phytoplankton growing season moving earlier in the West Antarctic Peninsula as this region experiences climate change?

The authors of a recent paper published in Marine Ecology Progress Series used 25 years of satellite ocean color data to track shifts in bloom phenology—the timing of recurring seasonal events. Contrary to predictions, the results show that the spring bloom start date is shifting later over time. Figure 1 shows that in the waters experiencing seasonal sea ice, from 1997 to 2022, the start and peak date of the phytoplankton growing season are shifting later. However, there is no overall decline in total annual chlorophyll-a, because in the fall (February-April) chlorophyll-a concentrations are increasing over time.

The most likely driver of earlier spring bloom start dates is increased wind mixing. Spring (October-December) wind speed has been increasing over time concurrent with delayed bloom start dates. In an ecosystem with less sea ice than previous decades, more open water exposed to increased wind speed may mix phytoplankton more deeply in spring, delaying the bloom until the onset of summer stratification.

Even though global climate models predict bloom timing will shift earlier with climate change, this may not be the case in specific polar regions like the West Antarctic Peninsula.  Later bloom timing could impact surface ocean carbon uptake, phytoplankton community composition, and ecosystem health. If the timing and composition of blooms is changing, that shifts will affect the food quantity and quality available to krill and higher trophic level organisms.

Author
Jessie Turner (University of Connecticut) @jessiesturner

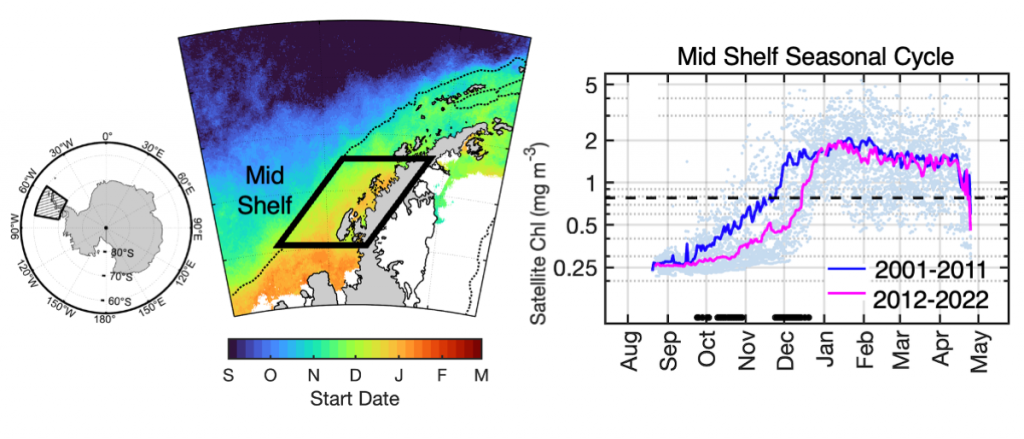
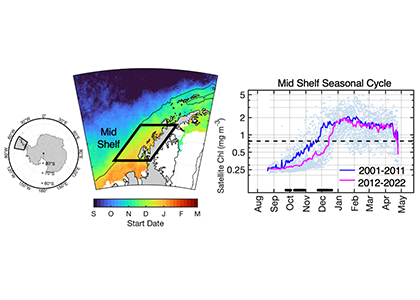
Figure 1: In recent years the timing of the annual phytoplankton bloom in the Mid Shelf region of the West Antarctic Peninsula has shifted: satellite-derived chlorophyll-a concentration in recent years (pink line) shows a significant delayed bloom start date compared to past years (blue line).

Want to improve the spatiotemporal coverage of coastal water clarity? This approach combines high-resolution satellite data with low-cost in situ methods

Posted by mmaheigan 
· Friday, December 1st, 2023 

To maintain marine ecosystem health and human well-being, it is important to understand coastal water quality changes. Water clarity is a key­ component of water quality, which can be measured in situ by tools such as Secchi disks or by satellites with high spatial and temporal coverage. Coastal environments pose unique challenges to remote sensing, sometimes resulting in inaccurate estimates of water clarity.

Figure caption: Maps of model-corrected Landsat-8 derived Secchi depths from monthly clear sky images (2019–2021).

In this study, we couple low-cost in situ methods (Secchi disk depths) with open-access, high-resolution satellite (Landsat-8 and Sentinel-2) data to improve estimates of water clarity in a shallow, turbid lagoon in Virginia, USA. Our model allows the retrieval of water clarity data across an entire water body and when field measurements are unavailable. This approach can be implemented in dynamic coastal water bodies with limited in situ measurements (e.g., as part of routine water quality monitoring). This can improve our understanding of water clarity changes and their drivers to better predict how water quality may change in the future. Improved water clarity predictions can lead to better coastal ecosystem management and human well-being.

Figure caption: Workflow for obtaining Secchi disk depth with l2gen in NASA SeaDAS, bio-optical algorithms, and empirical adjustments.

Authors
Sarah E. Lang (University of Rhode Island’s Graduate School of Oceanography)
Kelly M.A. Luis (Jet Propulsion Laboratory, California Institute of Technology)
Scott C. Doney (University of Virginia)
Olivia Cronin-Golomb (University of Virginia)
Max C.N. Castorani (University of Virginia)


Twitter / Mastodon
@sarah_langsat8 on Twitter
@kelly_luis1 on Twitter
@scottdoney@universeodon.com on Mastodon
@ocronin_golomb on Twitter
@MaxCastorani on Twitter

Net primary production from daily cycles of biomass using Argo floats

Posted by mmaheigan 
· Thursday, August 31st, 2023 

Net primary productivity is a central metric in ocean biogeochemistry that is costly and time-consuming to estimate using traditional water sampling methods. As a result, it is difficult to detect large-scale trends in ocean productivity. While satellite remote-sensing has partially solved this issue, its observations are limited to the top 10 to 40 m of the ocean and require assumptions about the depth profile of productivity.

Figure 1. (A) A map of BGC-Argo float profiles of particle backscattering where only floats deemed to contain samples from all hours of the day over its lifetime were shown. (BE) The hourly median (black points) and standard error (black vertical lines) of carbon biomass, estimated from particle backscatter. Over a 24-hour period, carbon biomass shows a net accumulation during the day (white space) and net loss during the night (gray space). This daily rhythm in biomass was used to infer gross primary productivity from a sinusoidal model fit that assumes productivity scales with light, community respiration is constant, and net community production is zero. (FI) Profiles of net primary productivity, shown with one standard error (shaded region), can be inferred from these daily cycles available for each depth and region. To estimate net primary production, we estimate gross oxygen production from gross primary (carbon) productivity assuming a photosynthetic quotient of 1.4 and that dissolved primary production is a third of total primary production. We then used an empirical ratio (equal to 2.7) to convert gross oxygen production to net primary productivity.

Our study addresses this problem by using BGC-Argo floats to estimate the in situ vertical structure of net primary productivity inferred from daily cycles of carbon biomass (Fig. 1). Although typical floats collect profiles every 5 or 10 days, it is possible to reconstruct the daily cycle in biomass by combining profiles from many floats that measure non-integer profiling frequencies (e.g., 5.2 or 10.2 days). These floats collect each subsequent profile at a different hour of the day, such that all hours of the day are about equally represented over the floats’ lifetimes. Combining enough of these floats’ profiles, the small daily variations in carbon biomass can be detected and used to infer net primary productivity. We demonstrate this for various depths, regions, and seasons.

Our approach provides low-cost, ground-truthed information throughout the water column across large expanses of the ocean and under various conditions (e.g., clouds, sea ice, or polar night), addressing some of the limitations of satellite or ship observations. We argue that the combination of BGC-Argo with satellite imagery will provide an invaluable tool for assessing large-scale trends in net primary production that may arise from climate change and other environmental purturbations.


Authors
Adam Stoer and Katja Fennel (Dalhousie University)

Dalhousie’s Marine Environmental Modelling Group:  memg.ocean.dal.ca

Using BGC-Argo to obtain depth-resolved net primary production

Posted by mmaheigan 
· Friday, July 23rd, 2021 

Net primary production (NPP)—the organic carbon produced by the phytoplankton minus the organic carbon respired by phytoplankton themselves—serves as a major energy source of the marine ecosystem. Traditional methods for measuring NPP rely on ship-based discrete sampling and bottle incubations (e.g., 14C incubation), which introduce potential artifacts and limit the spatial and temporal data coverage of the global ocean. The global distribution of NPP has been estimated using satellite observations, but the satellite remote sensing approach cannot provide direct information at depth.

Figure 1. Panel A. Trajectories of 5 BGC-Argo and 1 SOS-Argo with the initial float deployment locations denoted by filled symbols. The dash-line at 47° N divided the research area into the northern (temperate) and southern (subtropical) regions. Stars indicate ship stations where 14C NPP values were measured during NAAMES cruises and compared with NPP from nearby Argo floats. Panels B and C. Monthly climatologies of net primary production (NPP, mmol m-3 d-1) profiles in the northern and southern regions of the research area, derived from BGC-Argo measurements using the PPM model. The shadings indicate one standard deviation. The red dotted line indicates mixed layer depth (MLD, m), and the yellow dashed line shows euphotic depth (Z1%, m).

To fill this niche, a recent study in Journal of Geophysical Research: Biogeosciences, applied bio-optical measurements from Argo profiling floats to study the year-round depth-resolved NPP of the western North Atlantic Ocean (39° N to 54° N). The authors calculated NPP with two bio-optical models (Carbon-based Productivity Model, CbPM; and Photoacclimation Productivity Model, PPM). A comparison with NPP profiles from 14C incubation measurements showed advantages and limitations of both models. CbPM reproduced the magnitude of NPP in most cases, but had artifacts in the summer (a large NPP peak in the subsurface) due to the subsurface chlorophyll maximum caused by photoacclimation. PPM avoided the artifacts in the summer from photoacclimation, but the magnitude of PPM-derived NPP was smaller than the 14C result. Latitudinally varying NPP were observed, including higher winter NPP/lower summer NPP in the south, timing differences in NPP seasonal phenology, and different NPP depth distribution patterns in the summer months. With a 6-month record of concurrent oxygen and bio-optical measurements from two Argo floats, the authors also demonstrated the ability of Argo profiling floats to obtain estimates of the net community production (NCP) to NPP ratio (f-ratio), ranging from 0.3 in July to -1.0 in December 2016.

This work highlights the utility of float bio-optical profiles in comparison to traditional measurements and indicates that environmental conditions (e.g. light availability, nutrient supply) are major factors controlling the seasonality and spatial (horizontal and vertical) distributions of NPP in the western North Atlantic Ocean.


Authors:
Bo Yang (University of Virginia, UM CIMAS/NOAA AOML)
James Fox (Oregon State University)
Michael J. Behrenfeld (Oregon State University)
Emmanuel S. Boss (University of Maine)
Nils Haëntjens (University of Maine)
Kimberly H. Halsey (Oregon State University)
Steven R. Emerson (University of Washington)
Scott C. Doney (University of Virginia)

Water clarity impacts temperature and biogeochemistry in Chesapeake Bay

Posted by mmaheigan 
· Thursday, December 3rd, 2020 

Estuarine water clarity is determined by suspended materials in the water, including colored dissolved organic matter, phytoplankton, sediment, and detritus. These constituents directly affect temperature because when water is opaque, sunlight heats only the shallowest layers near the surface, but when water is clear, sunlight can penetrate deeper, warming the waters below the surface. Despite the importance of accurately predicting temperature variability, many numerical modeling studies do not adequately parameterize this fundamental relationship between water clarity and temperature.

In a recent study published in Estuaries and Coasts, the authors quantified the impact of a more realistic representation of water clarity in a hydrodynamic-biogeochemical model of the Chesapeake Bay by comparing two simulations: (1) water clarity is constant in space and time for the calculation of solar heating vs. (2) water clarity varies with modeled concentrations of light-attenuating materials. In the variable water clarity simulation (2), the water is more opaque, particularly in the northern region of the Bay. During the spring and summer months, the lower water clarity in the northern Bay is associated with warmer surface temperatures and colder bottom temperatures. Warmer surface temperatures encourage phytoplankton growth and nutrient uptake near the head of the Bay, thus fewer nutrients are transported downstream. These conditions are exacerbated during high-river flow years, when differences in temperature, nutrients, phytoplankton, and zooplankton extend further seaward.

Figure 1: Top row: Difference in the light attenuation coefficient for shortwave heating, kh[m-1] (variable minus constant light attenuation simulation). June, July, and August average for (A) 2001, (B) average of 2001-2005, and (C) 2003; difference in bottom temperatures [oC] (variable minus constant). Bottom row: Difference in June, July, and August average bottom temperature for (D) 2001, (E) average of 2001-2005, and (F) 2003. Data for 2001 are representative of low river discharge, and 2003 are representative high river discharge years.

This work demonstrates that a constant light attenuation scheme for heating calculations in coupled hydrodynamic-biogeochemical models underestimates temperature variability, both temporally and spatially. This is an important finding for researchers who use models to predict future temperature variability and associated impacts on biogeochemistry and species habitability.


Authors:
Grace E. Kim (NASA, Goddard Space Flight Center)
Pierre St-Laurent (VIMS, William & Mary)
Marjorie A.M. Friedrichs (VIMS, William & Mary)
Antonio Mannino (NASA, Goddard Space Flight Center)

Tiny phytoplankton seen from space

Posted by mmaheigan 
· Thursday, November 19th, 2020 

Picophytoplankton, the smallest phytoplankton on Earth, are dominant in over half of the global surface ocean, growing in low-nutrient “ocean deserts” where diatoms and other large phytoplankton have difficult to thrive. Despite their small size, picophytoplankton collectively account for well over 50% of primary production in oligotrophic waters, thus playing a major role in sustaining marine food webs.

In a recent paper published in Optics Express, the authors use satellite-detected ocean color (namely remote-sensing reflectance, Rrs(λ)) and sea surface temperature to estimate the abundance of the three picophytoplankton groups—the cyanobacteria Prochlorococcus and Synechococcus, and autotrophic picoeukaryotes. The authors analysed Rrs(λ) spectra using principal component analysis, and principal component scores and SST were used in the predictive models. Then, they trained and independently evaluated the models with in-situ data from the Atlantic Ocean (Atlantic Meridional Transect cruises). This approach allows for the satellite detection of the succession of species across ocean oligotrophic ecosystem boundaries, where these cells are most abundant (Figure 1).

Figure 1. Cell abundances of the three major picophytoplankton groups (the cyanobacteria Prochlorococcus and Synechococcus, and a collective group of autotrophic picoeukaryotes) in surface waters of the Atlantic Ocean. Abundances are shown for the dominant group in terms of total biovolume (converted from cell abundance).

Since these organisms can be used as proxies for marine ecosystem boundaries, this method can be used in studies of climate and ecosystem change, as it allows a synoptic observation of changes in picophytoplankton distributions over time and space. For exploring spectral features in hyperspectral Rrs(λ) data, the implementation of this model using data from future hyperspectral satellite instruments such as NASA PACE’s Ocean Color Instrument (OCI) will extend our knowledge about the distribution of these ecologically relevant phytoplankton taxa. These observations are crucial for broad comprehension of the effects of climate change in the expansion or shifts in ocean ecosystems.


Authors:
Priscila K. Lange (NASA Goddard Space Flight Center / Universities Space Research Association / Blue Marble Space Institute of Science)
Jeremy Werdell (NASA Goddard Space Flight Center)
Zachary K. Erickson (NASA Goddard Space Flight Center)
Giorgio Dall’Olmo (Plymouth Marine Laboratory)
Robert J. W. Brewin (University of Exeter)
Mikhail V. Zubkov (Scottish Association for Marine Science)
Glen A. Tarran (Plymouth Marine Laboratory)
Heather A. Bouman (University of Oxford)
Wayne H. Slade (Sequoia Scientific, Inc)
Susanne E. Craig (NASA Goddard Space Flight Center / Universities Space Research Association)
Nicole J. Poulton (Bigelow Laboratory for Ocean Sciences)
Astrid Bracher (Alfred-Wegener-Institute Helmholtz Center for Polar and Marine Research / University of Bremen)
Michael W. Lomas (Bigelow Laboratory for Ocean Sciences)
Ivona Cetinić (NASA Goddard Space Flight Center / Universities Space Research Association)


Profiling floats reveal fate of Southern Ocean phytoplankton stocks

Posted by mmaheigan 
· Tuesday, September 1st, 2020 

More observations are needed to constrain the relative roles of physical (advection), biogeochemical (downward export), and ecological (grazing and biological losses) processes in driving the fate of phytoplankton blooms in Southern Ocean waters. In a recent paper published in Nature Communications, authors used seven Biogeochemical Argo (BGC-Argo) floats that vertically profiled the upper ocean every ten days as they drifted for three years across the remote Sea Ice Zone of the Southern Ocean. Using the floats’ biogeochemical sensors (chlorophyll, nitrate, and backscattering) and regional ratios of nitrate consumption:chlorophyll synthesis, the authors developed a new approach to remotely estimate the fate of the phytoplankton stocks, enabling calculations of herbivory and of downward carbon export. The study revealed that the major fate of phytoplankton biomass in this region is grazing, which consumes ~90% of stocks. The remaining 10% is exported to depth. This pattern was consistent throughout the entire sea ice zone where the floats drifted, from 60°-69° South.

Figure Caption: Southern Ocean Chlorophyll a climatology and floats’ trajectories (top panel). Total losses of Chlorophyll a (including grazing and phytodetritus export, left panel). Phytodetritus export (right panel).


This study region comprises two of the three major krill growth and development areas—the eastern Weddell and King Haakon VII Seas and Prydz Bay and the Kerguelen Plateau—so the observed grazing was probably due to Antarctic krill, underscoring their pivotal importance in this ecosystem. Building upon the greater understanding of ocean ecosystems via satellite ocean colour development in the 1990s, BGC-Argo floats and this new approach will allow remote monitoring of the different fates of phytoplankton stocks and insights into the status of the ecosystem.


Authors:
Sebastien Moreau (Norwegian Polar Institute, Tromsø, Norway)
Philip Boyd (Institute for Marine and Antarctic Studies, Hobart, Australia)
Peter Strutton (Institute for Marine and Antarctic Studies, Hobart, Australia)

A close-up view of biomass controls in Southern Ocean eddies

Posted by mmaheigan 
· Thursday, August 20th, 2020 

Southern Ocean biological productivity is instrumental in regulating the global carbon cycle. Previous correlative studies associated widespread mesoscale activity with anomalous chlorophyll levels. However, eddies simultaneously modify both the physical and biogeochemical environments via several competing pathways, making it difficult to discern which mechanisms are responsible for the observed biological anomalies within them. Two recently published papers track Southern Ocean eddies in a global, eddy-resolving, 3-D ocean simulation. By closely examining eddy-induced perturbations to phytoplankton populations, the authors are able to explicitly link eddies to co-located biological anomalies through an underlying mechanistic framework.

Figure caption: Simulated Southern Ocean eddies modify phytoplankton division rates in different directions of depending on the polarity of the eddy and background seasonal conditions. During summer anticyclones (top right panel) deliver extra iron from depth via eddy-induced Ekman pumping and fuel faster phytoplankton division rates. During winter (bottom right panel) the extra iron supply is eclipsed by deeper mixed layer depths and elevated light limitation resulting in slower division rates. The opposite occurs in cyclones.

In the first paper, the authors observe that eddies primarily affect phytoplankton division rates by modifying the supply of iron via eddy-induced Ekman pumping. This results in elevated iron and faster phytoplankton division rates in anticyclones throughout most of the year. However, during deep mixing winter periods, exacerbated light stress driven by anomalously deep mixing in anticyclones can dominate elevated iron and drive division rates down. The opposite response occurs in cyclones.

The second paper tracks how eddy-modified division rates combine with eddy-modified loss rates and physical transport to produce anomalous biomass accumulation. The biomass anomaly is highly variable, but can exhibit an intense seasonal cycle, in which cyclones and anticyclones consistently modify biomass in different directions. This cycle is most apparent in the South Pacific sector of the Antarctic Circumpolar Current, a deep mixing region where the largest biomass anomalies are driven by biological mechanisms rather than lateral transport mechanisms such as eddy stirring or propagation.

It is important to remember that the correlation between chlorophyll and eddy activity observable from space can result from a variety of physical and biological mechanisms. Understanding the nuances of how these mechanisms change regionally and seasonally is integral in both scaling up local observations and parameterizing coarser, non-eddy resolving general circulation models with embedded biogeochemistry.

Authors:
Tyler Rohr (Australian Antarctic Partnership Program, previously at MIT/WHOI)
Cheryl Harrison (University of Texas Rio Grande Valley)
Matthew Long (National Center for Atmospheric Research)
Peter Gaube (University of Washington)
Scott Doney (University of Virginia)

Chasing Sargassum in the Atlantic Ocean

Posted by mmaheigan 
· Wednesday, March 25th, 2020 

The pelagic brown alga Sargassum forms a habitat that hosts a rich diversity of life, including other algae, crustaceans, fish, turtles, and birds in both the Gulf of Mexico and the area of the Atlantic Ocean known as the Sargasso Sea. However, high abundances of Sargassum have been appearing in the tropical Atlantic, in some cases 3,000 miles away from the Sargasso Sea. This is a new phenomenon. Nearly every year since 2011, thick mats of Sargassum have blanketed the coastlines of many countries in tropical Africa and the Americas. When masses of Sargassum wash ashore, the seaweed rots, attracts insects, and repels beachgoers, with adverse ecological and socioeconomic effects. A new study in Progress in Oceanography sheds light on the mystery.

Figure 1. The hypothesized route of Sargasso Sea Sargassum to the tropical Atlantic and the Caribbean Sea. The solid black lines indicate the climatological surface flow, the dashed black lines indicate areas where there was variability from the average conditions.

The authors analyzed reams of satellite data and used computer models of the Earth’s winds and ocean currents to try to understand why these large mats started to arrive in coastal areas in 2011. A strengthening and southward shift of the westerlies in the winter of 2009-2010 caused ocean currents to move the Sargassum toward the Iberian Peninsula, then southward in the Canary Current along Africa, where it entered the tropics by the middle of 2010 (Figure 1). The tropical Atlantic provided ample sunlight, warmer sea temperatures, and nutrients for the algae to flourish. In 2011, Sargassum spread across the entire tropical Atlantic in a massive belt north of the Equator, along the Intertropical Convergence Zone (ITCZ), and these blooms have appeared nearly every year since. Utilizing international oceanographic studies done in the Atlantic since the 1960s, and multiple satellite sensors combined with Sargassum distribution patterns, the authors discovered that the trade winds aggregate the Sargassum under the ITCZ and mix the water deep enough to bring new nutrients to the surface and sustain the bloom.

Improved understanding and predictive capacity of Sargassum bloom occurrence will help us better constrain and quantify its impacts on our ecosystems, which can inform management of valuable fisheries and protected species.


Authors:
Elizabeth Johns (NOAA AMOL)
Rick Lumpkin (NOAA AMOL)
Nathan Putman (LGL Ecological Research Associates)
Ryan Smith (NOAA AMOL)
Frank Muller-Karger (University of South Florida)
Digna Rueda-Roa (University of South Florida)
Chuanmin Hu (University of South Florida)
Mengqiu Wang (University of South Florida)
Maureen Brooks (University of Maryland Center for Environmental Science)
Lewis Gramer (NOAA AMOL and University of Miami)
Francisco Werner (NOAA Fisheries)

A new tidal non-photochemical quenching model reveals obscured variability in coastal chlorophyll fluorescence

Posted by mmaheigan 
· Tuesday, October 15th, 2019 

Although chlorophyll fluorescence is widely-used as a proxy for chlorophyll concentration, sunlight exposure makes fluorescence measurements inaccurate through a process called non-photochemical quenching, limiting its proxy accuracy during daylight hours. In the open ocean, where time and space scales are large relative to variability in phytoplankton concentration, daytime chlorophyll fluorescence—necessary for satellite algorithm validation and for understanding diurnal variability in phytoplankton abundance—can be estimated by averaging across successive nighttime, unquenched values. In coastal waters, where semidiurnal tidal advection drives small scale patchiness and short temporal variability, successive nighttime observations do not accurately represent the intervening daytime. Thus, it is necessary to apply a non-photochemical quenching correction that accounts for the additional effect of tidal advection.

In a recent study in L&O Methods, authors developed a model that uses measurements of tidal velocity to correct daytime chlorophyll fluorescence for non-photochemical quenching and tidal advection. The model identifies high tide and low tide endmember populations of phytoplankton from tidal velocity, and estimates daytime chlorophyll fluorescence as a conservative interpolation between endmember fluorescence at those tidal maxima and minima (Figure 1). Rather than removing nearly 12 hours’ worth of hourly chlorophyll fluorescence observations (i.e., all of the daytime observations) as was previously necessary, this model recovers them. The model output performs more accurately as a proxy for chlorophyll concentration than raw daytime chlorophyll fluorescence measurements by a factor of two, and enables tracking of phytoplankton populations with chlorophyll fluorescence in a Lagrangian sense from Eulerian measurements. Finally, because the model assumes conservation, periods of non-conservative variability are revealed by comparison between model and measurements, helping to elucidate controls on variability in phytoplankton abundance in coastal waters.

Figure 1: Model (light blue line) is a tidal interpolation between high tide (blue points) and low tide (red points) phytoplankton endmembers. The model represents nighttime, unquenched chlorophyll fluorescence measurements well (black points), while daytime, quenched measurements are visibly reduced (gray points).

This result is a critical achievement, as it enables the use of daytime chlorophyll fluorescence, which increases the temporal resolution of coastal chlorophyll fluorescence measurements, and also provides a mechanism for satellite validation of the ocean color chlorophyll data product in coastal waters. The model’s capacity to accurately simulate the pervasive effect of non-photochemical quenching makes it a vital tool for any researcher or coastal water manager measuring chlorophyll fluorescence. This model will help to provide new insights on the movement of and controls on phytoplankton populations across the land-ocean continuum.

Authors:
Luke Carberry (University of California, Santa Barbara)
Collin Roesler (Bowdoin College)
Susan Drapeau (Bowdoin College)


Next Page »

Filter by Keyword

abundance acidification additionality advection africa air-sea air-sea interactions algae alkalinity allometry ammonium AMO AMOC anoxic Antarctic Antarctica anthro impacts anthropogenic carbon anthropogenic impacts appendicularia aquaculture aquatic continuum aragonite saturation arctic Argo argon arsenic artificial seawater Atlantic atmospheric CO2 atmospheric nitrogen deposition authigenic carbonates autonomous platforms bacteria bathypelagic BATS BCG Argo benthic bgc argo bio-go-ship bio-optical bioavailability biogeochemical cycles biogeochemical models biogeochemistry Biological Essential Ocean Variables biological pump biophysics bloom blue carbon bottom water boundary layer buffer capacity C14 CaCO3 calcification calcite carbon carbon-climate feedback carbon-sulfur coupling carbonate carbonate system carbon budget carbon cycle carbon dioxide carbon export carbon fluxes carbon sequestration carbon storage Caribbean CCA CCS changing marine chemistry changing marine ecosystems changing marine environments changing ocean chemistry chemical oceanographic data chemical speciation chemoautotroph chesapeake bay chl a chlorophyll circulation CO2 coastal and estuarine coastal darkening coastal ocean cobalt Coccolithophores commercial community composition competition conservation cooling effect copepod copepods coral reefs CTD currents cyclone daily cycles data data access data assimilation database data management data product Data standards DCM dead zone decadal trends decomposers decomposition deep convection deep ocean deep sea coral denitrification deoxygenation depth diatoms DIC diel migration diffusion dimethylsulfide dinoflagellate dinoflagellates discrete measurements distribution DOC DOM domoic acid DOP dust DVM ecology economics ecosystem management ecosystems eddy Education EEZ Ekman transport emissions ENSO enzyme equatorial current equatorial regions ESM estuarine and coastal carbon fluxes estuary euphotic zone eutrophication evolution export export fluxes export production extreme events faecal pellets fecal pellets filter feeders filtration rates fire fish Fish carbon fisheries fishing floats fluid dynamics fluorescence food webs forage fish forams freshening freshwater frontal zone functional role future oceans gelatinous zooplankton geochemistry geoengineering geologic time GEOTRACES glaciers gliders global carbon budget global ocean global warming go-ship grazing greenhouse gas greenhouse gases Greenland ground truthing groundwater Gulf of Maine Gulf of Mexico Gulf Stream gyre harmful algal bloom high latitude human food human impact human well-being hurricane hydrogen hydrothermal hypoxia ice age ice cores ice cover industrial onset inland waters in situ inverse circulation ions iron iron fertilization iron limitation isotopes jellies katabatic winds kelvin waves krill kuroshio lab vs field land-ocean continuum larvaceans lateral transport LGM lidar ligands light light attenuation lipids low nutrient machine learning mangroves marine carbon cycle marine heatwave marine particles marine snowfall marshes mCDR mechanisms Mediterranean meltwater mesopelagic mesoscale mesoscale processes metagenome metals methane methods microbes microlayer microorganisms microplankton microscale microzooplankton midwater mitigation mixed layer mixed layers mixing mixotrophs mixotrophy model modeling model validation mode water molecular diffusion MPT MRV multi-decade n2o NAAMES NCP nearshore net community production net primary productivity new ocean state new technology Niskin bottle nitrate nitrogen nitrogen cycle nitrogen fixation nitrous oxide north atlantic north pacific North Sea nuclear war nutricline nutrient budget nutrient cycles nutrient cycling nutrient limitation nutrients OA observations ocean-atmosphere ocean acidification ocean acidification data ocean alkalinity enhancement ocean carbon storage and uptake ocean carbon uptake and storage ocean color ocean modeling ocean observatories ocean warming ODZ oligotrophic omics OMZ open ocean optics organic particles oscillation outwelling overturning circulation oxygen pacific paleoceanography PAR parameter optimization parasite particle flux particles partnerships pCO2 PDO peat pelagic PETM pH phenology phosphate phosphorus photosynthesis physical processes physiology phytoplankton PIC piezophilic piezotolerant plankton POC polar polar regions policy pollutants precipitation predation predator-prey prediction pressure primary productivity Prochlorococcus productivity prokaryotes proteins pteropods pycnocline radioisotopes remineralization remote sensing repeat hydrography residence time resource management respiration resuspension rivers rocky shore Rossby waves Ross Sea ROV salinity salt marsh satellite scale seafloor seagrass sea ice sea level rise seasonal seasonality seasonal patterns seasonal trends sea spray seawater collection seaweed secchi sediments sensors sequestration shelf ocean shelf system shells ship-based observations shorelines siderophore silica silicate silicon cycle sinking sinking particles size SOCCOM soil carbon southern ocean south pacific spatial covariations speciation SST state estimation stoichiometry subduction submesoscale subpolar subtropical sulfate surf surface surface ocean Synechococcus technology teleconnections temperate temperature temporal covariations thermocline thermodynamics thermohaline thorium tidal time-series time of emergence titration top predators total alkalinity trace elements trace metals trait-based transfer efficiency transient features trawling Tris trophic transfer tropical turbulence twilight zone upper ocean upper water column upwelling US CLIVAR validation velocity gradient ventilation vertical flux vertical migration vertical transport warming water clarity water mass water quality waves weathering western boundary currents wetlands winter mixing zooplankton

Copyright © 2025 - OCB Project Office, Woods Hole Oceanographic Institution, 266 Woods Hole Rd, MS #25, Woods Hole, MA 02543 USA Phone: 508-289-2838  •  Fax: 508-457-2193  •  Email: ocb_news@us-ocb.org

link to nsflink to noaalink to WHOI

Funding for the Ocean Carbon & Biogeochemistry Project Office is provided by the National Science Foundation (NSF) and the National Aeronautics and Space Administration (NASA). The OCB Project Office is housed at the Woods Hole Oceanographic Institution.