One factor that limits our capacity to quantify the ocean biological carbon pump is uncertainty associated with the physical injection of particulate (POC) and dissolved (DOC) organic carbon to the ocean interior. It is challenging to integrate the effects of these pumps, which operate at small spatial (<100 km) and temporal (<1 month) scales. Previous observational and fine-scale modeling studies have thus far been unable to quantify these small-scale effects. In a recent study published in Global Biogeochemical Cycles, authors explored the influence of these physical carbon pumps relative to sinking (gravity-driven) particles on annual and regional scales using a high-resolution (2 km) biophysical model of the North Atlantic that simulates intense eddy-driven subduction hotspots that are consistent with observations.
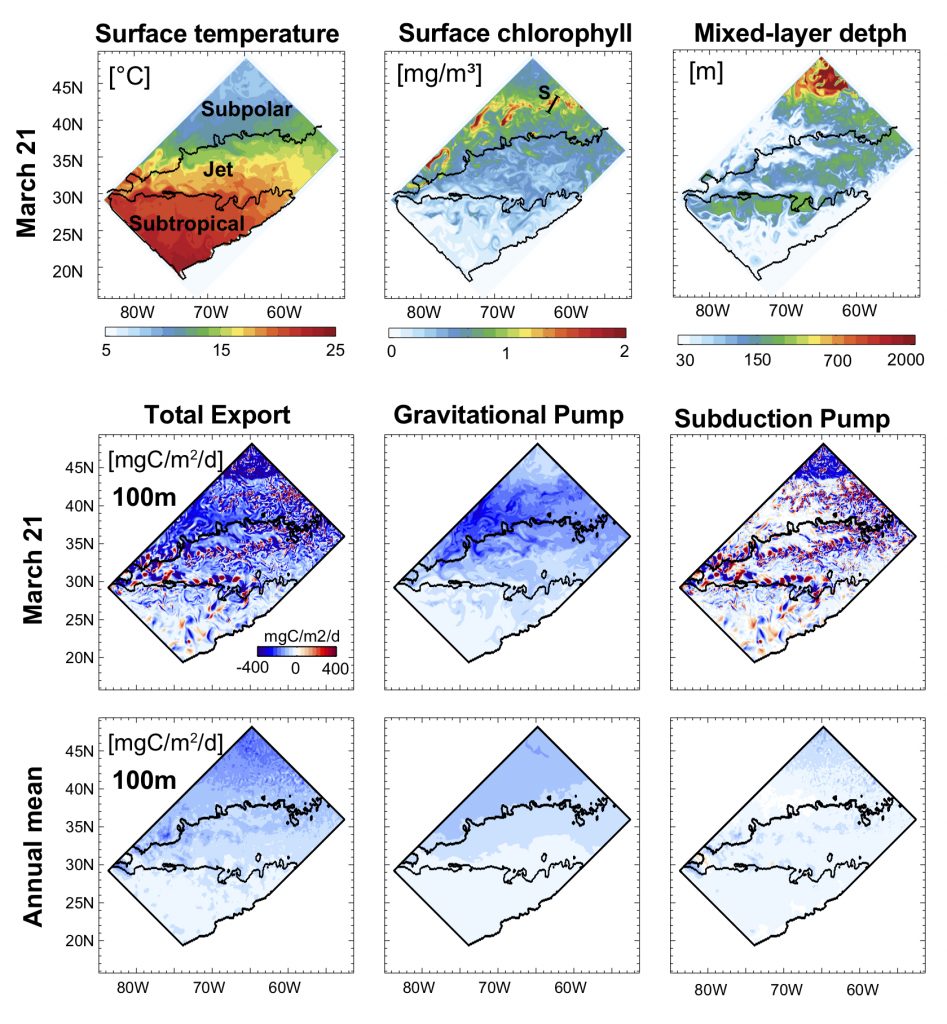
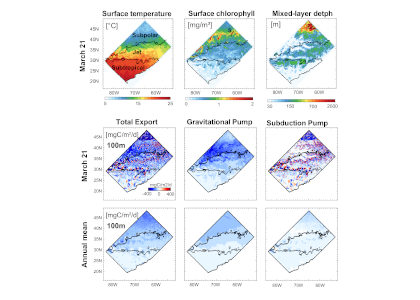
Figure 1: North Atlantic idealized double gyre ocean biophysical model. Top: Sea surface temperature, surface chlorophyll and mixed-layer depth during the spring bloom (March 21). Bottom: total export of organic carbon (POC+DOC) at 100 and individual contributions from the gravitational (particle sinking) and subduction (mixing, eddy advection and Ekman pumping) pumps for one day during the spring bloom (March 21) and averaged annually. Physical subduction hotspots visible on the daily export contribute little to the annual export due to strong compensation of upward and downward motions.
The authors showed that eddy dynamics can transport carbon below the mixed-layer (500-1000 m depth), but this mechanism contributes little (<5%) to annual export at the basin scale due to strong compensation between upward and downward fluxes (Figure 1). Additionally, the authors evidenced that small-scale mixing events intermittently export large amounts of suspended DOC and POC.
These results underscore the need to expand the traditional view of the mixed-layer carbon pump (wintertime export of DOC) to include downward mixing of POC associated with short-lived springtime mixing events, as well as eddy-driven subduction, which can contribute to longer-term ocean carbon storage. High-resolution measurements are needed to validate these model results and constrain the magnitude of the compensation between upward and downward carbon transport by small-scale physical processes.
Authors:
Laure Resplandy (Princeton University)
Marina Lévy (Sorbonne Université)
Dennis J. McGillicuddy Jr. (WHOI)