Approximately one million years ago, Earth’s periodic ice ages increased in strength and duration, shifting from a 41,000-year pacing to a 100,000-year pacing, both linked to Earth’s orbital variations. The causes of this climate shift known as the mid-Pleistocene transition (MPT) have been debated for decades.
A recent study in Nature Geoscience addresses how the ocean carbon cycle contributed to the MPT by quantifying the carbon inventory of the deep Atlantic Ocean during this time. Using trace element and isotope ratios of fossil marine foraminifera, the authors demonstrate that an abrupt weakening of deep ocean overturning circulation between 950,000 and 900,000 years ago occurred alongside a pronounced increase in carbon content of the deep Atlantic Ocean. This study revealed significantly higher carbon concentrations in the deep North and South Atlantic basins during the post-MPT 100,000-year ice ages relative to the 41,000-year ice ages prior to the MPT (Figure 1).
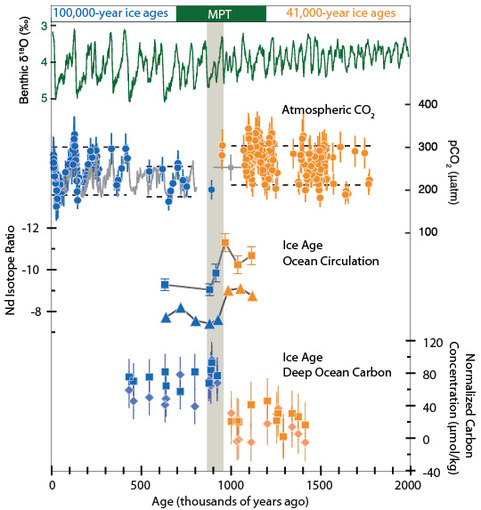
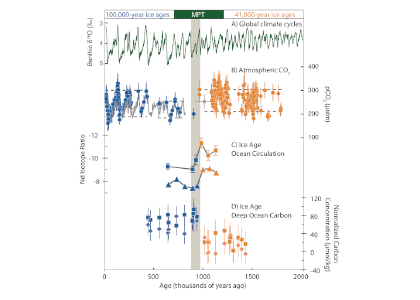
Figure 1 caption: The last two million years of glacial cycles, with present day on left and age increasing from left to right. Orange data are from 41,000-year ice ages; blue data are from,100,000-year ice ages. (A) Glacial-interglacial cycles demonstrated in benthic oxygen isotopes (green), with warmer interglacials up and peak ice ages downward. (B) Atmospheric CO2 from ice core measurements (gray lines) and reconstructed from boron isotopes (circles) (C), Peak ice age neodymium isotope ratios indicating strength of density-driven deep ocean circulation (squares and triangles indicate two different sediment cores). (D) Peak ice age deep ocean carbon content (squares and diamonds indicate two independent reconstructions from the same South Atlantic sediment core).
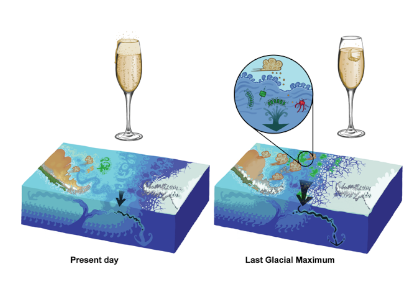
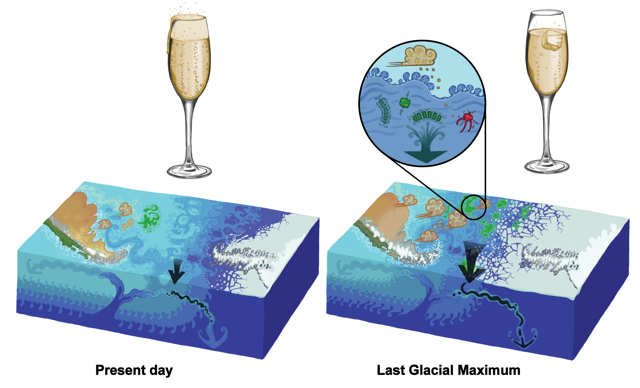
These data indicate that since 950,000 years ago, the deep Atlantic Ocean has stored an extra 50 billion tons of carbon during peak ice ages. This study hypothesizes that this extra carbon was sequestered from the atmosphere via a feedback between Antarctic ice sheet extent and the efficiency of air-sea carbon exchange in the Southern Ocean. The authors propose that intensification of ice ages one million years ago was closely linked to enhanced ocean carbon storage and resultant lowering of atmospheric CO2 levels.
While paleoclimatologists consider the MPT to be the most recent major climate transition, the magnitude of carbon perturbation at the MPT pales in comparison to today’s human emissions. Today, humans produce 50 billion tons of carbon in only five years. Studies of the carbon cycle across past climate transitions like the MPT provide key insights on how future climate may respond to today’s carbon cycle disruption.
Authors
Jesse Farmer (LDEO Columbia University; now at Princeton University and Max Planck Institute for Chemistry)
Bärbel Hönisch, Laura Haynes, Maureen Raymo, Steven Goldstein, Maayan Yehudai, Joohee Kim (LDEO Columbia University)
Heather Ford (Queen Mary University of London)
Dick Kroon, Simon Jung, Dave Bell (University of Edinburgh)
Maria Jaume-Seguí, Leopoldo Pena (University of Barcelona)
See this related popular article and video in the Washington Post.