Ocean Carbon & Biogeochemistry
Studying marine ecosystems and biogeochemical cycles in the face of environmental change
  • Home
  • About OCB
    • About Us
    • Scientific Breadth
      • Biological Pump
      • Changing Marine Ecosystems
      • Changing Ocean Chemistry
      • Estuarine and Coastal Carbon Fluxes
      • Ocean Carbon Uptake and Storage
      • Ocean Observatories
    • Code of Conduct
    • Get Involved
    • Project Office
    • Scientific Steering Committee
    • OCB committees
      • Ocean Time-series
      • US Biogeochemical-Argo
      • Ocean-Atmosphere Interaction
  • Activities
    • Summer Workshop
    • OCB Webinars
    • Guidelines for OCB Workshops & Activities
    • Topical Workshops
      • CMIP6 Models Workshop
      • Coastal BGS Obs with Fisheries
      • C-saw extreme events workshop
      • Expansion of BGC-Argo and Profiling Floats
      • Fish, fisheries and carbon
      • Future BioGeoSCAPES program
      • GO-BCG Scoping Workshop
      • Lateral Carbon Flux in Tidal Wetlands
      • Leaky Deltas Workshop – Spring 2025
      • Marine CDR Workshop
      • Ocean Nucleic Acids ‘Omics
      • Pathways Connecting Climate Changes to the Deep Ocean
    • Small Group Activities
      • Aquatic Continuum OCB-NACP Focus Group
      • Arctic-COLORS Data Synthesis
      • BECS Benthic Ecosystem and Carbon Synthesis WG
      • Carbon Isotopes in the Ocean Workshop
      • CMIP6 WG
      • Filling the gaps air–sea carbon fluxes WG
      • Fish Carbon WG
      • Meta-eukomics WG
      • mCDR
      • Metaproteomic Intercomparison
      • Mixotrophs & Mixotrophy WG
      • N-Fixation WG
      • Ocean Carbonate System Intercomparison Forum
      • Ocean Carbon Uptake WG
      • OOI BGC sensor WG
      • Operational Phytoplankton Observations WG
      • Phytoplankton Taxonomy WG
    • Other Workshops
    • Science Planning
      • Coastal CARbon Synthesis (CCARS)
      • North Atlantic-Arctic
    • Ocean Acidification PI Meetings
    • Training Activities
      • PACE Hackweek 2025
      • PACE Hackweek 2024
      • PACE Training Activity 2022
  • Science Support
    • Data management and archival
    • Early Career
    • Funding Sources
    • Jobs & Postdocs
    • Meeting List
    • OCB Topical Websites
      • Ocean Fertilization
      • Trace gases
      • US IIOE-2
    • Outreach & Education
    • Promoting your science
    • Student Opportunities
    • OCB Activity Proposal Solicitations
      • Guidelines for OCB Workshops & Activities
    • Travel Support
  • Publications
    • OCB Workshop Reports
    • Science Planning and Policy
    • Newsletter Archive
  • Science Highlights
  • News

Archive for Atlantic

Identifying the water mass composition of a sample has never been so easy!

Posted by mmaheigan 
· Thursday, August 31st, 2023 

When we collect seawater in any point of the ocean, we are collecting a mix of water masses from different origin that traveled until there keeping their salinity and temperature properties. The Atlantic Ocean is likely the most complex basin in term of water masses containing more than 15 in its depths. Some of them were “born” in the North Atlantic Ocean, others in the Southern Ocean, even in the Mediterranean Sea! And when we collect a seawater sample we can know which water masses are there, where they come from, what happened to each of them during their journey to us, what story can they tell us.

The variation of any non-conservative property (such as dissolved organic carbon or nutrients) in the deep open ocean depends on the mixing of those water masses and on the biogeochemical processes affecting it (such as heterotrophic respiration). But the effect of the water mass mixing is usually very high, so in order to study the biogeochemical processes, it is necessary to remove that effect.

On the other hand, estimating the contribution of the water masses composing a sample is useful to trace the distribution of each water mass identifying the depth of maximum water mass contribution or the depth-range where the water mass is dominant contributing > 50%. Ocean biogeochemists and microbiologists can get more out of their data estimating the impact of water mass mixing on the variability of any chemical (e.g. inorganic nutrients and dissolved organic carbon) or biological (e.g. prokaryotic heterotrophic abundance and production) property.

Knowing the contribution of each water mass to each sample was not an easy task and required expertise on the origin, circulation and mixing patterns of the water masses present in the study area. This could be even harder in very complex oceanic basin such as the deep Atlantic Ocean. The most commonly used methodology is the Optimum Multi-Parameter (OMP) analysis that was first applied by Tomczak in 1981. However, this methodology is time consuming and requires availability of a large set of quality-controlled chemical variables (e.g. nutrients, oxygen,..) together with a deep knowledge of the oceanography of the studied area. Those chemical variables are not always available or do not have the required quality by contrast to potential temperature and salinity that are high standard core variables in any cruise or database. In a recent research article, we applied multi-regression machine learning models to solve ocean water mass mixing. The models tested were trained using the solutions from OMP analyses previously applied to samples from cruises in the Atlantic Ocean. Extremely Randomized Trees algorithm yielded the highest score (R2 = 0.9931; mse = 0.000227). The model allows solving the mixing of water masses in the Atlantic Ocean using potential temperature, salinity, latitude, longitude and depth. Potential temperature and salinity are the most commonly collected and curated variables in oceanography both from oceanographic cruises and autonomous vehicles (e.g. ARGO) avoiding the use of less commonly measured chemical variables which also require longer and time-consuming analyses of both the water samples and the data.

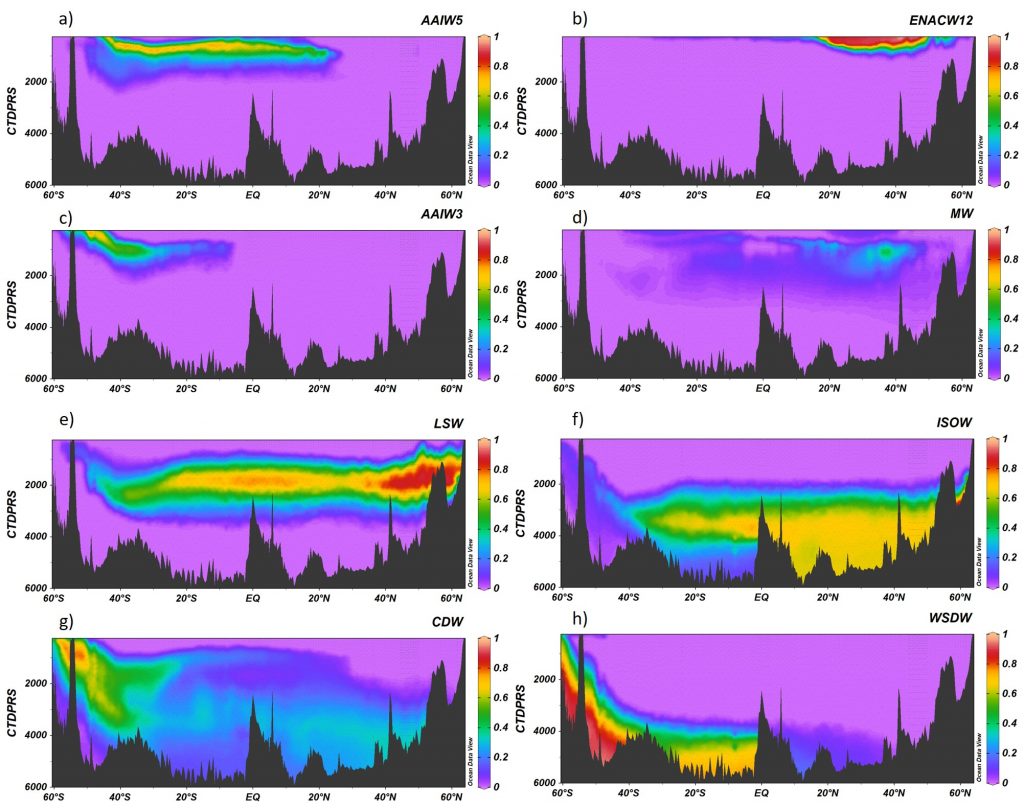
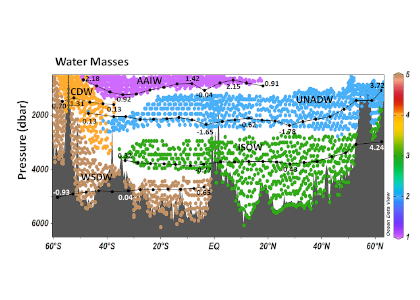
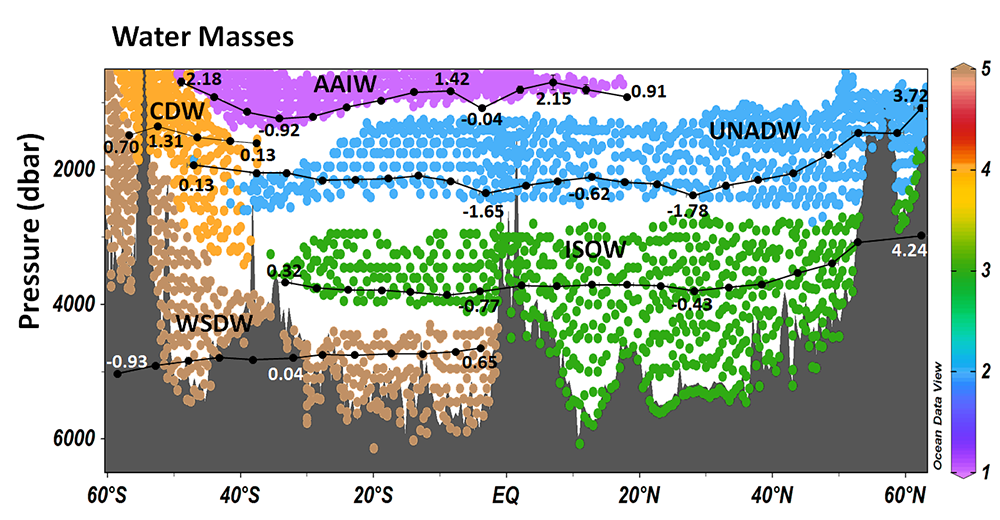
Figure 1. A16 section for the contribution of the water masses (A) AAIW5, (B) ENACW12, (C) AAIW3, (D) MW, (E) LSW, (F) ISOW, (G) CDW and (H) WSDW obtained with the Extremely Randomized Trees algorithm. Ocean Data View software (Schlitzer, 2015).

We also provide the code with instructions where any user can easily introduce the required variables (latitude, longitude, depth, temperature and salinity) of the chosen Atlantic samples and obtain the water mass proportion of each one in a fast and easy way. Actually, it would allow the user to obtain this information in real time during a cruise.

New research using other methods like OMP and its variants can be incorporated to the existing model increasing its accuracy and prediction capacity. Help us to improve the model and increase its spatial resolution!

Ocean biogeochemists and microbiologists can benefit from this tool even if they do not have a deep knowledge of the oceanography of the studied area. Identifying the water masses composition of a sample has never been so easy!

Author
Cristina Romera-Castillo (Instituto de Ciencias del Mar-CSIC, Barcelona, Spain)

Twitter: @crisrcas

Hydrostatic pressure substantially reduces deep-sea microbial activity

Posted by mmaheigan 
· Thursday, May 11th, 2023 

Deep sea microbial communities are experiencing increasing hydrostatic pressure with depth. It is known that some deep sea microbes require high hydrostatic pressure for growth, but most measurements of deep-sea microbial activity have been performed under atmospheric pressure conditions.

In a recent paper published in Nature Geoscience, the authors used a new device coined ‘In Situ Microbial Incubator’ (ISMI) to determine prokaryotic heterotrophic activity under in situ conditions. They compared microbial activity in situ with activity under atmospheric pressure at 27 stations from 175 to 4000 m depths in the Atlantic, Pacific, and the Southern Ocean. The bulk of heterotrophic activity under in situ pressure is always lower than under atmospheric pressure conditions and is increasingly inhibited with increasing hydrostatic pressure. Single-cell analysis revealed that deep sea prokaryotic communities consist of a small fraction of pressure-loving (piezophilic) microbes while the vast majority is pressure-insensitive (piezotolerant). Surprisingly, the piezosensitive fraction (~10% of the total community) responds with a more than 100-fold increase of activity upon depressurization. In the microbe proteomes, the authors uncovered taxonomically characteristic survival strategies in meso- and bathypelagic waters. These findings indicate that the overall heterotrophic microbial activity in the deep sea is substantially lower than previously assumed, which implies major impacts on the carbon budget of the ocean’s interior.

Figure caption: Deep sea microbial activity under varying pressure. (a) In situ bulk leucine incorporation rates normalized to rates obtained at atmospheric pressure conditions. (b) A microscopic view of a 2000 m sample collected in the Atlantic and incubated under atmospheric pressure conditions. The black halos around the cells are silver grains corresponding to their activities. The highly active cells (indicated by arrows) were rarely found in in situ pressure incubations. (c) Depth-related changes in the metaproteome of three abundant deep sea bacterial taxa (Alteromonas, Bacteroidetes, and SAR202). The number indicates shared and unique up- and down-regulated proteins in different depth zones.

Authors
Chie Amano (University of Vienna, Austria)
Zihao Zhao (University of Vienna, Austria)
Eva Sintes (University of Vienna, IEO-CSIC, Spain)
Thomas Reinthaler (University of Vienna, Austria)
Julia Stefanschitz (University of Vienna, Austria)
Murat Kisadur (University of Vienna, Austria)
Motoo Utsumi (University of Tsukuba, Japan)
Gerhard J. Herndl (University of Vienna, Netherlands Institute for Sea Research)

Twitter @microbialoceanW

Tiny phytoplankton seen from space

Posted by mmaheigan 
· Thursday, November 19th, 2020 

Picophytoplankton, the smallest phytoplankton on Earth, are dominant in over half of the global surface ocean, growing in low-nutrient “ocean deserts” where diatoms and other large phytoplankton have difficult to thrive. Despite their small size, picophytoplankton collectively account for well over 50% of primary production in oligotrophic waters, thus playing a major role in sustaining marine food webs.

In a recent paper published in Optics Express, the authors use satellite-detected ocean color (namely remote-sensing reflectance, Rrs(λ)) and sea surface temperature to estimate the abundance of the three picophytoplankton groups—the cyanobacteria Prochlorococcus and Synechococcus, and autotrophic picoeukaryotes. The authors analysed Rrs(λ) spectra using principal component analysis, and principal component scores and SST were used in the predictive models. Then, they trained and independently evaluated the models with in-situ data from the Atlantic Ocean (Atlantic Meridional Transect cruises). This approach allows for the satellite detection of the succession of species across ocean oligotrophic ecosystem boundaries, where these cells are most abundant (Figure 1).

Figure 1. Cell abundances of the three major picophytoplankton groups (the cyanobacteria Prochlorococcus and Synechococcus, and a collective group of autotrophic picoeukaryotes) in surface waters of the Atlantic Ocean. Abundances are shown for the dominant group in terms of total biovolume (converted from cell abundance).

Since these organisms can be used as proxies for marine ecosystem boundaries, this method can be used in studies of climate and ecosystem change, as it allows a synoptic observation of changes in picophytoplankton distributions over time and space. For exploring spectral features in hyperspectral Rrs(λ) data, the implementation of this model using data from future hyperspectral satellite instruments such as NASA PACE’s Ocean Color Instrument (OCI) will extend our knowledge about the distribution of these ecologically relevant phytoplankton taxa. These observations are crucial for broad comprehension of the effects of climate change in the expansion or shifts in ocean ecosystems.


Authors:
Priscila K. Lange (NASA Goddard Space Flight Center / Universities Space Research Association / Blue Marble Space Institute of Science)
Jeremy Werdell (NASA Goddard Space Flight Center)
Zachary K. Erickson (NASA Goddard Space Flight Center)
Giorgio Dall’Olmo (Plymouth Marine Laboratory)
Robert J. W. Brewin (University of Exeter)
Mikhail V. Zubkov (Scottish Association for Marine Science)
Glen A. Tarran (Plymouth Marine Laboratory)
Heather A. Bouman (University of Oxford)
Wayne H. Slade (Sequoia Scientific, Inc)
Susanne E. Craig (NASA Goddard Space Flight Center / Universities Space Research Association)
Nicole J. Poulton (Bigelow Laboratory for Ocean Sciences)
Astrid Bracher (Alfred-Wegener-Institute Helmholtz Center for Polar and Marine Research / University of Bremen)
Michael W. Lomas (Bigelow Laboratory for Ocean Sciences)
Ivona Cetinić (NASA Goddard Space Flight Center / Universities Space Research Association)


Chasing Sargassum in the Atlantic Ocean

Posted by mmaheigan 
· Wednesday, March 25th, 2020 

The pelagic brown alga Sargassum forms a habitat that hosts a rich diversity of life, including other algae, crustaceans, fish, turtles, and birds in both the Gulf of Mexico and the area of the Atlantic Ocean known as the Sargasso Sea. However, high abundances of Sargassum have been appearing in the tropical Atlantic, in some cases 3,000 miles away from the Sargasso Sea. This is a new phenomenon. Nearly every year since 2011, thick mats of Sargassum have blanketed the coastlines of many countries in tropical Africa and the Americas. When masses of Sargassum wash ashore, the seaweed rots, attracts insects, and repels beachgoers, with adverse ecological and socioeconomic effects. A new study in Progress in Oceanography sheds light on the mystery.

Figure 1. The hypothesized route of Sargasso Sea Sargassum to the tropical Atlantic and the Caribbean Sea. The solid black lines indicate the climatological surface flow, the dashed black lines indicate areas where there was variability from the average conditions.

The authors analyzed reams of satellite data and used computer models of the Earth’s winds and ocean currents to try to understand why these large mats started to arrive in coastal areas in 2011. A strengthening and southward shift of the westerlies in the winter of 2009-2010 caused ocean currents to move the Sargassum toward the Iberian Peninsula, then southward in the Canary Current along Africa, where it entered the tropics by the middle of 2010 (Figure 1). The tropical Atlantic provided ample sunlight, warmer sea temperatures, and nutrients for the algae to flourish. In 2011, Sargassum spread across the entire tropical Atlantic in a massive belt north of the Equator, along the Intertropical Convergence Zone (ITCZ), and these blooms have appeared nearly every year since. Utilizing international oceanographic studies done in the Atlantic since the 1960s, and multiple satellite sensors combined with Sargassum distribution patterns, the authors discovered that the trade winds aggregate the Sargassum under the ITCZ and mix the water deep enough to bring new nutrients to the surface and sustain the bloom.

Improved understanding and predictive capacity of Sargassum bloom occurrence will help us better constrain and quantify its impacts on our ecosystems, which can inform management of valuable fisheries and protected species.


Authors:
Elizabeth Johns (NOAA AMOL)
Rick Lumpkin (NOAA AMOL)
Nathan Putman (LGL Ecological Research Associates)
Ryan Smith (NOAA AMOL)
Frank Muller-Karger (University of South Florida)
Digna Rueda-Roa (University of South Florida)
Chuanmin Hu (University of South Florida)
Mengqiu Wang (University of South Florida)
Maureen Brooks (University of Maryland Center for Environmental Science)
Lewis Gramer (NOAA AMOL and University of Miami)
Francisco Werner (NOAA Fisheries)

Hurricane-driven surge of labile carbon into the deep North Atlantic Ocean

Posted by mmaheigan 
· Thursday, February 27th, 2020 

Tropical cyclones (hurricanes and typhoons) are the most extreme episodic weather event affecting subtropical and temperate oceans. Hurricanes generate intense surface cooling and vertical mixing in the upper ocean, resulting in nutrient upwelling into the photic zone and episodic phytoplankton blooms. However, their influence on the deep ocean is unknown.

Figure 1. (a) Particulate organic carbon (POC) flux and percentage of the total mass flux (yellow) (top panel); fluxes (middle panel) and POC-normalized concentrations (bottom panel) of diagnostic lipid biomarkers for phytoplankton-derived and labile material, zooplankton, bacteria, and other (see legend); (b) Lipid concentrations (left panel) and POC-normalized concentrations (right panel) of diagnostic lipid biomarkers for the same sources as in (a) (see legend) measured two weeks after Nicole’s passage (25-29 Oct. 2016). Shown for reference are total lipid concentration profiles in April 2015 (dark gray, typical post spring bloom conditions) and Nov 2015 (light gray, typical minimum production period).

In October 2016, Category 3 Hurricane Nicole passed over the Bermuda time-series site (Oceanic Flux Program (OFP) and Bermuda Atlantic Time-Series site (BATS)) in the oligotrophic NW Atlantic Ocean. In a recent study published in Geophysical Research Letters, authors synthesized multidisciplinary data from hydrographic and phytoplankton measurements and lipid composition of sinking and suspended particles collected from OFP and BATS, respectively, after Hurricane Nicole in 2016. After the hurricane passed, particulate fluxes of lipids diagnostic of fresh phytodetritus, zooplankton, and microbial biomass increased by 30-300% at 1500 m depth and 30-800% at 3200 m depth (Figure 1a). In addition, mesopelagic suspended particles were enriched in phytodetrital material, as well as zooplankton- and bacteria-sourced lipids (Figure 1b), indicating particle disaggregation and a deep-water ecosystem response.

These results suggest that carbon export and biogeochemical cycles may be impacted by climate-induced changes in hurricane frequency, intensity, and tracks, and, underscore the sensitivity of deep ocean ecosystems to climate perturbations.

Authors:
Rut Pedrosa-Pamies (Marine Biological Laboratory)
Maureen H. Conte (Bermuda Institute of Ocean Science and Marine Biological Laboratory)
JC Weber (Marine Biological Laboratory)
Rodney Johnson (Bermuda Institute of Ocean Science)

Unexpected DOC additions in the deep Atlantic

Posted by mmaheigan 
· Tuesday, January 7th, 2020 

Oceanic dissolved organic carbon (DOC) ultimately exchanges with atmospheric CO2 and thus represents an important carbon source/sink with consequence for climate. Most of the DOC is recalcitrant to microbial degradation, with some fractions surviving for thousands of years. Therefore, DOC in the deep ocean was thought to be stable or to decrease slowly over decades to centuries due to biotic and abiotic sinks. However, a study published in Global Biogeochemical Cycles shows that there are some zones of the deep Atlantic Ocean where recalcitrant DOC experiences net production. Using data from oceanographic cruises across the Atlantic Ocean, the authors first identified the major water masses in the basin and the percentage of each in every sample taken for DOC analysis. The study revealed net additions of 27 million tons of dissolved organic carbon per year in the deep South Atlantic. On the other hand, the North Atlantic serves as a net sink, removing 298 million tons of carbon annually. DOC production observed in the deep Atlantic is probably due to the sinking particles that solubilize into DOC, since DOC enrichment was most evident at latitudes characterized as elevated productivity divergence zones.

Figure 1. Water masses along GO-SHIP line A16 (colored dots) and recalcitrant DOC variations due to biogeochemical processes (black dots within each water mass) in the deep Atlantic Ocean. Water mass domains are defined as the set of samples with the corresponding water mass proportion ≥50%. Recalcitrant DOC latitudinal variations per water stratum due to biogeochemical processes (ΔDOC) is in μmol kg-1. Numbers on the plots are DOC values for the corresponding dots. Scales (not shown) are the same for all the plots, from -4 to 6 μmol kg-1. Positive (negative) ΔDOC indicates values higher (lower) than the average DOC calculated for each water mass using an optimum multiparameter (OMP) analysis. DOC = dissolved organic carbon. AAIW = Antarctic Intermediate Water; UNADW = upper North Atlantic Deep Water; ISOW = Iceland Scotland Overflow Water; CDW = Circumpolar Deep Water; WSDW = Weddell Sea Deep Water. Figure created with Ocean Data View (Schlitzer, 2015).

Considering that the net DOC production over the entire Atlantic basin euphotic zone is 0.70–0.75 Pg C year-1, the authors estimated that 30–39% of that DOC is consumed in the deep Atlantic subsequent to its export by overturning circulation. The upper North Atlantic Deep Water (UNADW) acts as the primary sink, accounting for 66% of the recalcitrant DOC removal in the North Atlantic. Conversely, the Antarctic Intermediate Water (AAIW) is the primary recipient, with 45% of recalcitrant DOC production in the South Atlantic, closely followed by the old UNADW that gains 44% of the recalcitrant DOC in the southern basin.

The Atlantic works as a mosaic of water masses, where both removal and addition of recalcitrant DOC occurs, with the dominant term dependent on the origin, temperature, age and depth of the water masses. The production of recalcitrant DOC in the deep ocean should be considered in biogeochemical models dealing with the carbon cycle and climate.

Authors:
C. Romera-Castillo and J. L. Pelegrí (Instituto de Ciencias del Mar, CSIC, Spain)
M. Álvarez (Instituto Español de Oceanografía, Spain)
D. A. Hansell (University of Miami, USA)
X. A. Álvarez-Salgado (Instituto de Investigaciones Marinas, CSIC, Spain)

The ocean’s smallest phytoplankton may be bigger than we thought

Posted by mmaheigan 
· Tuesday, December 17th, 2019 

Flow cytometry can sort hundreds of thousands of phytoplankton cells in minutes, a tool that has been exploited for over thirty years in marine science. However, skilled analysts are still needed for manual interpretation of these cells into different types and then further into size distributions and optical properties.

In a recent study published in Applied Optics, the authors developed and implemented an automated scheme on the large Atlantic Meridional Transect flow cytometric database, which contains around 104 samples and 109 cells (the entire AMT flowcytometric dataset which spans a decade of transects (AMT18 – AMT27). This unique, well-calibrated dataset spans 100° of latitude between the UK and the Falklands, with multiple samples between 0-200m. The results clearly show that Prochlorococcus, very small marine cyanobacteria, are consistently larger than previously thought (>0.65 µm), and their size distribution reveals a distinctive double peak (0.75 µm and 1.75 µm) that varies strongly with depth. This is coupled with changes in Prochlorococcus optical properties, a term we have coined “opto-types.”  By contrast, Synechococcus are typically 1.5 µm in diameter and more homogeneously dispersed.

Figure 1: North to South transect (bottom left) of the Atlantic Ocean showing the variability in the abundance (top left), size (top right) and refractive index (bottom right) of Prochlorococcus

This work has uncovered new information regarding the size distribution of the ocean’s smallest phytoplankton, which has implications for how energy is transferred between different biological organisms.


Authors:
Tim Smyth (Plymouth Marine Laboratory)
Glen Tarran (Plymouth Marine Laboratory)
Shubha Sathyendranath (Plymouth Marine Laboratory)

Deep ocean carbon reconstruction helps decipher a million-year-old climate mystery

Posted by mmaheigan 
· Tuesday, July 23rd, 2019 

Approximately one million years ago, Earth’s periodic ice ages increased in strength and duration, shifting from a 41,000-year pacing to a 100,000-year pacing, both linked to Earth’s orbital variations. The causes of this climate shift known as the mid-Pleistocene transition (MPT) have been debated for decades.

A recent study in Nature Geoscience addresses how the ocean carbon cycle contributed to the MPT by quantifying the carbon inventory of the deep Atlantic Ocean during this time. Using trace element and isotope ratios of fossil marine foraminifera, the authors demonstrate that an abrupt weakening of deep ocean overturning circulation between 950,000 and 900,000 years ago occurred alongside a pronounced increase in carbon content of the deep Atlantic Ocean. This study revealed significantly higher carbon concentrations in the deep North and South Atlantic basins during the post-MPT 100,000-year ice ages relative to the 41,000-year ice ages prior to the MPT (Figure 1).

Figure 1 caption: The last two million years of glacial cycles, with present day on left and age increasing from left to right. Orange data are from 41,000-year ice ages; blue data are from,100,000-year ice ages. (A) Glacial-interglacial cycles demonstrated in benthic oxygen isotopes (green), with warmer interglacials up and peak ice ages downward. (B) Atmospheric CO2 from ice core measurements (gray lines) and reconstructed from boron isotopes (circles) (C), Peak ice age neodymium isotope ratios indicating strength of density-driven deep ocean circulation (squares and triangles indicate two different sediment cores). (D) Peak ice age deep ocean carbon content (squares and diamonds indicate two independent reconstructions from the same South Atlantic sediment core).

These data indicate that since 950,000 years ago, the deep Atlantic Ocean has stored an extra 50 billion tons of carbon during peak ice ages. This study hypothesizes that this extra carbon was sequestered from the atmosphere via a feedback between Antarctic ice sheet extent and the efficiency of air-sea carbon exchange in the Southern Ocean. The authors propose that intensification of ice ages one million years ago was closely linked to enhanced ocean carbon storage and resultant lowering of atmospheric CO2 levels.

While paleoclimatologists consider the MPT to be the most recent major climate transition, the magnitude of carbon perturbation at the MPT pales in comparison to today’s human emissions. Today, humans produce 50 billion tons of carbon in only five years. Studies of the carbon cycle across past climate transitions like the MPT provide key insights on how future climate may respond to today’s carbon cycle disruption.


Authors
Jesse Farmer (LDEO Columbia University; now at Princeton University and Max Planck Institute for Chemistry)
Bärbel Hönisch, Laura Haynes, Maureen Raymo, Steven Goldstein, Maayan Yehudai, Joohee Kim (LDEO Columbia University)
Heather Ford (Queen Mary University of London)
Dick Kroon, Simon Jung, Dave Bell (University of Edinburgh)
Maria Jaume-Seguí, Leopoldo Pena (University of Barcelona)


See this related popular article and video in the Washington Post.

Hotspots of biological production: Submesoscale changes in respiration and production

Posted by mmaheigan 
· Thursday, April 26th, 2018 

The biological pump is complex and variable. To better understand it, scientists have often focused on variations in biological parameters such as fluorescence and community structure, and have less often observed variations in rates of production. Production rates can be estimated using oxygen as a tracer, since photosynthesis produces oxygen and respiration consumes it. In a recent article in Deep Sea Research Part I, the authors presented high-resolution maps of oxygen in the upper 140 m of the ocean in the subtropical and tropical Atlantic, produced from a towed undulating instrument. This provides a synoptic, high-resolution view of oxygen anomalies in the surface ocean. These data reveal remarkable hotspots of biological production and respiration co-located with areas of elevated fluorescence. These hotspots are often several kilometers wide (horizontal) and ~10 m long (vertical). They are preferentially associated with edges of eddies, but not all edges sampled contained hotspots. Although this study captures only two-dimensional glimpses of these hotspots, precluding formal calculations of production rates, likely estimates of source water suggest that many of these hotspots may actually be areas of enhanced respiration rather than enhanced photosynthesis. The paper describes a conceptual model of nutrients, new production, respiration, fluorescence, and oxygen during the formation and decline of these hotspots. These data raise intriguing questions–if the hotspots do indeed have substantially different rates of production and respiration than surrounding waters, then they could lead to significant changes in estimates of production in the upper ocean. Additionally, understanding the mechanisms that produce these hotspots could be critical for predicting the effects of climate change on the magnitude of the biological pump.

(a) Oxygen concentrations and (b) fluorescence at ~1 km resolution over 300 km from 15.13°N, 57.47°W to 12.30°N, 56.42° W, as measured by sensors attached to the (c) Video Plankton Recorder II. Note that no contouring was used for this plot – every pixel represents an actual data point. Figure modified from Stanley et al., 2017. VPR image photograph by Phil Alatalo.

Authors:
Rachel H. R. Stanley (Wellesley College)
Dennis J. McGillicuddy Jr. (WHOI)
Zoe O. Sandwith (WHOI)
Haley Pleskow (Wellesley College)

Feedbacks mitigate the impacts of atmospheric nitrogen deposition in the western North Atlantic

Posted by mmaheigan 
· Thursday, April 12th, 2018 

How do phytoplankton respond to atmospheric nitrogen deposition in the western North Atlantic, an area downwind of large agricultural and industrial centers? The biogeochemical impacts of this ‘fertilization’ remain unclear, as direct oceanic observations of atmospheric deposition are limited and models often cannot resolve the important processes.

In a recent study, St-Laurent et al. (2017) simulated the biogeochemical impacts of nitrogen deposition on surface waters of the western North Atlantic by combining year-specific deposition rates from the Community Multiscale Air Quality (CMAQ) model and a realistic 3-D biogeochemical model of the waters off the US east coast. Westerly winds from the continent and large fluxes of heat and moisture over the Gulf Stream produce a ‘hotspot’ of wet nitrogen deposition along the path of the current. This nitrogen input increases the local surface primary productivity by up to 30% during the summer. However, the study also identified important processes that mitigate the impact of atmospheric nitrogen deposition in other seasons and regions. Deposition weakens vertical nitrogen gradients in the upper 20 m and thus decreases the upward transport of nitrogen to the surface layer (a negative feedback). Increases in surface phytoplankton concentrations also negatively impact light availability below the surface through shelf-shading.

Atmospheric nitrogen deposition along the US east coast. (Left) Wet deposition of oxidized nitrogen over the Gulf Stream as simulated by the Community Multiscale Air Quality model (average 2004-2008). (Right) Increase in summer surface primary productivity in response to the deposition (average 2004-2008).

These results indicate that atmospheric nitrogen deposition has important impacts on the surface biogeochemistry of the western North Atlantic but that the response is not simply proportional to the deposition. Additional research is necessary to clarify the role played by atmospheric deposition in this region in past and future centuries. While inputs of atmospheric nitrogen associated with power plants and industries have decreased since the passage of the Clean Air Act, recent studies have revealed increasing atmospheric concentrations of reduced nitrogen. Continued coordination between modeling and observing efforts (both on land and over the ocean) are needed to improve our understanding of the impacts of deposition on the biological pump in this region of the Atlantic ocean.


Authors:
Pierre St-Laurent (VIMS, College of William and Mary)
Marjorie A.M. Friedrichs (VIMS, College of William and Mary)
Raymond G. Najjar (Pennsylvania State University)
Doug Martins (FLIR Systems Inc.)
Maria Herrmann (Pennsylvania State University)
Sonya K. Miller (Pennsylvania State University)
John Wilkin (Rutgers University)

Next Page »

Filter by Keyword

abundance acidification additionality advection africa air-sea air-sea interactions algae alkalinity allometry ammonium AMO AMOC anoxic Antarctic Antarctica anthro impacts anthropogenic carbon anthropogenic impacts appendicularia aquaculture aquatic continuum aragonite saturation arctic Argo argon arsenic artificial seawater Atlantic atmospheric CO2 atmospheric nitrogen deposition authigenic carbonates autonomous platforms bacteria bathypelagic BATS BCG Argo benthic bgc argo bio-go-ship bio-optical bioavailability biogeochemical cycles biogeochemical models biogeochemistry Biological Essential Ocean Variables biological pump biophysics bloom blue carbon bottom water boundary layer buffer capacity C14 CaCO3 calcification calcite carbon carbon-climate feedback carbon-sulfur coupling carbonate carbonate system carbon budget carbon cycle carbon dioxide carbon export carbon fluxes carbon sequestration carbon storage Caribbean CCA CCS changing marine chemistry changing marine ecosystems changing marine environments changing ocean chemistry chemical oceanographic data chemical speciation chemoautotroph chesapeake bay chl a chlorophyll circulation CO2 coastal and estuarine coastal darkening coastal ocean cobalt Coccolithophores commercial community composition competition conservation cooling effect copepod copepods coral reefs CTD currents cyclone daily cycles data data access data assimilation database data management data product Data standards DCM dead zone decadal trends decomposers decomposition deep convection deep ocean deep sea coral denitrification deoxygenation depth diatoms DIC diel migration diffusion dimethylsulfide dinoflagellate dinoflagellates discrete measurements distribution DOC DOM domoic acid DOP dust DVM ecology economics ecosystem management ecosystems eddy Education EEZ Ekman transport emissions ENSO enzyme equatorial current equatorial regions ESM estuarine and coastal carbon fluxes estuary euphotic zone eutrophication evolution export export fluxes export production extreme events faecal pellets fecal pellets filter feeders filtration rates fire fish Fish carbon fisheries fishing floats fluid dynamics fluorescence food webs forage fish forams freshening freshwater frontal zone functional role future oceans gelatinous zooplankton geochemistry geoengineering geologic time GEOTRACES glaciers gliders global carbon budget global ocean global warming go-ship grazing greenhouse gas greenhouse gases Greenland ground truthing groundwater Gulf of Maine Gulf of Mexico Gulf Stream gyre harmful algal bloom high latitude human food human impact human well-being hurricane hydrogen hydrothermal hypoxia ice age ice cores ice cover industrial onset inland waters in situ inverse circulation ions iron iron fertilization iron limitation isotopes jellies katabatic winds kelvin waves krill kuroshio lab vs field land-ocean continuum larvaceans lateral transport LGM lidar ligands light light attenuation lipids low nutrient machine learning mangroves marine carbon cycle marine heatwave marine particles marine snowfall marshes mCDR mechanisms Mediterranean meltwater mesopelagic mesoscale mesoscale processes metagenome metals methane methods microbes microlayer microorganisms microplankton microscale microzooplankton midwater mitigation mixed layer mixed layers mixing mixotrophs mixotrophy model modeling model validation mode water molecular diffusion MPT MRV multi-decade n2o NAAMES NCP nearshore net community production net primary productivity new ocean state new technology Niskin bottle nitrate nitrogen nitrogen cycle nitrogen fixation nitrous oxide north atlantic north pacific North Sea nuclear war nutricline nutrient budget nutrient cycles nutrient cycling nutrient limitation nutrients OA observations ocean-atmosphere ocean acidification ocean acidification data ocean alkalinity enhancement ocean carbon storage and uptake ocean carbon uptake and storage ocean color ocean modeling ocean observatories ocean warming ODZ oligotrophic omics OMZ open ocean optics organic particles oscillation outwelling overturning circulation oxygen pacific paleoceanography PAR parameter optimization parasite particle flux particles partnerships pCO2 PDO peat pelagic PETM pH phenology phosphate phosphorus photosynthesis physical processes physiology phytoplankton PIC piezophilic piezotolerant plankton POC polar polar regions policy pollutants precipitation predation predator-prey prediction pressure primary productivity Prochlorococcus productivity prokaryotes proteins pteropods pycnocline radioisotopes remineralization remote sensing repeat hydrography residence time resource management respiration resuspension rivers rocky shore Rossby waves Ross Sea ROV salinity salt marsh satellite scale seafloor seagrass sea ice sea level rise seasonal seasonality seasonal patterns seasonal trends sea spray seawater collection seaweed secchi sediments sensors sequestration shelf ocean shelf system shells ship-based observations shorelines siderophore silica silicate silicon cycle sinking sinking particles size SOCCOM soil carbon southern ocean south pacific spatial covariations speciation SST state estimation stoichiometry subduction submesoscale subpolar subtropical sulfate surf surface surface ocean Synechococcus technology teleconnections temperate temperature temporal covariations thermocline thermodynamics thermohaline thorium tidal time-series time of emergence titration top predators total alkalinity trace elements trace metals trait-based transfer efficiency transient features trawling Tris trophic transfer tropical turbulence twilight zone upper ocean upper water column upwelling US CLIVAR validation velocity gradient ventilation vertical flux vertical migration vertical transport warming water clarity water mass water quality waves weathering western boundary currents wetlands winter mixing zooplankton

Copyright © 2025 - OCB Project Office, Woods Hole Oceanographic Institution, 266 Woods Hole Rd, MS #25, Woods Hole, MA 02543 USA Phone: 508-289-2838  •  Fax: 508-457-2193  •  Email: ocb_news@us-ocb.org

link to nsflink to noaalink to WHOI

Funding for the Ocean Carbon & Biogeochemistry Project Office is provided by the National Science Foundation (NSF) and the National Aeronautics and Space Administration (NASA). The OCB Project Office is housed at the Woods Hole Oceanographic Institution.