The global pandemic of the last nearly two years has affected all of us on a daily and long-term basis. Our planet is not exempt from these impacts. Can we see a signal of COVID-related CO2 emissions reductions in the ocean? In a recent study, Lovenduski et al. apply detection and attribution analysis to output from an ensemble of COVID-like simulations of an Earth system model to answer this question. While it is nearly impossible to detect a COVID-related change in ocean pH, the model produces a unique fingerprint in air-sea DpCO2 that is attributable to COVID. Challengingly, the large interannual variability in the climate system makes this fingerprint difficult to detect at open ocean buoy sites.
This study highlights the challenges associated with detecting statistically meaningful changes in ocean carbon and acidity following CO2 emissions reductions, and reminds the reader that it may be difficult to observe intentional emissions reductions — such as those that we may enact to meet the Paris Climate Agreement – in the ocean carbon system.
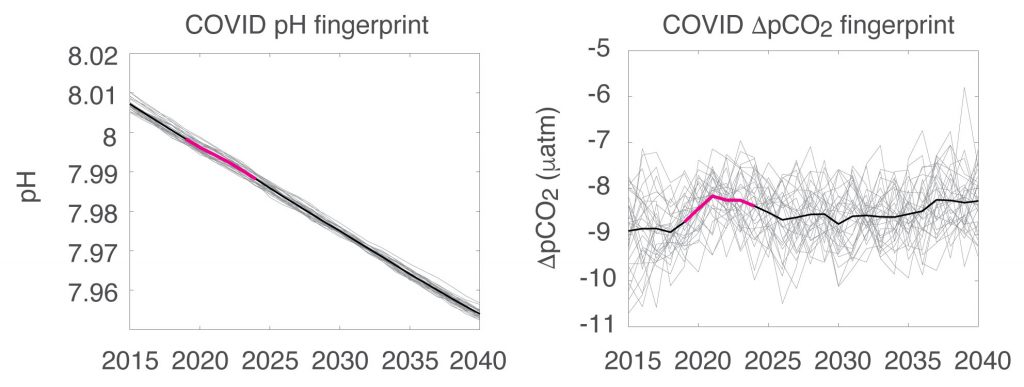
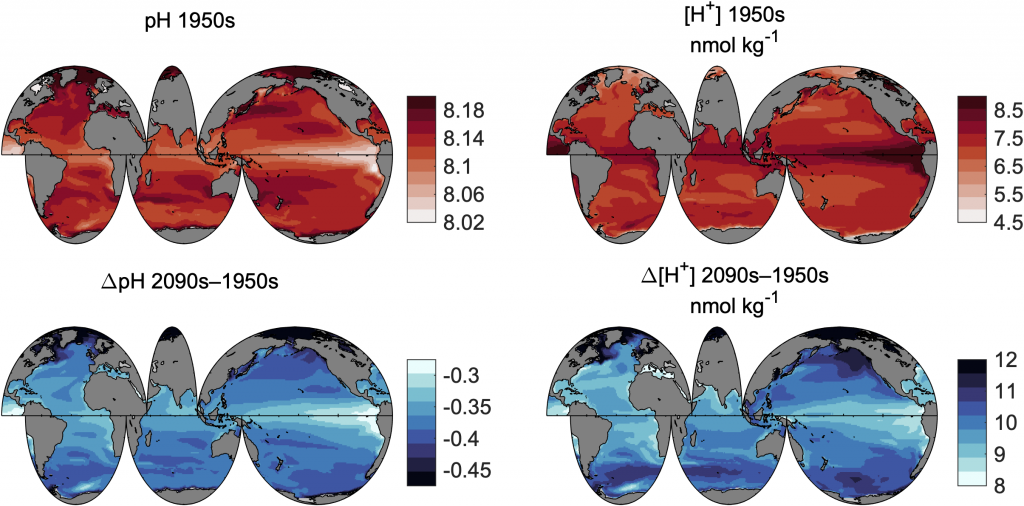
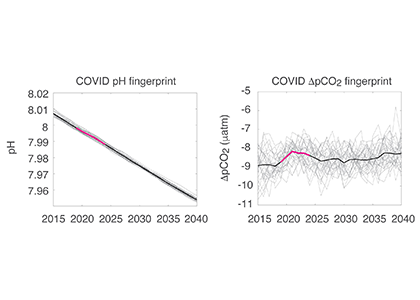
Figure caption: The fingerprint (pink line) of COVID-related CO2 emissions reductions in global-mean surface ocean pH and air-sea DpCO2, as estimated by an ensemble of COVID-like simulations in an Earth system model. While the pH fingerprint is not particularly exciting, the air-sea DpCO2 fingerprint displays a temporary weakening of the ocean carbon sink in 2021 due to COVID emissions reductions.
Authors:
Nikki Lovenduski (University of Colorado Boulder)
Neil Swart (Canadian Centre for Climate Modeling and Analysis)
Adrienne Sutton (NOAA Pacific Marine Environmental Laboratory)
John Fyfe (Canadian Centre for Climate Modeling and Analysis)
Galen McKinley (Columbia University and Lamont Doherty Earth Observatory)
Chris Sabine (University of Hawai’i at Manoa)
Nancy Williams (University of South Florida)