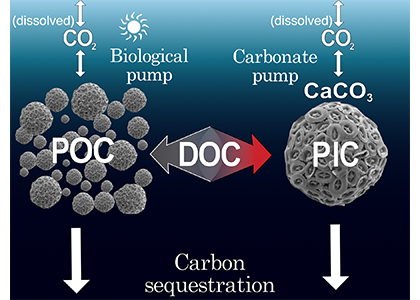
Free-living bacteria play a key role in cycling essential biogeochemical resources in the ocean, including iron, via their uptake, transformation, and release of organic matter throughout the water column. Bacteria process half of the ocean’s primary production, remineralize dissolved organic matter, and re-direct otherwise lost organic matter to higher trophic levels. For these reasons, it is crucial to understand what factors limit the growth of bacteria and how bacteria activities impact global ocean biogeochemical cycles.
In a recent study, Pham and colleagues used a global ocean ecosystem model to dive into how iron limits the growth of free-living marine bacteria, how bacteria modulate ocean iron cycling, and the consequences to marine ecosystems of the competition between bacteria and phytoplankton for iron.
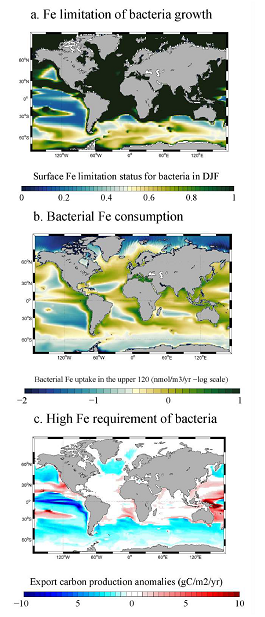
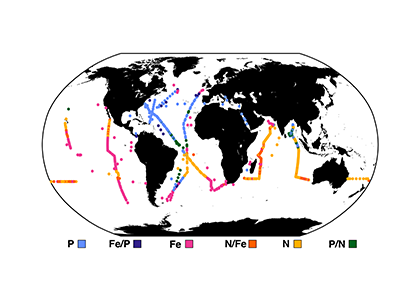
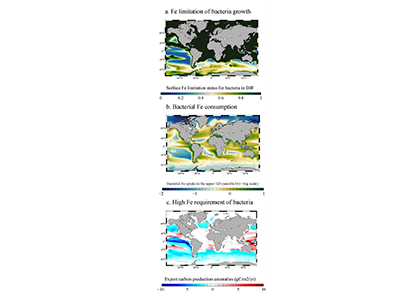
Figure 1: (a) Iron limitation status of bacteria in December, January, and February (DJF) in the surface ocean. Low values (in blue color = close to zero) mean that iron is the limiting factor for the growth of bacteria; (b) Bacterial iron consumption in the upper 120m of the ocean and (c) Changes (anomalies) in export carbon production when bacteria have a high requirement for iron.
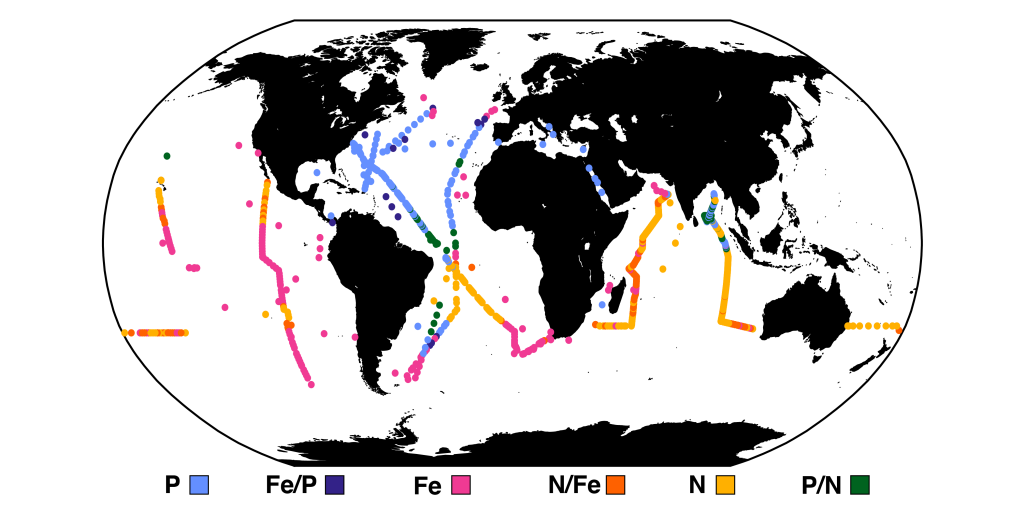
Through a series of computer simulations performed in the global ocean ecosystem model, the authors found that iron is a limiting factor for bacterial growth in iron-limited regions in the Southern Ocean, the tropical, and the subarctic Pacific due to the high iron requirement and iron uptake capability of bacteria. Bacteria act as an iron sink in the upper ocean due to their significant iron consumption, a rate comparable to phytoplankton. The competition between bacteria and phytoplankton for iron alters phytoplankton bloom dynamics, ocean carbon export, and the availability of dissolved organic carbon needed for bacterial growth. These results suggest that earth system models that omit bacteria ignore an important organism modulating biogeochemical responses of the ocean to future changes.
Authors:
Anh Le-Duy Pham (Laboratoire d’Océanographie et de Climatologie: Expérimentation et Approches Numériques (LOCEAN), IPSL, CNRS/UPMC/IRD/MNHN, Paris, France)
Olivier Aumont (Laboratoire d’Océanographie et de Climatologie: Expérimentation et Approches Numériques (LOCEAN), IPSL, CNRS/UPMC/IRD/MNHN, Paris, France)
Lavenia Ratnarajah (University of Liverpool, United Kingdom)
Alessandro Tagliabue (University of Liverpool, United Kingdom)