Ocean Carbon & Biogeochemistry
Studying marine ecosystems and biogeochemical cycles in the face of environmental change
  • Home
  • About OCB
    • About Us
    • Scientific Breadth
      • Biological Pump
      • Changing Marine Ecosystems
      • Changing Ocean Chemistry
      • Estuarine and Coastal Carbon Fluxes
      • Ocean Carbon Uptake and Storage
      • Ocean Observatories
    • Code of Conduct
    • Get Involved
    • Project Office
    • Scientific Steering Committee
    • OCB committees
      • Ocean Time-series
      • US Biogeochemical-Argo
      • Ocean-Atmosphere Interaction
  • Activities
    • Summer Workshop
    • OCB Webinars
    • Guidelines for OCB Workshops & Activities
    • Topical Workshops
      • CMIP6 Models Workshop
      • Coastal BGS Obs with Fisheries
      • C-saw extreme events workshop
      • Expansion of BGC-Argo and Profiling Floats
      • Fish, fisheries and carbon
      • Future BioGeoSCAPES program
      • GO-BCG Scoping Workshop
      • Lateral Carbon Flux in Tidal Wetlands
      • Leaky Deltas Workshop – Spring 2025
      • Marine CDR Workshop
      • Ocean Nucleic Acids ‘Omics
      • Pathways Connecting Climate Changes to the Deep Ocean
    • Small Group Activities
      • Aquatic Continuum OCB-NACP Focus Group
      • Arctic-COLORS Data Synthesis
      • BECS Benthic Ecosystem and Carbon Synthesis WG
      • Carbon Isotopes in the Ocean Workshop
      • CMIP6 WG
      • Filling the gaps air–sea carbon fluxes WG
      • Fish Carbon WG
      • Meta-eukomics WG
      • mCDR
      • Metaproteomic Intercomparison
      • Mixotrophs & Mixotrophy WG
      • N-Fixation WG
      • Ocean Carbonate System Intercomparison Forum
      • Ocean Carbon Uptake WG
      • OOI BGC sensor WG
      • Operational Phytoplankton Observations WG
      • Phytoplankton Taxonomy WG
    • Other Workshops
    • Science Planning
      • Coastal CARbon Synthesis (CCARS)
      • North Atlantic-Arctic
    • Ocean Acidification PI Meetings
    • Training Activities
      • PACE Hackweek 2025
      • PACE Hackweek 2024
      • PACE Training Activity 2022
  • Science Support
    • Data management and archival
    • Early Career
    • Funding Sources
    • Jobs & Postdocs
    • Meeting List
    • OCB Topical Websites
      • Ocean Fertilization
      • Trace gases
      • US IIOE-2
    • Outreach & Education
    • Promoting your science
    • Student Opportunities
    • OCB Activity Proposal Solicitations
      • Guidelines for OCB Workshops & Activities
    • Travel Support
  • Publications
    • OCB Workshop Reports
    • Science Planning and Policy
    • Newsletter Archive
  • Science Highlights
  • News

Archive for surface ocean – Page 2

Acidity across the interface from the ocean surface to sea spray aerosol

Posted by mmaheigan 
· Wednesday, March 31st, 2021 

The pH of aerosols controls their impact on climate and human health. Sea spray aerosols are one of the largest sources of aerosols globally by mass, yet it has been challenging to measure the pH of fresh sea spray aerosols in the past. A recent study published in PNAS measured sea spray aerosols under controlled conditions, during a sampling intensive called SeaSCAPE, and optimized a pH paper-based technique to measure the aerosol acidity. The authors found that fresh sea spray aerosols can be rapidly acidified by 4 to 6 orders of magnitude relative to the ocean. This acidification is caused by interaction with surrounding acidic gases, changes in relative humidity, and enhanced dissociation of organic acids within the aerosols. This is a critical finding since the pH of aerosols controls key atmospheric chemical reactions including sulfur dioxide oxidation to form particulate sulfate. The results are also important in light of the fact that enzyme activity has been observed in sea spray aerosols, and enzyme activity is pH dependent.

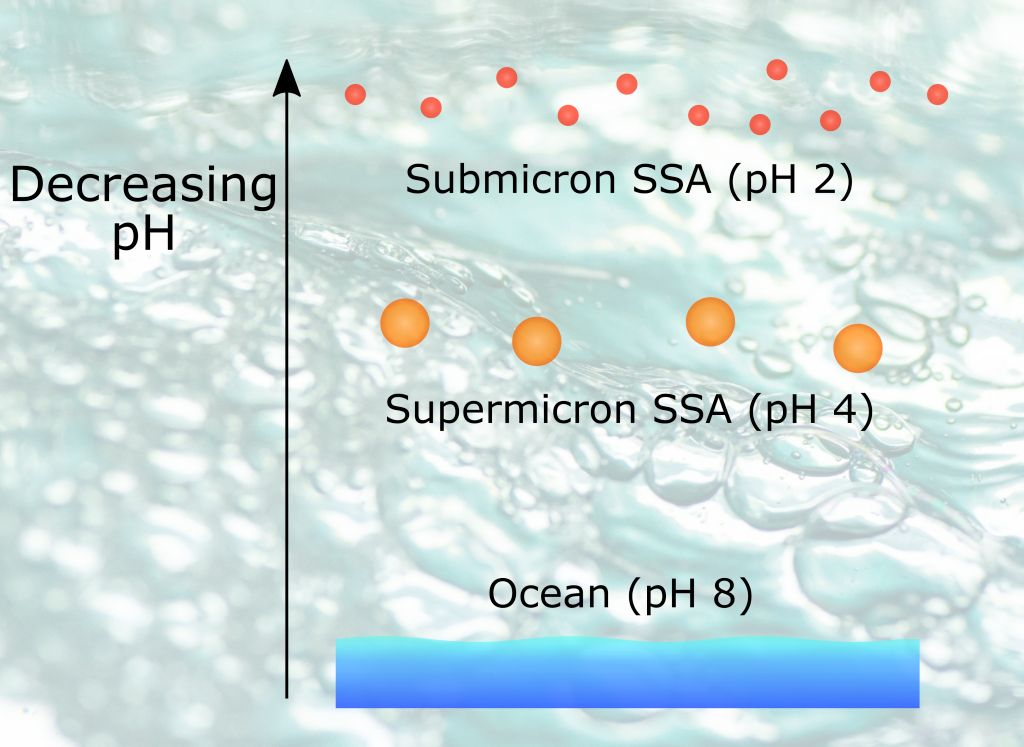
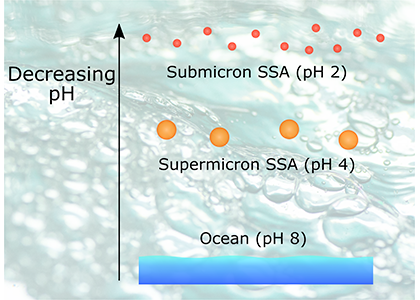
Figure 1. Acidity of nascent sea spray aerosols (SSA) compared to bulk ocean water measured during the 2019 SeaSCAPE sampling intensive. Background artwork by Nigella Hillgarth.


Authors
Kyle Angle (University of California, San Diego)
Daniel Crocker (University of California, San Diego)
Rebecca Simpson (University of California, San Diego)
Kathryn Mayer (University of California, San Diego)
Lauren Garofalo (Colorado State University, Fort Collins)
Alexia Moore (University of California, San Diego)
Stephanie Mora Garcia (University of California, San Diego)
Victor Or (University of California, San Diego)
Sudarshan Srinivasan (University of California, San Diego)
Mahum Farhan (University of California, San Diego)
Jonathan Sauer (University of California, San Diego)
Christopher Lee (University of California, San Diego)
Matson Pothier (Colorado State University, Fort Collins)
Delphine Farmer (Colorado State University, Fort Collins)
Todd Martz (University of California, San Diego)
Timothy Bertram (University of Wisconsin, Madison)
Christopher Cappa (University of California, Davis)
Kimberly Prather (University of California, San Diego)
Vicki Grassian (University of California, San Diego)


Joint post with Surface Ocean – Lower Atmosphere Study (SOLAS)

How environmental drivers regulated the long-term evolution of the biological pump

Posted by mmaheigan 
· Friday, January 22nd, 2021 

The marine biological pump (BP) plays a crucial role in regulating earth’s atmospheric oxygen and carbon dioxide levels by transferring carbon fixed by primary producers into the ocean interior and marine sediments, thereby controlling the habitability of our planet. The rise of multicellular life and eukaryotic algae in the ocean about 700 million years ago would likely have influenced the physical characteristics of oceanic aggregates (e.g., sinking rate), yet the magnitude of the impact this biological innovation had on the efficiency of BP is unknown.

Figure. 1. The impact of biological innovations (left) and environmental factors (atmospheric oxygen level and seawater temperature; right) on the efficiency of marine biological pump (BP). Temperatures are ocean surface temperatures (SST), and atmospheric pO2 is shown relative to the present atmospheric level (PAL). The BP efficiency is calculated as the fraction of carbon exported from the surface ocean that is delivered to the sediment-water interface. The results indicate that evolution of larger sized algae and zooplanktons has little influence on the long-term evolution of biological pump (left panel). The change in the atmospheric oxygen level and seawater surface temperature as environmental factors, on the other hand, have a stronger leverage on the efficiency of biological pump (right panel).

The authors of a recent paper in Nature Geoscience constructed a particle-based stochastic model to explore the change in the efficiency of the BP in response to biological and physical changes in the ocean over geologic time. The model calculates the age of organic particles in each aggregate based on their sinking rates, and considers the impact of primary producer cell size, aggregation, temperature, dust flux, biomineralization, ballasting by mineral phases, oxygen, and the fractal geometry (porosity) of aggregates. The model results demonstrate that while the rise of larger-sized eukaryotes led to an increase in the average sinking rate of oceanic aggregates, its impact on BP efficiency was minor. The evolution of zooplankton (with daily vertical migration in the water column) had a larger impact on the carbon transfer into the ocean interior. But results suggest that environmental factors most strongly affected the marine carbon pump efficiency. Specifically, increased ocean temperatures and greater atmospheric oxygen abundance led to a significant decrease in the efficiency of the BP. Cumulatively, these results suggest that while major biological innovations influenced the efficiency of BP, the long-term evolution of the marine carbon pump was primarily controlled by environmental drivers such as climate cooling and warming. By enhancing the rate of heterotrophic microbial degradation, our results suggest that the anthropogenically-driven global warming can result in a less efficient BP with reduced power of marine ecosystem in sequestering carbon from the atmosphere.

Authors:
Mojtaba Fakhraee (Yale University, Georgia Tech, and NASA Astrobiology Institute)
Noah J. Planavsky (Yale University, and NASA Astrobiology Institute)
Christopher T. Reinhard (Georgia Tech, and NASA Astrobiology Institute)

Sea ice loss amplifies CO2 increase in the Arctic

Posted by mmaheigan 
· Thursday, January 7th, 2021 

Warming and sea ice loss over the past few decades have caused major changes in sea surface partial pressure of CO2 (pCO2) of the western Arctic Ocean, but detailed temporal variations and trends during this period of rapid climate-driven changes are not well known.

Based on an analysis of an international Arctic pCO2 synthesis data set collected between 1994-2017, the authors of a recent paper published in Nature Climate Change observed that summer sea surface pCO2 in the Canada Basin is increasing at twice the rate of atmospheric CO2 rise. Warming, ice loss and subsequent CO2 uptake in the Basin are amplifying seasonal pCO2 changes, resulting in a rapid long-term increase. Consequently, the summer air-sea CO2 gradient has decreased sharply and may approach zero by the 2030s, which is reducing the basin’s capacity to remove CO2 from the atmosphere. In stark contrast, sea surface pCO2 on the Chukchi Shelf remains low and relatively constant during this time frame, which the authors attribute to increasingly strong biological production in response to higher intrusion of nutrient-rich Pacific Ocean water onto the shelf as a result of increased Bering Strait throughflow. These trends suggest that, unlike the Canada Basin, the Chukchi Shelf will become a larger carbon sink in the future, with implications for the deep ocean carbon cycle and ecosystem.

As Arctic sea ice melting accelerates, more fresh, low-buffer capacity, high-CO2 water will enter the upper layer of the Canada Basin, which may rapidly acidify the surface water, endanger marine calcifying organisms, and disrupt ecosystem function.

Figure. 1: TOP) Sea surface pCO2 trend in the Canada Basin and Chukchi Shelf. The grey dots represent the raw observations of pCO2, black dots are the monthly mean of pCO2 at in situ SST, and red dots are the monthly means of pCO2 normalized to the long-term means of SST. The arrows indicate the statistically significant change in ∆pCO2. BOTTOM) Sea ice-loss amplifying surface water pCO2 in the Canada Basin. Black dots represent the initial condition for pCO2 and DIC at -1.6 ℃. The arrows indicate the processes of warming (red), CO2 uptake from the atmosphere (green), dilution by ice meltwater (blue). The yellow shaded areas indicate the possible seasonal variations of pCO2, which are amplified by the synergistic effect of ice melt, warming and CO2 uptake.

Authors:
Zhangxian Ouyang (University of Delaware, USA),
Di Qi (Third Institute of Oceanography, China),
Liqi Chen (Third Institute of Oceanography, China),
Taro Takahashi† (Columbia University, USA),
Wenli Zhong (Ocean University of China, China),
Michael D. DeGrandpre (University of Montana, USA),
Baoshan Chen (University of Delaware, USA),
Zhongyong Gao (Third Institute of Oceanography, China),
Shigeto Nishino (Japan Agency for Marine-Earth Science and Technology, Japan),
Akihiko Murata (Japan Agency for Marine-Earth Science and Technology, Japan),
Heng Sun (Third Institute of Oceanography, China),
Lisa L. Robbins (University of South Florida, USA),
Meibing Jin (International Arctic Research Center, USA),
Wei-Jun Cai* (University of Delaware, USA)

Tiny phytoplankton seen from space

Posted by mmaheigan 
· Thursday, November 19th, 2020 

Picophytoplankton, the smallest phytoplankton on Earth, are dominant in over half of the global surface ocean, growing in low-nutrient “ocean deserts” where diatoms and other large phytoplankton have difficult to thrive. Despite their small size, picophytoplankton collectively account for well over 50% of primary production in oligotrophic waters, thus playing a major role in sustaining marine food webs.

In a recent paper published in Optics Express, the authors use satellite-detected ocean color (namely remote-sensing reflectance, Rrs(λ)) and sea surface temperature to estimate the abundance of the three picophytoplankton groups—the cyanobacteria Prochlorococcus and Synechococcus, and autotrophic picoeukaryotes. The authors analysed Rrs(λ) spectra using principal component analysis, and principal component scores and SST were used in the predictive models. Then, they trained and independently evaluated the models with in-situ data from the Atlantic Ocean (Atlantic Meridional Transect cruises). This approach allows for the satellite detection of the succession of species across ocean oligotrophic ecosystem boundaries, where these cells are most abundant (Figure 1).

Figure 1. Cell abundances of the three major picophytoplankton groups (the cyanobacteria Prochlorococcus and Synechococcus, and a collective group of autotrophic picoeukaryotes) in surface waters of the Atlantic Ocean. Abundances are shown for the dominant group in terms of total biovolume (converted from cell abundance).

Since these organisms can be used as proxies for marine ecosystem boundaries, this method can be used in studies of climate and ecosystem change, as it allows a synoptic observation of changes in picophytoplankton distributions over time and space. For exploring spectral features in hyperspectral Rrs(λ) data, the implementation of this model using data from future hyperspectral satellite instruments such as NASA PACE’s Ocean Color Instrument (OCI) will extend our knowledge about the distribution of these ecologically relevant phytoplankton taxa. These observations are crucial for broad comprehension of the effects of climate change in the expansion or shifts in ocean ecosystems.


Authors:
Priscila K. Lange (NASA Goddard Space Flight Center / Universities Space Research Association / Blue Marble Space Institute of Science)
Jeremy Werdell (NASA Goddard Space Flight Center)
Zachary K. Erickson (NASA Goddard Space Flight Center)
Giorgio Dall’Olmo (Plymouth Marine Laboratory)
Robert J. W. Brewin (University of Exeter)
Mikhail V. Zubkov (Scottish Association for Marine Science)
Glen A. Tarran (Plymouth Marine Laboratory)
Heather A. Bouman (University of Oxford)
Wayne H. Slade (Sequoia Scientific, Inc)
Susanne E. Craig (NASA Goddard Space Flight Center / Universities Space Research Association)
Nicole J. Poulton (Bigelow Laboratory for Ocean Sciences)
Astrid Bracher (Alfred-Wegener-Institute Helmholtz Center for Polar and Marine Research / University of Bremen)
Michael W. Lomas (Bigelow Laboratory for Ocean Sciences)
Ivona Cetinić (NASA Goddard Space Flight Center / Universities Space Research Association)


Austral summer vertical migration patterns in Antarctic zooplankton

Posted by mmaheigan 
· Thursday, October 15th, 2020 

Sunrise and sunset are the main cues driving zooplankton diel vertical migration (DVM) throughout the world’s oceans. These marine animals balance the trade-off between feeding in surface waters at night and avoiding predation during the day at depth. Near-constant daylight during polar summer was assumed to dampen these daily migrations. In a recent paper published in Deep-Sea Research I, authors assessed austral summer DVM patterns for 15 taxa over a 9-year period. Despite up to 22 hours of sunlight, a diverse array of zooplankton – including copepods, krill, pteropods, and salps – continued DVM.

Figure caption: Mean day (orange) and night (blue) abundance of (A) the salp Salpa thompsoni, (B) the krill species Thysanoessa macrura, (C) the pteropod Limacina helicina, and (D) chaetognaths sampled at discrete depth intervals from 0-500m. Horizontal dashed lines indicate weighted mean depth (WMD). N:D is the night to day abundance ratio for 0-150 m. Error bars indicate one standard error. Sample size n = 12 to 22. Photos by Larry Madin, Miram Gleiber, and Kharis Schrage.

The Palmer Antarctica Long-Term Ecological Research (LTER) Program conducted this study using a MOCNESS (Multiple Opening/Closing Net and Environmental Sensing System) to collect depth-stratified samples west of the Antarctic Peninsula. The depth range of migrations during austral summer varied across taxa and with daylength and phytoplankton biomass and distribution. While most taxa continued some form of DVM, others (e.g., carnivores and detritivores) remained most abundant in the mesopelagic zone, regardless of photoperiod, which likely impacted the attenuation of vertical carbon flux. Given the observed differences in vertical distribution and migration behavior across taxa, ongoing changes in Antarctic zooplankton assemblages will likely impact carbon export pathways. More regional, taxon-specific studies such as this are needed to inform efforts to model zooplankton contributions to the biological carbon pump.


Authors:
John Conroy (VIMS, William & Mary)
Deborah Steinberg (VIMS, William & Mary)
Patricia Thibodeau (VIMS, William & Mary; currently University of Rhode Island)
Oscar Schofield (Rutgers University)

Marine heatwave implications for future phytoplankton blooms

Posted by mmaheigan 
· Thursday, October 15th, 2020 

Ocean temperature extreme events such as marine heatwaves are expected to intensify in coming decades due to anthropogenic warming. Although the effects of marine heatwaves on large plants and animals are becoming well documented, little is known about how these warming events will impact microbes that regulate key biogeochemical processes such as ocean carbon uptake and export, which represent important feedbacks on the global carbon cycle and climate.

Figure caption: Relationship between phytoplankton bloom response to marine heatwaves and background nitrate concentration in the 23 study regions. X-axis denotes the annual-mean sea-surface nitrate concentration based on the model simulation (1992-2014; OFAM3, blue) and the in situ climatology (WOA13, orange). Y-axis denotes the mean standardised anomalies (see Equation 1 of the paper) of simulated sea-surface phytoplankton nitrogen biomass (1992-2014; OFAM3, blue) and observed sea-surface chlorophyll a concentration (2002-2018; MODIS, orange) during the co-occurrence of phytoplankton blooms and marine heatwaves.

In a recent study published in Global Change Biology, authors combined model simulations and satellite observations in tropical and temperate oceanographic regions over recent decades to characterize marine heatwave impacts on phytoplankton blooms. The results reveal regionally‐coherent anomalies depicted by shallower surface mixed layers and lower surface nitrate concentrations during marine heatwaves, which counteract known light and nutrient limitation effects on phytoplankton growth, respectively (Figure 1). Consequently, phytoplankton bloom responses are mixed, but derive from the background nutrient conditions of a study region such that blooms are weaker (stronger) during marine heatwaves in nutrient-poor (nutrient-rich) waters.

Given the projected expansion of nutrient-poor waters in the 21st century ocean, the coming decades are likely to see an increased occurrence of weaker blooms during marine heatwaves, with implications for higher trophic levels and biogeochemical cycling of key elements.

Authors:
Hakase Hayashida (University of Tasmania)
Richard Matear (CSIRO)
Pete Strutton (University of Tasmania)

Sea ice loss and the changing Arctic carbon cycle

Posted by mmaheigan 
· Friday, September 18th, 2020 

Loss of Arctic Ocean ice cover is altering the carbon cycle in ways that are not well understood. Effectively “popping the top off” the Arctic Ocean, ice loss exposes the sea surface to warming and exchange of CO2 with the atmosphere. These processes are expected to increase CO2 levels in the Arctic Ocean, changing its contribution to the global carbon cycle, but limited data collection in the region has thus far precluded the establishment of a clear relationship between CO2 and ice cover. In a recent study published in Geophysical Research Letters, authors report on observed partial pressure of CO2 (pCO2) trends from several years of data collection in the surface waters of the Canada Basin of the Arctic Ocean. These data show that the pCO2 is higher during years when ice cover is low. Uptake of atmospheric CO2 and heating are the primary sources of the CO2 increase, with only a small counteracting offset from biological production. These processes vary significantly from year to year, masking the likely increase in pCO2 over time. Based on these results, we can expect that, while the Arctic Ocean has thus far been a significant sink for atmospheric CO2, if ice loss continues the uptake of CO2 will diminish in coming years.

Figure caption: Sea surface pCO2 increases with decreasing ice concentration (left), determined using the mean of spatially gridded data. The sea surface pCO2 data were collected on five research cruises on the Canadian icebreaker, CCGS Louis S. St-Laurent, from 2012 to 2017 (shown at right for 2017). The pCO2 levels are indicated by the color along the ship cruise track (right color bar). The dark shading (left color bar) represents sea ice concentration averaged from the daily satellite data collected during the cruise.

Authors:
Michael DeGrandpre (University of Montana-Missoula)
Wiley Evans (Hakai Institute)
Mary-Louise Timmermans (Yale University)
Richard Krishfield (Woods Hole Oceanographic Institution)
Bill Williams (Institute of Ocean Sciences)
Michael Steele (University of Washington)

Turning a spotlight on grazing

Posted by mmaheigan 
· Thursday, July 23rd, 2020 

Microscopic plankton in the surface ocean make planet Earth habitable by generating oxygen and forming the basis of marine food webs, yielding harvestable protein. For over 100 years, oceanographers have tried to ascertain the physical, chemical, and biological processes governing phytoplankton blooms. Zooplankton grazing of phytoplankton is the single largest loss process for primary production, but empirical grazing data are sparse and thus poorly constrained in modeling frameworks, including assessments of global elemental cycles, cross-ecosystem comparisons, and predictive efforts anticipating future ocean ecosystem function. As sunlight decays exponentially with depth, upper-ocean mixing creates dynamic light environments with predictable effects on phytoplankton growth but unknown consequences for grazing.

Figure caption: Rates (d−1) of phytoplankton growth (μ), grazing mortality (g), and biomass accumulation (r) under four mixed layer scenarios simulated using light as a proxy of (a) sustained deep mixing, (b) rapid shoaling, (c) sustained shallow mixing, and (d) rapid mixed layer deepening. Error bars represent one standard deviation of the mean of duplicate experiments. Grazing was measured but not detected in the sustained deep mixing and rapid shoaling conditions, denoted with x.

Using data from a spring cruise in the North Atlantic, authors of a recent study published in Limnology & Oceanography compared the influences of microzooplankton predation and fluctuations in light availability—representative of a mixing water column—on phytoplankton standing stock. Data from at-sea incubations and light manipulation experiments provide evidence that phytoplankton’s instantaneous and zooplankton’s delayed responses to light fluctuations are key modulators of the balance between phytoplankton growth and grazing rates (Figure 1). These results suggest that light is a potential, remotely retrievable predictor of when and where in the ocean zooplankton grazing may represent an important loss term of phytoplankton production. If broadly verified, this approach could be used to systematically assess sparsely measured grazing across spatial and temporal gradients in representative regions of the ocean. Such data will be essential for enhancing our predictive capacity of ocean food web function, global biogeochemical cycles and the many derived processes, including fisheries production and the flow of carbon through the oceans.

Authors:
Françoise Morison (University of Rhode Island)
Gayantonia Franzè (University of Rhode Island, currently Institute of Marine Research, Norway)
Elizabeth Harvey (University of Georgia, currently University of New Hampshire)
Susanne Menden-Deuer (University of Rhode Island)


Unexpected patterns of carbon export in the Southern Ocean

Posted by mmaheigan 
· Tuesday, July 7th, 2020 

The Southern Ocean is a major player in driving global distributions of heat, carbon dioxide, and nutrients, making it key to ocean chemistry and the earth’s climate system. In the ocean, biological production and export of organic carbon are commonly linked to places with high nutrient availability. A recent paper, published in Global Biogeochemical Cycles, highlighting new observations from robotic profiling floats demonstrates that areas of high carbon export in the Southern Ocean are actually associated with very low concentrations of iron, an important micronutrient for supporting phytoplankton growth. This suggests a decoupling between the production and export of organic carbon in this region.

Figure caption: (A) Meridional pattern of Annual Net Community Production (ANCP) (equivalent to carbon export) (± standard deviation) in the Southern Ocean (blue line with circles and shaded area), carbon export estimates from previous satellite-based analyses (blue dashed line), and silicate to nitrate (Si:NO3) ratio of the surface water (black continuous line). Grey dotted line shows a Si:NO3 = 1 mol mol−1, characteristic of nutrient-replete diatoms. (B) Meridional pattern of Southern Ocean nutrient concentrations, including dissolved iron (Fe) concentration (black line), nitrate (red line), and silicate (blue line). (C) Mean 2014–2015 annual zonally averaged air-sea flux of CO2 computed using neural network interpolation method. STF = Subtropical Front, PF = Antarctic Polar Front, SIF = Seasonal Ice Front.

Using observations of nutrient and oxygen drawdown from a regional network of profiling Biogeochemical-Argo floats deployed as part of the Southern Ocean Carbon and Climate Observations and Modeling project (SOCCOM), the authors calculated estimates of Southern Ocean carbon export. A meridional pattern in biological carbon export emerged, showing peak export near the Antarctic Polar Front (PF) associated with minima in surface iron concentrations and dissolved silicate to nitrate ratios. Previous studies have shown that under iron-limiting conditions, diatoms increase their uptake ratio of silicate with respect to other nutrients (e.g., nitrogen), resulting in silicification. Here, the authors hypothesize that iron limitation promotes silicification in Southern Ocean diatoms, as evidenced by the low silicate to nitrate ratio of surface waters around the Antarctic Polar Front. High diatom silicification increases ballasting of particulate organic carbon and hence overall carbon export in this region. The resulting meridional pattern of organic carbon export is similar to that of the air-sea flux of carbon dioxide in the Southern Ocean, underscoring the importance of the biological carbon pump in controlling the spatial pattern of oceanic carbon uptake in this region.

Authors:
Lionel A. Arteaga (Princeton University)
Markus Pahlow (Helmholtz Centre for Ocean Research Kiel, GEOMAR)
Seth M. Bushinsky (University of Hawaii)
Jorge L. Sarmiento (Princeton University)


Physics vs. biology in Southern Ocean nutrient gradients

Posted by mmaheigan 
· Tuesday, June 16th, 2020 

In the Southern Ocean, surface water silicate (SiO4) concentrations decline very quickly relative to nitrate concentrations along a northward gradient toward mode water formation regions on the northern edge (Figure 1a, b). These mode waters play a critical role in driving global nutrient concentrations, setting the biogeochemistry of low- and mid-latitude regions around the globe after they upwell further north. To explain this latitudinal surface gradient, most hypotheses have implicated diatoms, which take up and export silicon as well as nitrogen: (1) Diatoms, including highly-silicified species such as Fragilariopsis kerguelensis, are more abundant in the Southern Ocean than elsewhere; (2) Iron limitation, which is prevalent in the Southern Ocean, elevates the Si:N ratio of diatoms; (3) Mass export of empty diatom frustules pumps silicate but not nitrate to deeper waters.

Figure 1: (a) and (b) nitrate and silicate concentrations in surface waters of the Southern Ocean (GLODAPv2_2019 data). (c) Model results of a standard run (black diamonds), a run without biology (red diamonds) and a run without mixing (blue diamonds).

In a recent paper published in Biogeosciences, the authors use an idealized model to explore the relative roles of biological vs. physical processes in driving the observed latitudinal surface nutrient gradients. Over timescales of a few years, removing the effects of biology (no SiO4 uptake or export) from the model elevates silicate concentrations slightly over the entire latitudinal range, but does not remove the strong latitudinal gradient (Figure 1c). However, if the effects of vertical mixing processes such as upwelling and entrainment are removed from the model by eliminating the observed deep [SiO4] gradient, the observed surface nutrient gradient is greatly altered (Figure 1c). These model results suggest that, over short timescales, physics is more important than biology in driving the observed surface water gradient in SiO4:NO3 ratios and forcing silicate depletion of mode waters leaving the Southern Ocean. These findings add to our understanding of Southern Ocean dynamics and the downstream effects on other oceans.


Authors:
P. Demuynck (University of Southampton)
T. Tyrrell (University of Southampton)
A.C. Naveira Garabato (University of Southampton)
C.M. Moore (University of Southampton)
A.P. Martin (National Oceanography Centre)

« Previous Page
Next Page »

Filter by Keyword

abundance acidification additionality advection africa air-sea air-sea interactions algae alkalinity allometry ammonium AMO AMOC anoxic Antarctic Antarctica anthro impacts anthropogenic carbon anthropogenic impacts appendicularia aquaculture aquatic continuum aragonite saturation arctic Argo argon arsenic artificial seawater Atlantic atmospheric CO2 atmospheric nitrogen deposition authigenic carbonates autonomous platforms bacteria bathypelagic BATS BCG Argo benthic bgc argo bio-go-ship bio-optical bioavailability biogeochemical cycles biogeochemical models biogeochemistry Biological Essential Ocean Variables biological pump biophysics bloom blue carbon bottom water boundary layer buffer capacity C14 CaCO3 calcification calcite carbon carbon-climate feedback carbon-sulfur coupling carbonate carbonate system carbon budget carbon cycle carbon dioxide carbon export carbon fluxes carbon sequestration carbon storage Caribbean CCA CCS changing marine chemistry changing marine ecosystems changing marine environments changing ocean chemistry chemical oceanographic data chemical speciation chemoautotroph chesapeake bay chl a chlorophyll circulation CO2 coastal and estuarine coastal darkening coastal ocean cobalt Coccolithophores commercial community composition competition conservation cooling effect copepod copepods coral reefs CTD currents cyclone daily cycles data data access data assimilation database data management data product Data standards DCM dead zone decadal trends decomposers decomposition deep convection deep ocean deep sea coral denitrification deoxygenation depth diatoms DIC diel migration diffusion dimethylsulfide dinoflagellate dinoflagellates discrete measurements distribution DOC DOM domoic acid DOP dust DVM ecology economics ecosystem management ecosystems eddy Education EEZ Ekman transport emissions ENSO enzyme equatorial current equatorial regions ESM estuarine and coastal carbon fluxes estuary euphotic zone eutrophication evolution export export fluxes export production extreme events faecal pellets fecal pellets filter feeders filtration rates fire fish Fish carbon fisheries fishing floats fluid dynamics fluorescence food webs forage fish forams freshening freshwater frontal zone functional role future oceans gelatinous zooplankton geochemistry geoengineering geologic time GEOTRACES glaciers gliders global carbon budget global ocean global warming go-ship grazing greenhouse gas greenhouse gases Greenland ground truthing groundwater Gulf of Maine Gulf of Mexico Gulf Stream gyre harmful algal bloom high latitude human food human impact human well-being hurricane hydrogen hydrothermal hypoxia ice age ice cores ice cover industrial onset inland waters in situ inverse circulation ions iron iron fertilization iron limitation isotopes jellies katabatic winds kelvin waves krill kuroshio lab vs field land-ocean continuum larvaceans lateral transport LGM lidar ligands light light attenuation lipids low nutrient machine learning mangroves marine carbon cycle marine heatwave marine particles marine snowfall marshes mCDR mechanisms Mediterranean meltwater mesopelagic mesoscale mesoscale processes metagenome metals methane methods microbes microlayer microorganisms microplankton microscale microzooplankton midwater mitigation mixed layer mixed layers mixing mixotrophs mixotrophy model modeling model validation mode water molecular diffusion MPT MRV multi-decade n2o NAAMES NCP nearshore net community production net primary productivity new ocean state new technology Niskin bottle nitrate nitrogen nitrogen cycle nitrogen fixation nitrous oxide north atlantic north pacific North Sea nuclear war nutricline nutrient budget nutrient cycles nutrient cycling nutrient limitation nutrients OA observations ocean-atmosphere ocean acidification ocean acidification data ocean alkalinity enhancement ocean carbon storage and uptake ocean carbon uptake and storage ocean color ocean modeling ocean observatories ocean warming ODZ oligotrophic omics OMZ open ocean optics organic particles oscillation outwelling overturning circulation oxygen pacific paleoceanography PAR parameter optimization parasite particle flux particles partnerships pCO2 PDO peat pelagic PETM pH phenology phosphate phosphorus photosynthesis physical processes physiology phytoplankton PIC piezophilic piezotolerant plankton POC polar polar regions policy pollutants precipitation predation predator-prey prediction pressure primary productivity Prochlorococcus productivity prokaryotes proteins pteropods pycnocline radioisotopes remineralization remote sensing repeat hydrography residence time resource management respiration resuspension rivers rocky shore Rossby waves Ross Sea ROV salinity salt marsh satellite scale seafloor seagrass sea ice sea level rise seasonal seasonality seasonal patterns seasonal trends sea spray seawater collection seaweed secchi sediments sensors sequestration shelf ocean shelf system shells ship-based observations shorelines siderophore silica silicate silicon cycle sinking sinking particles size SOCCOM soil carbon southern ocean south pacific spatial covariations speciation SST state estimation stoichiometry subduction submesoscale subpolar subtropical sulfate surf surface surface ocean Synechococcus technology teleconnections temperate temperature temporal covariations thermocline thermodynamics thermohaline thorium tidal time-series time of emergence titration top predators total alkalinity trace elements trace metals trait-based transfer efficiency transient features trawling Tris trophic transfer tropical turbulence twilight zone upper ocean upper water column upwelling US CLIVAR validation velocity gradient ventilation vertical flux vertical migration vertical transport warming water clarity water mass water quality waves weathering western boundary currents wetlands winter mixing zooplankton

Copyright © 2025 - OCB Project Office, Woods Hole Oceanographic Institution, 266 Woods Hole Rd, MS #25, Woods Hole, MA 02543 USA Phone: 508-289-2838  •  Fax: 508-457-2193  •  Email: ocb_news@us-ocb.org

link to nsflink to noaalink to WHOI

Funding for the Ocean Carbon & Biogeochemistry Project Office is provided by the National Science Foundation (NSF) and the National Aeronautics and Space Administration (NASA). The OCB Project Office is housed at the Woods Hole Oceanographic Institution.