Accurately predicting future ocean acidification (OA) conditions is crucial for advancing research at regional and global scales, and guiding society’s mitigation and adaptation efforts.
As an update to Jiang et al. 2019, this new model-data fusion product:
1. Utilizes an ensemble of 14 distinct Earth System Models from the Coupled Model Intercomparison Project Phase 6 (CMIP6) along with three recent observational ocean carbon data products –>instead of relying on just one model (i.e., the GFDL-ESM2M) this approach reduces potential projection biases in OA indicators.
2. Eliminates model biases using observational data, and model drift with pre-Industrial controls.
3. Covers 10 OA indicators, an expansion from the usual pH, acidity, and buffer capacity.
4. Incorporates the new Shared Socioeconomic Pathways (SSPs).
The use of the most recent observational datasets and a large Earth System Model ensemble is a major step forward in the projection of future surface ocean OA indicators and provides critical information to guide OA mitigation and adaptation efforts.
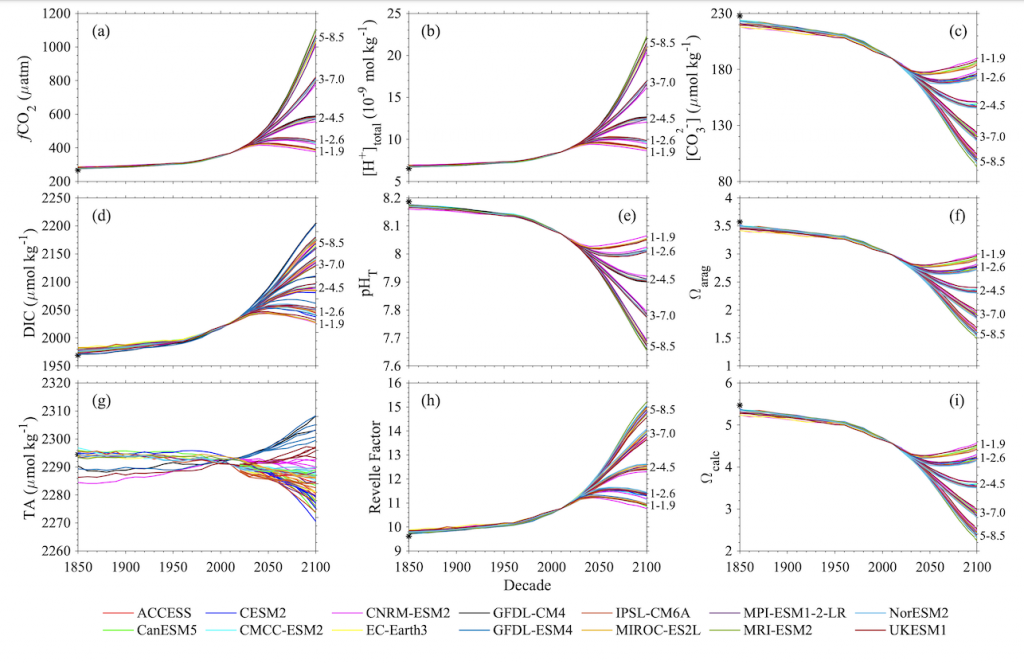
Figure X. Temporal changes of global average surface ocean OA indicators as reconstructed and projected from 14 CMIP6 Earth System Models after applying adjustments with observational data: (a) fugacity of carbon dioxide (fCO2), (b) total hydrogen ion content ([H+]total), (c) carbonate ion content ([CO32-]), (d) total dissolved inorganic carbon content (DIC), (e) pH on total scale (pHT), (f) aragonite saturation state (Ωarag), (g) total alkalinity content (TA), (h) Revelle Factor (RF), and (i) calcite saturation state (Ωcalc). The asterisk signs on the left-side y-axes show the values in 1750. The numbers along right-side y-axes, i.e., 1-1.9, 1-2.6, 2-4.5, 3-7.0, and 5-8.5, indicate the shared socioeconomic pathway SSP1-1.9, SSP1-2.6, SSP2-4.5, SSP3-7.0, and SSP5-8.5, respectively. These are missing from panel g because the trajectories were more dependent on the model than the SSP.
Authors
Li-Qing Jiang (University Maryland)
John Dunne (NOAA/Geophysical Fluid Dynamics Laboratory)
Brendan R. Carter (University of Washington)
Jerry F. Tjiputra (NORCE Norwegian Research Centre Bjerknes)
Jens Terhaar (Woods Hole Oceanographic Institution)
Jonathan D. Sharp (University of Washington)
Are Olsen (University of Bergen and Bjerknes Centre for Climate Research)
Simone Alin (NOAA/Pacific Marine Environmental Laboratory)
Dorothee C. E. Bakker (University of East Anglia)
Richard A. Feely (NOAA/Pacific Marine Environmental Laboratory)
Jean-Pierre Gattuso (Sorbonne Université)
Patrick Hogan (NOAA/National Centers for Environmental Information)
Tatiana Ilyina (Max Planck Institute for Meteorology)
Nico Lange (GEOMAR Helmholtz Centre for Ocean Research)
Siv K. Lauvset (NORCE Norwegian Research Centre)
Ernie R. Lewis (Brookhaven National Laboratory)
Tomas Lovato (Fondazione Centro Euro-Mediterraneo sui Cambiamenti Climatici)
Julien Palmieri (National Oceanography Centre)
Yeray Santana-Falcón (Université de Toulouse)
Jörg Schwinger (NORCE Norwegian Research Centre)
Roland Séférian (Université de Toulouse)
Gary Strand (US National Center for Atmospheric Research)
Neil Swart (Canadian Centre for Climate Modelling and Analysis)
Toste Tanhua (GEOMAR Helmholtz Centre for Ocean Research)
Hiroyuki Tsujino (JMA Meteorological Research Institute)
Rik Wanninkhof (NOAA/Atlantic Oceanographic Meteorological Laboratory)
Michio Watanabe (Japan Agency for Marine-Earth Science and Technology)
Akitomo Yamamoto (Japan Agency for Marine-Earth Science and Technology)
Tilo Ziehn (CSIRO Oceans and Atmosphere)
Twitter:
@JiangLiqing, @JensTerhaar, @jpGattuso, @j_d_sharp, @AreOlsen, @SimoneAlin, @Dorothee_Bakker, @RFeely, @ilitat, @sivlauvset, @yeraysf, @TosteTanhua,