Ocean Carbon & Biogeochemistry
Studying marine ecosystems and biogeochemical cycles in the face of environmental change
  • Home
  • About OCB
    • About Us
    • Scientific Breadth
      • Biological Pump
      • Changing Marine Ecosystems
      • Changing Ocean Chemistry
      • Estuarine and Coastal Carbon Fluxes
      • Ocean Carbon Uptake and Storage
      • Ocean Observatories
    • Code of Conduct
    • Get Involved
    • Project Office
    • Scientific Steering Committee
    • OCB committees
      • Ocean Time-series
      • US Biogeochemical-Argo
      • Ocean-Atmosphere Interaction
  • Activities
    • Summer Workshop
    • OCB Webinars
    • Guidelines for OCB Workshops & Activities
    • Topical Workshops
      • CMIP6 Models Workshop
      • Coastal BGS Obs with Fisheries
      • C-saw extreme events workshop
      • Expansion of BGC-Argo and Profiling Floats
      • Fish, fisheries and carbon
      • Future BioGeoSCAPES program
      • GO-BCG Scoping Workshop
      • Lateral Carbon Flux in Tidal Wetlands
      • Leaky Deltas Workshop – Spring 2025
      • Marine CDR Workshop
      • Ocean Nucleic Acids ‘Omics
      • Pathways Connecting Climate Changes to the Deep Ocean
    • Small Group Activities
      • Aquatic Continuum OCB-NACP Focus Group
      • Arctic-COLORS Data Synthesis
      • BECS Benthic Ecosystem and Carbon Synthesis WG
      • Carbon Isotopes in the Ocean Workshop
      • CMIP6 WG
      • Filling the gaps air–sea carbon fluxes WG
      • Fish Carbon WG
      • Meta-eukomics WG
      • mCDR
      • Metaproteomic Intercomparison
      • Mixotrophs & Mixotrophy WG
      • N-Fixation WG
      • Ocean Carbonate System Intercomparison Forum
      • Ocean Carbon Uptake WG
      • OOI BGC sensor WG
      • Operational Phytoplankton Observations WG
      • Phytoplankton Taxonomy WG
    • Other Workshops
    • Science Planning
      • Coastal CARbon Synthesis (CCARS)
      • North Atlantic-Arctic
    • Ocean Acidification PI Meetings
    • Training Activities
      • PACE Hackweek 2025
      • PACE Hackweek 2024
      • PACE Training Activity 2022
  • Science Support
    • Data management and archival
    • Early Career
    • Funding Sources
    • Jobs & Postdocs
    • Meeting List
    • OCB Topical Websites
      • Ocean Fertilization
      • Trace gases
      • US IIOE-2
    • Outreach & Education
    • Promoting your science
    • Student Opportunities
    • OCB Activity Proposal Solicitations
      • Guidelines for OCB Workshops & Activities
    • Travel Support
  • Publications
    • OCB Workshop Reports
    • Science Planning and Policy
    • Newsletter Archive
  • Science Highlights
  • News

Archive for air-sea interactions – Page 2

Light matters for biological pump assessments

Posted by mmaheigan 
· Thursday, May 7th, 2020 

Organic carbon produced during photosynthesis in the sunlit euphotic zone is transported to the deep ocean via the ocean’s biological carbon pump (BCP). Even small changes in the BCP efficiency changes the carbon dioxide gradient across the ocean‐atmosphere interface, thus influencing global climate. A recent study in PNAS demonstrate that prior studies that estimate BCP efficiencies at a fixed depth fail because they do not consider the varying depth of light penetration, which ultimately controls production of sinking organic carbon and varies by location and season. Subsequently, the fixed depth approach introduces regional biases and underestimates global estimates of BCP efficiency by two-fold (Figure 1). These new findings make the case for using euphotic zone‐based metrics rather than applying a fixed depth to compare BCP efficiencies between sites. Improved estimates of BCP efficiency will lead to a better understanding of the mechanisms that control ocean carbon fluxes and its feedbacks on climate.

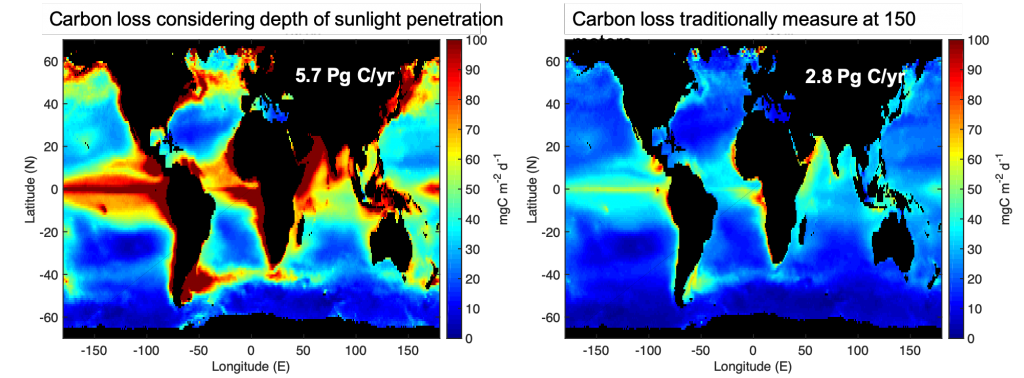
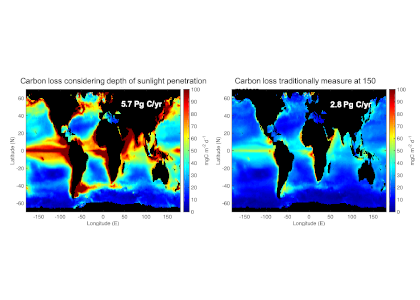
Figure 1: Carbon loss from the surface ocean shows more variability and is twice as high if measured at the depth where sunlight penetrates (left) vs. 150 meters (about 500 feet; right) where it is commonly measured. One Pg is 1015 grams with close to 6 Pg of carbon being transported to depth per year in left panel. In comparison, about 10 Pg C/yr is released to the atmosphere as a result of human activity.


Authors:
Ken Buesseler (WHOI)
Philip Boyd (IMAS Univ. Tasmania)
Erin Black (Dalhousie University)
David Siegel (University of California, Santa Barbara)

Also see: Tiny plankton drive processes in the ocean that capture twice as much carbon as scientists thought on The Conversation.

Featured on the cover of the PNAS May 5, 2020 issue:

Air-sea gas exchange estimates biased by multi-day surface trapping

Posted by mmaheigan 
· Tuesday, August 20th, 2019 

Routine measurements of air-sea gas exchange assume a homogeneous gas concentration across the upper few meters of the ocean. But is this assumption valid? A recent study in Biogeosciences revealed substantial systematic gradients of nitrous oxide (N2O) in the top few meters of the Peruvian upwelling regime. These gradients lead to a 30% overestimate of integrated N2O emissions across the entire region, with local emissions overestimated by as much as 800%.

Figure caption: Air-sea gas exchange estimates can be biased by gas concentration gradients within the upper few meters of the ocean; in particular, surface trapping over several days’ duration can generate substantial gradients.

The N2O gradients off Peru form during multi-day events of surface trapping, in which near-surface stratification dampens turbulent mixing. Until now, surface trapping was assumed to be a diurnal (driven by solar warming) process without memory, whereby only weak gradients would form during the hours of trapping and then dissipate. It is likely that multi-day surface trapping occurs in other ocean regions as well. The total impact on emission estimates of different greenhouse gases is yet to be quantified, but given the findings in the Peruvian upwelling system, could be significant globally.

Authors:
Tim Fischer, Annette Kock, Damian L. Arévalo-Martínez, Marcus Dengler, Peter Brandt, Hermann W. Bange (GEOMAR)

Forecasting air-sea CO2 flux variations several years in advance

Posted by mmaheigan 
· Tuesday, July 9th, 2019 

Year-to-year changes in the flux of CO2 between the atmosphere and the ocean impact the global carbon cycle and climate system, and challenge our ability to verify fossil fuel CO2 emissions. A new study published in Earth System Dynamics suggests that these air-sea CO2 flux variations are predictable several years in advance.

A novel set of initialized forecasts of past air-sea CO2 flux from an Earth system model (Figure 1a) confidently predicts year-to-year variations in the globally-integrated flux up to two years in advance. At regional scales, the forecast lead time increases. The predictability of CO2 flux from the initialized forecast system exceeds that obtained solely from foreknowledge of variations in external forcing (e.g., volcanic eruptions) or a simple persistence forecast (e.g., CO2 flux this year will be the same as next year). The longest-lasting forecast enhancements are in the subantarctic Southern Ocean and the northern North Atlantic (Figure 1b).

Figure 1: (a) Forecasts of the past evolution of air-sea CO2 flux in the South Pacific using an Earth System model indicate the potential to predict the future evolution of this quantity. (b) In each biome, the maximum forecast lead time in which the initialized forecast of air-sea CO2 flux beats out other forecast methods.

These results are particularly meaningful for those forecasting year-to-year changes in the global carbon budget, especially as these forecasting efforts are blind to the externally-forced variability in advance (i.e., the external forcing of the future is unknown).  In this way, forecasts of air-sea CO2 flux variations can help to inform future predictions of land-air CO2 flux and atmospheric CO2 concentration.

Authors:
Nicole Lovenduski (University of Colorado Boulder)
Stephen G. Yeager (National Center for Atmospheric Research)
Keith Lindsay (National Center for Atmospheric Research)
Matthew C. Long (National Center for Atmospheric Research)

See also the OCB Ocean-Atmosphere Interactions: Scoping directions for U.S. research Workshop to be held in October 1-3, 2019

A synthesis of North American coastal carbon fluxes

Posted by mmaheigan 
· Tuesday, April 30th, 2019 

Carbon fluxes in the coastal ocean and across its boundaries with the atmosphere, land, and the open ocean are an important but poorly constrained component of the global carbon budget. By synthesizing available observations and model simulations, a recent study aims to answer 1) whether the coastal ocean of North America takes up atmospheric CO2 and exports carbon to the open ocean; and 2) if so, how much? The authors estimate a net carbon sink of 160±80 Tg C yr−1 in the North American Exclusive Economic Zone (EEZ) with the Arctic, sub-Arctic and mid-latitude Atlantic EEZ regions as the major contributors.

Portion of EEZ Tg C yr−1 % of the total area
Arctic and sub-Arctic 104 51%
Mid-latitude Atlantic 62 25%
Mid-latitude Pacific -3.7 24%

Table 1: Regional breakdown of estimated carbon sink in the North Atlantic EEZ (negative values imply a carbon source).


Combining the net uptake with an estimate of carbon input from land of minus estimates of burial and accumulation of dissolved carbon in EEZ waters as follows implies a carbon export of 151±105 Tg C yr−1 to the open ocean.

160±80 

Tg C yr−1

+

106±30 

Tg C yr−1

–

65±55 

Tg C yr−1

–

50±25 

Tg C yr−1

=

151±105 

Tg C yr−1

Net uptake


Carbon input from land Estimated burial Estimated accumulation DOC in EEZ waters Carbon export to open ocean (estimated C export to open ocean)


The estimated uptake of atmospheric carbon in the North American EEZ amounts to 6.4% of the global ocean uptake of atmospheric CO2 (est. 2,500 Tg C yr−1). The North American EEZ only represents ~4% of the global ocean surface area, thus the CO2 uptake is about 50% more efficient in the North American EEZ than the global average. Given the importance of coastal margins, both in contributing to carbon budgets and in the societal benefits they provide, further efforts to improve assessments of the carbon cycle in these regions are paramount. It is critical to maintain and expand existing coastal observing programs, continue national and international coordination and integration of observations, modeling capabilities, and stakeholder needs.


Figure: Area-specific carbon fluxes for North American coastal regions (a, b and d) and total fluxes for a decomposition of the EEZ (c, e).


Authors:
Katja Fennel, Timothée Bourgeois (Dalhousie University, Canada)
Simone Alin, Richard A. Feely, Adrienne Sutton (NOAA Pacific Marine Environmental Laboratory)
Leticia Barbero (NOAA Atlantic Oceanographic and Meteorological Laboratory)
Wiley Evans (Hakai Institute, Canada)
Sarah Cooley (Ocean Conservancy)
John Dunne (NOAA Geophysical Fluid Dynamics Laboratory)
Jose Martin Hernandez-Ayon (Autonomous University of Baja California, Mexico)
Xinping Hu (Texas A&M University)
Steven Lohrenz (University of Massachusetts, Dartmouth)
Frank Muller-Karger, Lisa Robbins (University of South Florida)
Raymond Najjar (Pennsylvania State University)
Elizabeth Shadwick (CSIRO, Australia)
Samantha Siedlecki, Penny Vlahos (University of Connecticut)
Nadja Steiner (Department of Fisheries and Oceans Canada)
Daniela Turk (Lamont-Doherty Earth Observatory)
Zhaohui Aleck Wang (Woods Hole Oceanographic Institution)

Rapid warming and salinity changes mask acidification in Gulf of Maine waters

Posted by mmaheigan 
· Wednesday, February 20th, 2019 

Why don’t we see ocean acidification in over a decade of high-frequency observations in the Gulf of Maine? The answer lies in a recent decade of changes that raised sea surface temperature and salinity, and in turn dampened the expected acidification signal and caused the saturation states of calcite minerals to increase. From 2004 to 2014, sea surface temperatures in the Gulf of Maine were higher than any observations recorded in the region over the past 150 years. This greatly impacted both CO2 solubility and the sea surface carbonate system, as detailed in a recent paper in Biogeochemistry.

Over the 34 years of the time-series, the recent event is extreme, but interannual and decadal salinity and temperature variability also influenced carbonate system parameters, which makes it difficult to isolate and quantify an anthropogenic ocean acidification signal, especially if relying on shorter-term observations (Figure 1).

Figure 1: Modeled ΩAragonite (top panel) and pH (bottom panel) anomalies relative to monthly 2004 data. The red lines show trends prior to and after 2004, after which warming accelerated.

For those with a stake in profiting from or managing extractive resources that are susceptible to ocean acidification such as commercially important lobster and bivalves, understanding how ecosystems will be affected is critical. These analyses clearly demonstrate how physical processes can either accelerate or mitigate ocean carbonate system changes, thus confounding the detection of ocean acidification that is expected from increasing atmospheric carbon dioxide. To assess whether an ecosystem or species is at risk or aided by such processes, it is important to observe, understand, and be able to model all sources of carbonate system variability.

Authors:
Joe Salisbury and Bror Jönsson (Both at Ocean Processes Analysis Laboratory, University of New Hampshire)

Biological and physical controls on estuarine nitrous oxide emissions

Posted by mmaheigan 
· Tuesday, February 5th, 2019 

Nitrous oxide (N2O) is a potent greenhouse gas with rising atmospheric concentrations. Atmospheric emissions of N2O are predicted to increase with continued anthropogenic perturbation of the nitrogen cycle, yet the magnitude of these emissions is uncertain, particularly in coastal systems where N2O fluxes are poorly constrained. How do N2O emissions from a eutrophic estuary vary in space and time?

Figure 1: Depth profiles of nitrous oxide (N2O) (circles), salinity (dashed line), and dissolved oxygen (solid line) in the Chesapeake Bay at three stations. Solid circles indicate oversaturation of N2O with respect to equilibrium with the atmosphere, and open circles indicate undersaturation.

In a recent publication in Estuaries and Coasts, Laperriere et al. (2018) examined how physical and biological processes influence the distribution of N2O in Chesapeake Bay using dissolved gas measurements (N2O and N2/Ar) and stable isotope tracer incubations. During stratified summer conditions, the mesohaline region of the Chesapeake Bay was always a source of N2O to the atmosphere. The highest N2O concentrations occurred in the pycnocline at the interface between reducing bottom waters and oxygenated surface waters (Figure 1). Vertical mixing of surface waters across the pycnocline caused elevated rates of ammonia oxidation, a biological source of N2O, and resulted in the accumulation of nitrite (NO2–) below the pycnocline. During periods of weak mixing, ammonia oxidation rates and N2O concentrations were lower, and low dissolved oxygen concentrations below the pycnocline set the stage for N2O consumption via denitrification (Figure 1). The interplay between biological and physical processes controlling fluctuations in N2O concentration was examined using a mass balance approach. Mass balance estimates indicated that both biological processes and physical transport contribute to local changes in N2O concentration. The authors suggest that the fate of N2O during stratified summer conditions is governed by vertical mixing across the pycnocline, controlling whether N2O is released to the atmosphere or consumed at depth.


Authors:
Sarah M. Laperriere (University of California, Santa Barbara)
Nicholas J. Nidzieko (University of California, Santa Barbara)
Rebecca J. Fox (Washington College)
Alexander W. Fisher (University of California, Santa Barbara)
Alyson E. Santoro (University of California, Santa Barbara)

The past, present, and future of artificial ocean iron fertilization experiments

Posted by mmaheigan 
· Wednesday, January 23rd, 2019 

Since the beginning of the industrial revolution, human activities have greatly increased atmospheric CO2 concentrations, leading to global warming and indicating an urgent need to reduce global greenhouse gas emissions. The Martin (or iron) hypothesis suggests that ocean iron fertilization (OIF) could be a low-cost effective method for reducing atmospheric CO2 levels by stimulating carbon sequestration via the biological pump in iron-limited, high-nutrient, low-chlorophyll (HNLC) ocean regions. Given increasing global political, social, and economic concerns associated with climate change, it is necessary to examine the validity and usefulness of artificial OIF (aOIF) experimentation as a geoengineering solution.

Figure 1. (a) Global annual distribution of surface chlorophyll concentrations (mg m-3) with locations of 13 aOIF experiments. Maximum and initial values in (b) maximum quantum yield of photosynthesis (Fv/Fm ratios) and (c) chlorophyll-a concentrations (mg m-3) during aOIF experiments. (d) Changes in primary productivity (ΔPP = [PP]post-fertilization (postf) ‒ [PP]pre-fertilization (pref); mg C m-2 d-1). (e) Distributions of chlorophyll-a concentrations (mg m-3) on day 24 after iron addition in the Southern Ocean iron experiment-north (SOFeX-N) from MODIS Terra Level-2 daily image and on day 20 in the SOFeX-south (SOFeX-S) from SeaWiFS Level-2 daily image (white dotted box indicates phytoplankton bloom during aOIF experiments). (f) Changes in nitrate concentrations (ΔNO3– = [NO3–]postf ‒ [NO3–]pref; μM). (g) Changes in partial pressure of CO2 (ΔpCO2 = [pCO2]postf ‒ [pCO2]pref; μatm). The color bar indicates changes in dissolved inorganic carbon (ΔDIC = [DIC]postf ‒ [DIC]pref; μM). The numbers on the X axis indicate the order of aOIF experiments as given in Figure 1a and are grouped according to ocean basins; Equatorial Pacific (EP) (yellow bar), Southern Ocean (SO) (blue bar), subarctic North Pacific (NP) (red bar), and subtropical North Atlantic (NA) (green bar).

A review paper published in Biogeosciences on aOIF experiments provides a thorough overview of 13 scientific artificial OIF experiments conducted in HNLC regions over the last 25 years. These aOIF experiments have demonstrated that iron addition stimulates substantial increases in phytoplankton biomass and primary production, resulting in drawdown of macro-nutrients and dissolved inorganic carbon (Figure 1). Many of the aOIF experiments have also precipitated community shifts from smaller (pico- and nano-) to larger (micro) phytoplankton. However, the impact on the net transfer of CO2 from the atmosphere to below the winter mixed layer via the biological pump is not yet fully understood or quantified and appears to vary with environmental conditions, export flux measurement techniques, and other unknown factors. These results, including possible side effects, have been debated among those who support and oppose aOIF experimentation, and many questions remain about the effectiveness of scientific aOIF, possible side effects, and international aOIF law frameworks. Therefore, it is important to continue undertaking small-scale, scientifically controlled studies to better understand natural processes in the HNLC regions, assess the associated risks, and lay the groundwork for evaluating the potential effectiveness and impacts of large-scale aOIF as a geoengineering solution to anthropogenic climate change. Additionally, this paper suggests considerations for the design of future aOIF experiments to maximize the effectiveness of the technique and begin to answer open questions under international aOIF regulations.


Authors:
Joo-Eun Yoon (Incheon National University)
Il-Nam Kim (Incheon National University)
Alison M. Macdonald (Woods Hole Oceanographic Institution)

Improved method to identify and reduce uncertainties in marine carbon cycle predictions

Posted by mmaheigan 
· Wednesday, September 26th, 2018 

Improved method to identify and reduce uncertainties in marine carbon cycle predictions

How well do contemporary Earth System Models (ESMs) represent the dynamics of the modern day ocean? Often we question the fidelity of biological and chemical processes represented in these ESMs. The fact is representations of biogeochemical processes in models are plagued with some degree of uncertainties; therefore, identifying and reducing such deficiencies could advance ESM development and improve model predictions.

An overview of several models with respect to each of the variables, using absolute (left) and relative (right) scores to determine the degree of uncertainty in relation to referenced datasets.


A recent publication in Atmosphere described the ongoing efforts to develop the International Ocean Model Benchmarking (IOMB) package to evaluate ESM skill sets in simulating marine biogeochemical variables and processes. Model performances were scored based on how well they captured the distribution and variability contained in high-quality observational datasets. The authors highlighted systematic model–data benchmarking as a technique to identify ocean model deficiencies, which could provide a pathway to improving representations of sub-grid-scale parameterizations. They have scaled the absolute score from zero to unity, where the red color tends toward zero to quantify weaknesses in the skill set of a particular model in capturing values from the observational datasets. On the other side of the spectrum, the green color signifies considerable temporal and spatial overlap between the predicted and the observational values. The authors also present the standard score to show the relative scores within two standard deviations from the model mean. The benchmarking package was employed in the published study to assess marine biogeochemical process representations, with a focus on surface ocean concentrations and sea–air fluxes of dimethylsulfide (DMS). The production and emission of natural aerosols remain one of the major limitations in estimating global radiative forcing. Appropriate representation of aerosols in the marine boundary layer (MBL) is essential to reduce uncertainty and provide reliable information on offsets to global warming. Results show that model–data biases increased as DMS enters the MBL, with models over-predicting sea surface concentrations in the productive region of the eastern tropical Pacific by almost a factor of two and the sea–air fluxes by a factor of three. The associated uncertainties with oceanic carbon cycle processes may be additive or antagonistic; in any case, a constructive effort to disentangle the subtleties begins with an objective benchmarking effort, which is focused specifically on marine biogeochemical processes. The tool in development will ensure we satisfy some of the Model Intercomparison Project (MIP) benchmarking needs for the sixth phase of Coupled Model Intercomparison Project (CMIP6).


Authors:
Oluwaseun Ogunro (ORNL)
Scott Elliott (LANL)
Oliver Wingenter (New Mexico Tech)
Clara Deal (University of Alaska)
Weiwei Fu (UC Irvine)
Nathan Collier (ORNL)
Forrest M. Hoffman (ORNL)

Shelf-wide pCO2 increase across the South Atlantic Bight

Posted by mmaheigan 
· Thursday, August 2nd, 2018 

Relative to their surface area, coastal regions represent some of the largest carbon fluxes in the global ocean, driven by numerous physical, chemical and biological processes. Coastal systems also experience human impacts that affect carbon cycling, which has large socioeconomic implications. The highly dynamic nature of these systems necessitates observing approaches and numerical methods that can both capture high-frequency variability and delineate long-term trends.

Figure 1: The South Atlantic Bight (SAB) was divided into four sections using isobaths: the coastal zone (0 to 15 m), the inner shelf (15 to 30 m), the middle shelf (30 to 60 m), and the outer shelf (60 m and beyond). The X’s indicate the locations of the Gray’s Reef mooring (southern X) and the Edisto mooring (northern X).

In two recent studies using mooring- and ship-based ocean CO2 system data, authors observed that pCO2 is increasing from the coastal zone to the outer shelf of the South Atlantic Bight at rates greater than the global average oceanic and atmospheric increase (~1.8 µatm y-1). In recent publications in Continental Shelf Research and JGR-Oceans, the authors analyzed pCO2 data from 46 cruises (1991-2016) using a novel linear regression technique to remove the seasonal signal, revealing an increase in pCO2 of 3.0-3.7 µatm y-1 on the outer and inner shelf, respectively. Using a Generalized Additive Mixed Model (GAMM) approach for trend analysis, authors observed that the rates of increase were slightly higher than the deseasonalization technique, yielding pCO2 increases of 3.3 to 4.5 µatm y-1 on the outer and inner shelf, respectively. The reported pCO2 increases result in potential pH decreases of -0.003 to -0.004 units y-1.

Figure 2: The time series of fCO2 in the four regions of the SAB (cruise observations) and from the Gray’s Reef mooring on the inner shelf indicate an increase across the shelf. These data are the observed values, however, the trend lines for each time series are calculated using deseasonalized values using the reference year method.

Analysis of the pCO2 time-series from the Gray’s Reef mooring (using a NOAA Moored Autonomous pCO2 system from July 2006 -July 2015) yielded a rate of increase (3.5 ± 0.9 µatm y-1) that was comparable to the cruise data on the inner shelf (3.7 ± 2.2 and 4.5 ± 0.6 µatm y-1, linear and GAMM methods, respectively). Validation data collected at the mooring suggest that underway data from cruises and the moored data are comparable. Neither thermal processes nor atmospheric dissolution (the primary driver of oceanic acidification) can explain the observed pCO2 increase and concurrent pH decrease across the shelf. Unlike the middle and outer shelves, where an increase in SST could account for up to 1.1 µatm y-1 of the observed pCO2 trend, there is no thermal influence in the coastal zone and inner shelf. While 1.8 µatm y-1 could be attributed to the global average atmospheric increase, the remainder is likely due to transport from coastal marshes and in situ biological processes.  As the authors have shown, the increasing coastal and oceanic trend in pCO2 can lead to a decrease in pH, especially if there is no increase in buffering capacity.  More acidic waters can have a long term affect on coastal ecosystem services and biota.

Also see Eos Editor’s Vox on this research by Peter Brewer https://eos.org/editors-vox/coastal-ocean-warming-adds-to-co2-burden

Authors:

Multidecadal fCO2 Increase Along the United States Southeast Coastal Margin (JGR-Oceans)
Janet J. Reimer (University of Delaware)
Hongjie Wang (Texas A &M University – Corpus Christi)
Rodrigo Vargas (University of Delaware)
Wei-Jun Cai (University of Delaware)

And

Time series pCO2 at a coastal mooring: Internal consistency, seasonal cycles, and interannual variability (Continental Shelf Research)
Janet J. Reimer (University of Delaware)
Wei-Jun Cai (University of Delaware; University of Georgia)
Liang Xue (University of Delaware; First Institute of Oceanography, China)
Rodrigo Vargas (University of Delaware)
Scott Noakes (University of Georgia)
Xinping Hu (Texas A &M University – Corpus Christi)
Sergio R. Signorini (Science Applications International Corporation)
Jeremy T. Mathis (NOAA Arctic Research Program)
Richard A. Feely (NOAA Pacific Marine Environmental Laboratory)
Adrienne J. Sutton (NOAA Pacific Marine Environmental Laboratory; University of Washington)
Christopher Sabine (University of Hawaii Manoa)
Sylvia Musielewicz (NOAA Pacific Marine Environmental Laboratory; University of Washington)
Baoshan Chen (University of Delaware; University of Georgia)
Rik Wanninkhof (NOAA Atlantic Oceanographic and Meteorological Laboratory)

Feedbacks mitigate the impacts of atmospheric nitrogen deposition in the western North Atlantic

Posted by mmaheigan 
· Thursday, April 12th, 2018 

How do phytoplankton respond to atmospheric nitrogen deposition in the western North Atlantic, an area downwind of large agricultural and industrial centers? The biogeochemical impacts of this ‘fertilization’ remain unclear, as direct oceanic observations of atmospheric deposition are limited and models often cannot resolve the important processes.

In a recent study, St-Laurent et al. (2017) simulated the biogeochemical impacts of nitrogen deposition on surface waters of the western North Atlantic by combining year-specific deposition rates from the Community Multiscale Air Quality (CMAQ) model and a realistic 3-D biogeochemical model of the waters off the US east coast. Westerly winds from the continent and large fluxes of heat and moisture over the Gulf Stream produce a ‘hotspot’ of wet nitrogen deposition along the path of the current. This nitrogen input increases the local surface primary productivity by up to 30% during the summer. However, the study also identified important processes that mitigate the impact of atmospheric nitrogen deposition in other seasons and regions. Deposition weakens vertical nitrogen gradients in the upper 20 m and thus decreases the upward transport of nitrogen to the surface layer (a negative feedback). Increases in surface phytoplankton concentrations also negatively impact light availability below the surface through shelf-shading.

Atmospheric nitrogen deposition along the US east coast. (Left) Wet deposition of oxidized nitrogen over the Gulf Stream as simulated by the Community Multiscale Air Quality model (average 2004-2008). (Right) Increase in summer surface primary productivity in response to the deposition (average 2004-2008).

These results indicate that atmospheric nitrogen deposition has important impacts on the surface biogeochemistry of the western North Atlantic but that the response is not simply proportional to the deposition. Additional research is necessary to clarify the role played by atmospheric deposition in this region in past and future centuries. While inputs of atmospheric nitrogen associated with power plants and industries have decreased since the passage of the Clean Air Act, recent studies have revealed increasing atmospheric concentrations of reduced nitrogen. Continued coordination between modeling and observing efforts (both on land and over the ocean) are needed to improve our understanding of the impacts of deposition on the biological pump in this region of the Atlantic ocean.


Authors:
Pierre St-Laurent (VIMS, College of William and Mary)
Marjorie A.M. Friedrichs (VIMS, College of William and Mary)
Raymond G. Najjar (Pennsylvania State University)
Doug Martins (FLIR Systems Inc.)
Maria Herrmann (Pennsylvania State University)
Sonya K. Miller (Pennsylvania State University)
John Wilkin (Rutgers University)

« Previous Page
Next Page »

Filter by Keyword

abundance acidification additionality advection africa air-sea air-sea interactions algae alkalinity allometry ammonium AMO AMOC anoxic Antarctic Antarctica anthro impacts anthropogenic carbon anthropogenic impacts appendicularia aquaculture aquatic continuum aragonite saturation arctic Argo argon arsenic artificial seawater Atlantic atmospheric CO2 atmospheric nitrogen deposition authigenic carbonates autonomous platforms bacteria bathypelagic BATS BCG Argo benthic bgc argo bio-go-ship bio-optical bioavailability biogeochemical cycles biogeochemical models biogeochemistry Biological Essential Ocean Variables biological pump biophysics bloom blue carbon bottom water boundary layer buffer capacity C14 CaCO3 calcification calcite carbon carbon-climate feedback carbon-sulfur coupling carbonate carbonate system carbon budget carbon cycle carbon dioxide carbon export carbon fluxes carbon sequestration carbon storage Caribbean CCA CCS changing marine chemistry changing marine ecosystems changing marine environments changing ocean chemistry chemical oceanographic data chemical speciation chemoautotroph chesapeake bay chl a chlorophyll circulation CO2 coastal and estuarine coastal darkening coastal ocean cobalt Coccolithophores commercial community composition competition conservation cooling effect copepod copepods coral reefs CTD currents cyclone daily cycles data data access data assimilation database data management data product Data standards DCM dead zone decadal trends decomposers decomposition deep convection deep ocean deep sea coral denitrification deoxygenation depth diatoms DIC diel migration diffusion dimethylsulfide dinoflagellate dinoflagellates discrete measurements distribution DOC DOM domoic acid DOP dust DVM ecology economics ecosystem management ecosystems eddy Education EEZ Ekman transport emissions ENSO enzyme equatorial current equatorial regions ESM estuarine and coastal carbon fluxes estuary euphotic zone eutrophication evolution export export fluxes export production extreme events faecal pellets fecal pellets filter feeders filtration rates fire fish Fish carbon fisheries fishing floats fluid dynamics fluorescence food webs forage fish forams freshening freshwater frontal zone functional role future oceans gelatinous zooplankton geochemistry geoengineering geologic time GEOTRACES glaciers gliders global carbon budget global ocean global warming go-ship grazing greenhouse gas greenhouse gases Greenland ground truthing groundwater Gulf of Maine Gulf of Mexico Gulf Stream gyre harmful algal bloom high latitude human food human impact human well-being hurricane hydrogen hydrothermal hypoxia ice age ice cores ice cover industrial onset inland waters in situ inverse circulation ions iron iron fertilization iron limitation isotopes jellies katabatic winds kelvin waves krill kuroshio lab vs field land-ocean continuum larvaceans lateral transport LGM lidar ligands light light attenuation lipids low nutrient machine learning mangroves marine carbon cycle marine heatwave marine particles marine snowfall marshes mCDR mechanisms Mediterranean meltwater mesopelagic mesoscale mesoscale processes metagenome metals methane methods microbes microlayer microorganisms microplankton microscale microzooplankton midwater mitigation mixed layer mixed layers mixing mixotrophs mixotrophy model modeling model validation mode water molecular diffusion MPT MRV multi-decade n2o NAAMES NCP nearshore net community production net primary productivity new ocean state new technology Niskin bottle nitrate nitrogen nitrogen cycle nitrogen fixation nitrous oxide north atlantic north pacific North Sea nuclear war nutricline nutrient budget nutrient cycles nutrient cycling nutrient limitation nutrients OA observations ocean-atmosphere ocean acidification ocean acidification data ocean alkalinity enhancement ocean carbon storage and uptake ocean carbon uptake and storage ocean color ocean modeling ocean observatories ocean warming ODZ oligotrophic omics OMZ open ocean optics organic particles oscillation outwelling overturning circulation oxygen pacific paleoceanography PAR parameter optimization parasite particle flux particles partnerships pCO2 PDO peat pelagic PETM pH phenology phosphate phosphorus photosynthesis physical processes physiology phytoplankton PIC piezophilic piezotolerant plankton POC polar polar regions policy pollutants precipitation predation predator-prey prediction pressure primary productivity Prochlorococcus productivity prokaryotes proteins pteropods pycnocline radioisotopes remineralization remote sensing repeat hydrography residence time resource management respiration resuspension rivers rocky shore Rossby waves Ross Sea ROV salinity salt marsh satellite scale seafloor seagrass sea ice sea level rise seasonal seasonality seasonal patterns seasonal trends sea spray seawater collection seaweed secchi sediments sensors sequestration shelf ocean shelf system shells ship-based observations shorelines siderophore silica silicate silicon cycle sinking sinking particles size SOCCOM soil carbon southern ocean south pacific spatial covariations speciation SST state estimation stoichiometry subduction submesoscale subpolar subtropical sulfate surf surface surface ocean Synechococcus technology teleconnections temperate temperature temporal covariations thermocline thermodynamics thermohaline thorium tidal time-series time of emergence titration top predators total alkalinity trace elements trace metals trait-based transfer efficiency transient features trawling Tris trophic transfer tropical turbulence twilight zone upper ocean upper water column upwelling US CLIVAR validation velocity gradient ventilation vertical flux vertical migration vertical transport warming water clarity water mass water quality waves weathering western boundary currents wetlands winter mixing zooplankton

Copyright © 2025 - OCB Project Office, Woods Hole Oceanographic Institution, 266 Woods Hole Rd, MS #25, Woods Hole, MA 02543 USA Phone: 508-289-2838  •  Fax: 508-457-2193  •  Email: ocb_news@us-ocb.org

link to nsflink to noaalink to WHOI

Funding for the Ocean Carbon & Biogeochemistry Project Office is provided by the National Science Foundation (NSF) and the National Aeronautics and Space Administration (NASA). The OCB Project Office is housed at the Woods Hole Oceanographic Institution.