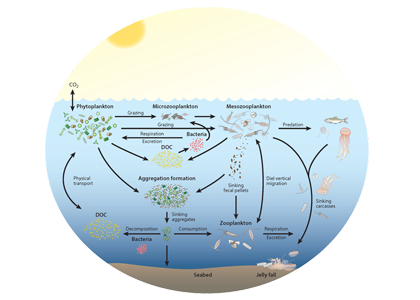
Since the beginning of the industrial revolution, human activities have greatly increased atmospheric CO2 concentrations, leading to global warming and indicating an urgent need to reduce global greenhouse gas emissions. The Martin (or iron) hypothesis suggests that ocean iron fertilization (OIF) could be a low-cost effective method for reducing atmospheric CO2 levels by stimulating carbon sequestration via the biological pump in iron-limited, high-nutrient, low-chlorophyll (HNLC) ocean regions. Given increasing global political, social, and economic concerns associated with climate change, it is necessary to examine the validity and usefulness of artificial OIF (aOIF) experimentation as a geoengineering solution.
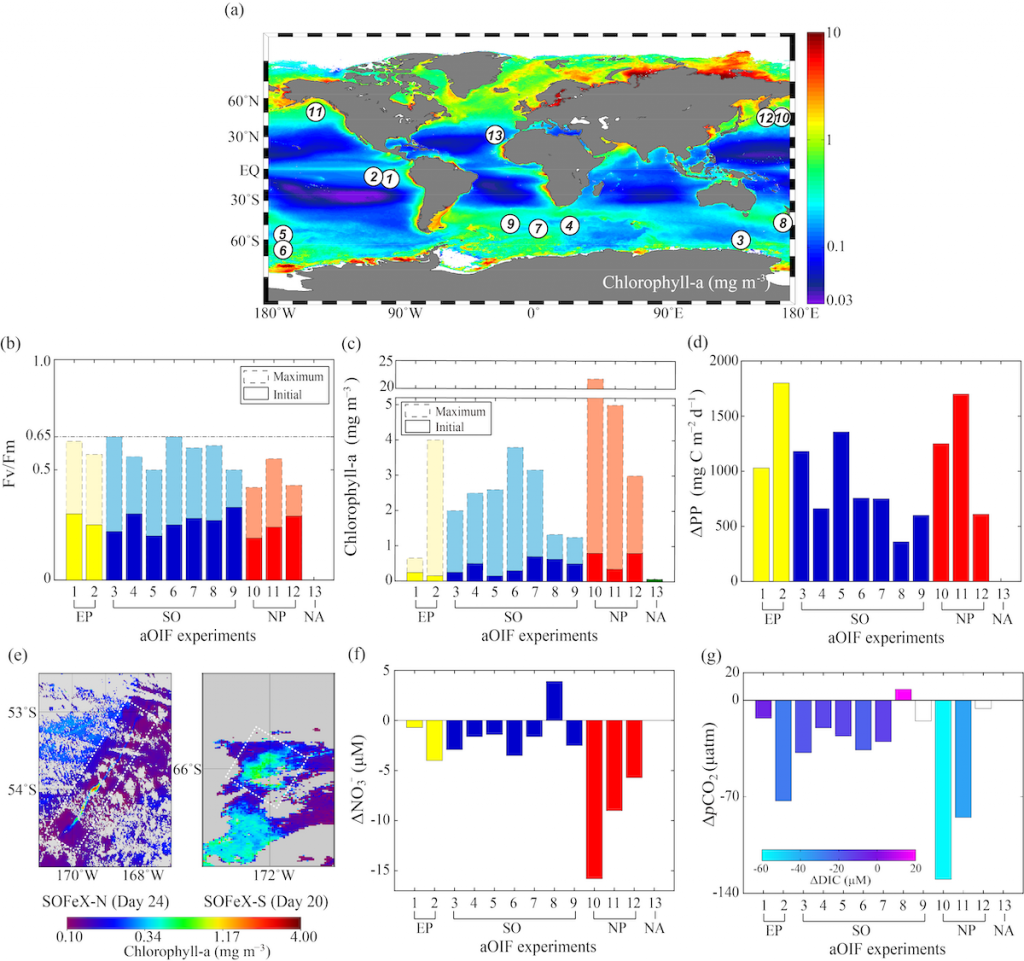
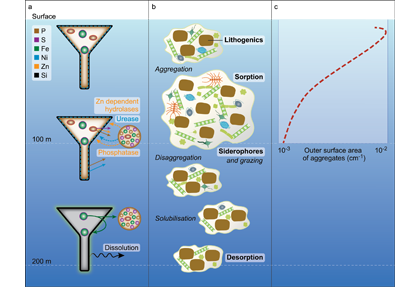
Figure 1. (a) Global annual distribution of surface chlorophyll concentrations (mg m-3) with locations of 13 aOIF experiments. Maximum and initial values in (b) maximum quantum yield of photosynthesis (Fv/Fm ratios) and (c) chlorophyll-a concentrations (mg m-3) during aOIF experiments. (d) Changes in primary productivity (ΔPP = [PP]post-fertilization (postf) ‒ [PP]pre-fertilization (pref); mg C m-2 d-1). (e) Distributions of chlorophyll-a concentrations (mg m-3) on day 24 after iron addition in the Southern Ocean iron experiment-north (SOFeX-N) from MODIS Terra Level-2 daily image and on day 20 in the SOFeX-south (SOFeX-S) from SeaWiFS Level-2 daily image (white dotted box indicates phytoplankton bloom during aOIF experiments). (f) Changes in nitrate concentrations (ΔNO3– = [NO3–]postf ‒ [NO3–]pref; μM). (g) Changes in partial pressure of CO2 (ΔpCO2 = [pCO2]postf ‒ [pCO2]pref; μatm). The color bar indicates changes in dissolved inorganic carbon (ΔDIC = [DIC]postf ‒ [DIC]pref; μM). The numbers on the X axis indicate the order of aOIF experiments as given in Figure 1a and are grouped according to ocean basins; Equatorial Pacific (EP) (yellow bar), Southern Ocean (SO) (blue bar), subarctic North Pacific (NP) (red bar), and subtropical North Atlantic (NA) (green bar).
Authors:
Joo-Eun Yoon (Incheon National University)
Il-Nam Kim (Incheon National University)
Alison M. Macdonald (Woods Hole Oceanographic Institution)