Ocean Carbon & Biogeochemistry
Studying marine ecosystems and biogeochemical cycles in the face of environmental change
  • Home
  • About OCB
    • About Us
    • Scientific Breadth
      • Biological Pump
      • Changing Marine Ecosystems
      • Changing Ocean Chemistry
      • Estuarine and Coastal Carbon Fluxes
      • Ocean Carbon Uptake and Storage
      • Ocean Observatories
    • Code of Conduct
    • Get Involved
    • Project Office
    • Scientific Steering Committee
    • OCB committees
      • Ocean Time-series
      • US Biogeochemical-Argo
      • Ocean-Atmosphere Interaction
  • Activities
    • Summer Workshop
    • OCB Webinars
    • Guidelines for OCB Workshops & Activities
    • Topical Workshops
      • CMIP6 Models Workshop
      • Coastal BGS Obs with Fisheries
      • C-saw extreme events workshop
      • Expansion of BGC-Argo and Profiling Floats
      • Fish, fisheries and carbon
      • Future BioGeoSCAPES program
      • GO-BCG Scoping Workshop
      • Lateral Carbon Flux in Tidal Wetlands
      • Leaky Deltas Workshop – Spring 2025
      • Marine CDR Workshop
      • Ocean Nucleic Acids ‘Omics
      • Pathways Connecting Climate Changes to the Deep Ocean
    • Small Group Activities
      • Aquatic Continuum OCB-NACP Focus Group
      • Arctic-COLORS Data Synthesis
      • BECS Benthic Ecosystem and Carbon Synthesis WG
      • Carbon Isotopes in the Ocean Workshop
      • CMIP6 WG
      • Filling the gaps air–sea carbon fluxes WG
      • Fish Carbon WG
      • Meta-eukomics WG
      • mCDR
      • Metaproteomic Intercomparison
      • Mixotrophs & Mixotrophy WG
      • N-Fixation WG
      • Ocean Carbonate System Intercomparison Forum
      • Ocean Carbon Uptake WG
      • OOI BGC sensor WG
      • Operational Phytoplankton Observations WG
      • Phytoplankton Taxonomy WG
    • Other Workshops
    • Science Planning
      • Coastal CARbon Synthesis (CCARS)
      • North Atlantic-Arctic
    • Ocean Acidification PI Meetings
    • Training Activities
      • PACE Hackweek 2025
      • PACE Hackweek 2024
      • PACE Training Activity 2022
  • Science Support
    • Data management and archival
    • Early Career
    • Funding Sources
    • Jobs & Postdocs
    • Meeting List
    • OCB Topical Websites
      • Ocean Fertilization
      • Trace gases
      • US IIOE-2
    • Outreach & Education
    • Promoting your science
    • Student Opportunities
    • OCB Activity Proposal Solicitations
      • Guidelines for OCB Workshops & Activities
    • Travel Support
  • Publications
    • OCB Workshop Reports
    • Science Planning and Policy
    • Newsletter Archive
  • Science Highlights
  • News

Archive for coastal ocean – Page 3

Chasing Sargassum in the Atlantic Ocean

Posted by mmaheigan 
· Wednesday, March 25th, 2020 

The pelagic brown alga Sargassum forms a habitat that hosts a rich diversity of life, including other algae, crustaceans, fish, turtles, and birds in both the Gulf of Mexico and the area of the Atlantic Ocean known as the Sargasso Sea. However, high abundances of Sargassum have been appearing in the tropical Atlantic, in some cases 3,000 miles away from the Sargasso Sea. This is a new phenomenon. Nearly every year since 2011, thick mats of Sargassum have blanketed the coastlines of many countries in tropical Africa and the Americas. When masses of Sargassum wash ashore, the seaweed rots, attracts insects, and repels beachgoers, with adverse ecological and socioeconomic effects. A new study in Progress in Oceanography sheds light on the mystery.

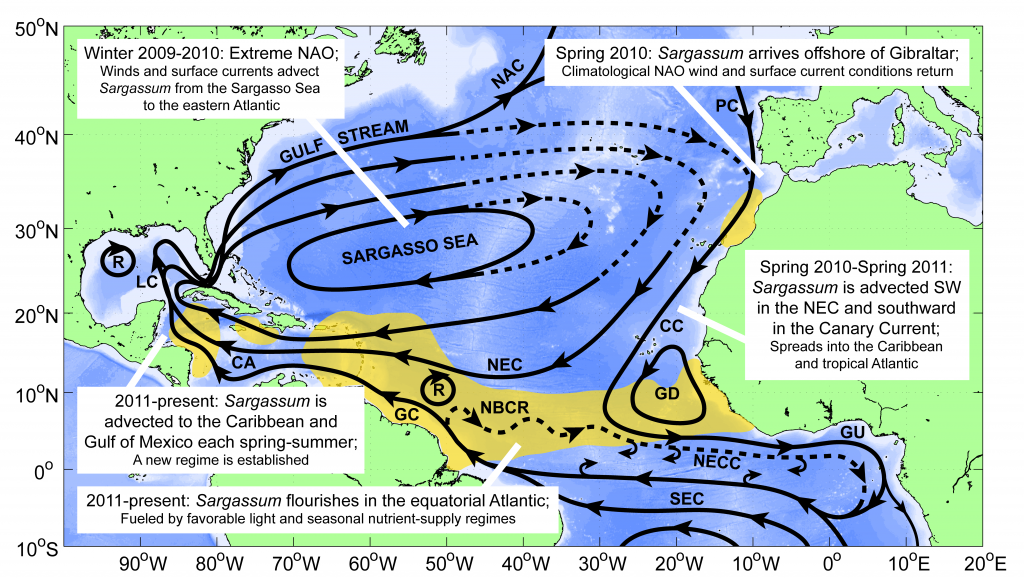
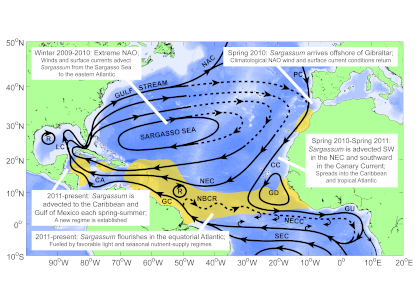
Figure 1. The hypothesized route of Sargasso Sea Sargassum to the tropical Atlantic and the Caribbean Sea. The solid black lines indicate the climatological surface flow, the dashed black lines indicate areas where there was variability from the average conditions.

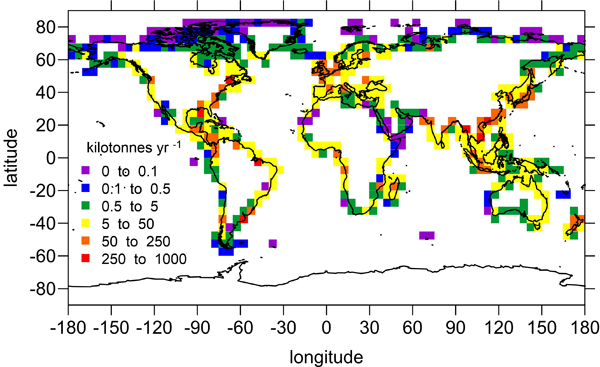
The authors analyzed reams of satellite data and used computer models of the Earth’s winds and ocean currents to try to understand why these large mats started to arrive in coastal areas in 2011. A strengthening and southward shift of the westerlies in the winter of 2009-2010 caused ocean currents to move the Sargassum toward the Iberian Peninsula, then southward in the Canary Current along Africa, where it entered the tropics by the middle of 2010 (Figure 1). The tropical Atlantic provided ample sunlight, warmer sea temperatures, and nutrients for the algae to flourish. In 2011, Sargassum spread across the entire tropical Atlantic in a massive belt north of the Equator, along the Intertropical Convergence Zone (ITCZ), and these blooms have appeared nearly every year since. Utilizing international oceanographic studies done in the Atlantic since the 1960s, and multiple satellite sensors combined with Sargassum distribution patterns, the authors discovered that the trade winds aggregate the Sargassum under the ITCZ and mix the water deep enough to bring new nutrients to the surface and sustain the bloom.

Improved understanding and predictive capacity of Sargassum bloom occurrence will help us better constrain and quantify its impacts on our ecosystems, which can inform management of valuable fisheries and protected species.


Authors:
Elizabeth Johns (NOAA AMOL)
Rick Lumpkin (NOAA AMOL)
Nathan Putman (LGL Ecological Research Associates)
Ryan Smith (NOAA AMOL)
Frank Muller-Karger (University of South Florida)
Digna Rueda-Roa (University of South Florida)
Chuanmin Hu (University of South Florida)
Mengqiu Wang (University of South Florida)
Maureen Brooks (University of Maryland Center for Environmental Science)
Lewis Gramer (NOAA AMOL and University of Miami)
Francisco Werner (NOAA Fisheries)

A new tidal non-photochemical quenching model reveals obscured variability in coastal chlorophyll fluorescence

Posted by mmaheigan 
· Tuesday, October 15th, 2019 

Although chlorophyll fluorescence is widely-used as a proxy for chlorophyll concentration, sunlight exposure makes fluorescence measurements inaccurate through a process called non-photochemical quenching, limiting its proxy accuracy during daylight hours. In the open ocean, where time and space scales are large relative to variability in phytoplankton concentration, daytime chlorophyll fluorescence—necessary for satellite algorithm validation and for understanding diurnal variability in phytoplankton abundance—can be estimated by averaging across successive nighttime, unquenched values. In coastal waters, where semidiurnal tidal advection drives small scale patchiness and short temporal variability, successive nighttime observations do not accurately represent the intervening daytime. Thus, it is necessary to apply a non-photochemical quenching correction that accounts for the additional effect of tidal advection.

In a recent study in L&O Methods, authors developed a model that uses measurements of tidal velocity to correct daytime chlorophyll fluorescence for non-photochemical quenching and tidal advection. The model identifies high tide and low tide endmember populations of phytoplankton from tidal velocity, and estimates daytime chlorophyll fluorescence as a conservative interpolation between endmember fluorescence at those tidal maxima and minima (Figure 1). Rather than removing nearly 12 hours’ worth of hourly chlorophyll fluorescence observations (i.e., all of the daytime observations) as was previously necessary, this model recovers them. The model output performs more accurately as a proxy for chlorophyll concentration than raw daytime chlorophyll fluorescence measurements by a factor of two, and enables tracking of phytoplankton populations with chlorophyll fluorescence in a Lagrangian sense from Eulerian measurements. Finally, because the model assumes conservation, periods of non-conservative variability are revealed by comparison between model and measurements, helping to elucidate controls on variability in phytoplankton abundance in coastal waters.

Figure 1: Model (light blue line) is a tidal interpolation between high tide (blue points) and low tide (red points) phytoplankton endmembers. The model represents nighttime, unquenched chlorophyll fluorescence measurements well (black points), while daytime, quenched measurements are visibly reduced (gray points).

This result is a critical achievement, as it enables the use of daytime chlorophyll fluorescence, which increases the temporal resolution of coastal chlorophyll fluorescence measurements, and also provides a mechanism for satellite validation of the ocean color chlorophyll data product in coastal waters. The model’s capacity to accurately simulate the pervasive effect of non-photochemical quenching makes it a vital tool for any researcher or coastal water manager measuring chlorophyll fluorescence. This model will help to provide new insights on the movement of and controls on phytoplankton populations across the land-ocean continuum.

Authors:
Luke Carberry (University of California, Santa Barbara)
Collin Roesler (Bowdoin College)
Susan Drapeau (Bowdoin College)


Nutrient and carbon limitation drive broad-scale patterns of mixotrophy in the ocean

Posted by mmaheigan 
· Tuesday, May 14th, 2019 

In the ocean, unicellular eukaryotes are often mixotrophic, which means they photosynthesize and also consume prey. In recent decades, it has become clear that mixotrophs are ubiquitous in sunlit ocean habitats. Additionally, models predict that mixotrophs have important impacts on productivity, nutrient cycling, carbon export, and food web structure. However, there is little understanding of the environmental conditions that select for a mixotrophic lifestyle, and it is unclear how mixotrophs succeed in competition with autotrophic and heterotrophic specialists. A recent study in PNAS that synthesized measurements of mixotrophic nanoflagellates showed that mixotrophs are more abundant in stratified, well-lit, low latitude environments (Figure 1A). They are also more abundant, relative to pure heterotrophs, in productive coastal environments (Figure 1B). A trait-based model analysis revealed that the success of mixotrophs depends on the fact that they are less nutrient-limited than autotrophs (due to prey-derived nutrients) and less carbon-limited than heterotrophs (due to photosynthesis). This synergy requires sufficient light, leading to success in low latitude environments. Similarly, a greater supply of dissolved nutrients relative to prey, as commonly observed in coastal environments, favors mixotrophs relative to heterotrophs. One implication of these results is that carbon fixation at lower latitudes may be enhanced by mixotrophy, while limiting nutrients may be more efficiently transferred to higher trophic levels.

Figure 1. Estimated abundance of autotrophic, mixotrophic, and heterotrophic nanoflagellates across environmental gradients in the ocean.


Author:
Kyle Edwards (Univ. Hawaii at Manoa)

Impacts of atmospheric nitrogen deposition and coastal nitrogen fluxes on oxygen concentrations in Chesapeake Bay

Posted by mmaheigan 
· Tuesday, April 30th, 2019 

How do atmospheric and oceanic nutrients impact oxygen concentrations in the Chesapeake Bay? Generally, researchers focus on how terrestrial nutrients impact hypoxia. The relative importance of river, atmosphere, and ocean inputs have not been quantified, largely because estimates of nitrogen fluxes from the atmosphere and ocean are limited.

A recent study in Journal of Geophysical Research: Oceans quantified the relative impacts of atmospheric and oceanic nitrogen inputs on dissolved oxygen (DO) in the Chesapeake Bay. The authors combined a 3-D biogeochemical model and estimates of atmospheric deposition from the Community Multiscale Air Quality model and interpolations of nitrogen concentrations along the continental shelf from the Ocean Acidification Data Stewardship Project. Atmospheric nitrogen deposition and coastal nitrogen fluxes most impact Chesapeake Bay DO concentrations during the summer when surface waters are depleted in nitrogen. Overall, atmospheric nitrogen deposition has about the same gram-for-gram impact on Chesapeake Bay DO as riverine loading. Although all three nutrient sources vary spatially and temporally, in the central bay, where summer hypoxia is most prevalent, coastal nitrogen fluxes and atmospheric nitrogen fluxes have roughly the same impact on bottom oxygen as a ~10% change in riverine nitrogen loading (Figure 1).

Figure caption: (Left) Four-year (2002–2005) average increase in DO in the summer by removing the atmospheric nitrogen deposition (AtmN), reducing the riverine loading (ΔRiverN) by ~10% (roughly equivalent to turning off the atmospheric deposition), and removing the nitrogen fluxes from the continental shelf (CoastalN). (Right) Relative impacts of the three nitrogen modification scenarios on summertime bottom DO.

These results indicate that two often-neglected sources of nitrogen—direct atmospheric deposition and fluxes of nitrogen from the continental shelf—substantially impact Chesapeake Bay DO, especially in the summer. Future study is needed to investigate the long-term trend of these relative impacts by continued coordination between modeling and observational work, such as applying higher-resolution atmospheric deposition products and integrating more in situ data along the model ocean boundary when they are available. These efforts will improve our understanding of the impacts of different nutrient sources on biogeochemical cycles in coastal water bodies.


Authors:
Fei Da (VIMS, College of William & Mary)
Marjorie A. M. Friedrichs (VIMS, College of William & Mary)
Pierre St-Laurent (VIMS, College of William & Mary)

When it comes to carbon export, the mesoscale matters

Posted by hbenway 
· Tuesday, September 11th, 2018 

Figure 1. Difference in annual mean carbon export (ΔPOC flux) between a high resolution (0.1º, Hi-res) and standard resolution (1º, Analog) global climate model simulation using the CESM model. Highlighted regions show areas where vertical (purple boxes) and horizontal (red boxes) changes in nutrient transport drive increases or decreases in export, respectively.

Most Earth System models (ESMs) that are used to study global climate and the carbon cycle do not resolve the most energetic scales in the ocean, the mesoscale (10-100 km), encompassing eddies, coastal jets, and other dynamic features strongly affecting nutrient delivery, productivity, and carbon export. This prompts the question: What are we missing in climate models by not resolving the mesoscale?

Authors of a recent study published in Global Biogeochemical Cycles conducted a comparative analysis of the importance of mesoscale features in biological production and associated carbon export using standard resolution (1°) and mesoscale-resolving (0.1°) ESM simulations. The mesoscale-resolving ESM yielded only a ~2% reduction in globally integrated export production relative to the standard resolution ESM. However, a closer look at the local processes driving export in different basins revealed much larger, compensating differences (Fig. 1). For example, in regions where biological production is driven by natural iron fertilization from shelf sediment sources (Fig. 2), improved representation of coastal jets in the higher-resolution ESM reduces the cross-shelf iron delivery that fuels production (red boxes in Fig. 1). Resolving mesoscale turbulence further reduces the spatial extent of blooms and associated export, yielding a more patchy distribution than in the coarse resolution models. Together, these processes lead to a reduction in export in the Argentine Basin, one of the most productive regions on the planet, of locally up to 50%. In contrast, resolving the mesoscale results in enhanced export production in the Subantarctic (purple box in Fig. 1), where the mesoscale model resolves deeper, narrower mixed layer depths that support stronger nutrient entrainment, in turn enhancing local productivity and export.

Figure 2. An iron-driven plankton bloom structured by mesoscale features in the South Atlantic. Left is simulated dissolved iron (Fe), the limiting nutrient for this region, and right is iron in all phytoplankton classes, a proxy for biomass (phytoFe, shown in log10 scale), on January 11, the height of the bloom. Plankton blooms in the Subantarctic Atlantic are fueled by horizontal iron transport off coastal and island shelves and vertical injection from seamounts, whereas farther south in the Southern Ocean, winter vertical mixing is the primary driver of iron delivery. Mesoscale circulation, largely an unstructured mix of interacting jets and vortices, strongly affects the location and timing of carbon production and export. Click here for an animation.

In regions with very short productivity seasons like the North Pacific and Subantarctic, internally generated mesoscale variability (captured in the higher resolution ESM) yields significant interannual variation in local carbon export. In these regions, a few eddies, filaments or more amorphous mesoscale features can structure the entire production and export pattern for the short bloom season. These findings document the importance of resolving mesoscale features in ESMs to more accurately quantify carbon export, and the different roles mesoscale variability can play in different oceanographic settings.

Determining how to best sample these mesoscale turbulence-dominated blooms and scale up these measurements to regional and longer time means, is an outstanding joint challenge for modelers and observationalists. A key piece is obtaining the high temporal and spatial resolution data sets needed for validating modeled carbon export in bloom regions strongly impacted by mesoscale dynamics, which represent a large portion of the global carbon export.

Authors
Cheryl Harrison (NCAR, University of Colorado Boulder)
Matthew Long (NCAR)
Nicole Lovenduski (University of Colorado Boulder)
J. Keith Moore (University of California Irvine)

Shelf-wide pCO2 increase across the South Atlantic Bight

Posted by mmaheigan 
· Thursday, August 2nd, 2018 

Relative to their surface area, coastal regions represent some of the largest carbon fluxes in the global ocean, driven by numerous physical, chemical and biological processes. Coastal systems also experience human impacts that affect carbon cycling, which has large socioeconomic implications. The highly dynamic nature of these systems necessitates observing approaches and numerical methods that can both capture high-frequency variability and delineate long-term trends.

Figure 1: The South Atlantic Bight (SAB) was divided into four sections using isobaths: the coastal zone (0 to 15 m), the inner shelf (15 to 30 m), the middle shelf (30 to 60 m), and the outer shelf (60 m and beyond). The X’s indicate the locations of the Gray’s Reef mooring (southern X) and the Edisto mooring (northern X).

In two recent studies using mooring- and ship-based ocean CO2 system data, authors observed that pCO2 is increasing from the coastal zone to the outer shelf of the South Atlantic Bight at rates greater than the global average oceanic and atmospheric increase (~1.8 µatm y-1). In recent publications in Continental Shelf Research and JGR-Oceans, the authors analyzed pCO2 data from 46 cruises (1991-2016) using a novel linear regression technique to remove the seasonal signal, revealing an increase in pCO2 of 3.0-3.7 µatm y-1 on the outer and inner shelf, respectively. Using a Generalized Additive Mixed Model (GAMM) approach for trend analysis, authors observed that the rates of increase were slightly higher than the deseasonalization technique, yielding pCO2 increases of 3.3 to 4.5 µatm y-1 on the outer and inner shelf, respectively. The reported pCO2 increases result in potential pH decreases of -0.003 to -0.004 units y-1.

Figure 2: The time series of fCO2 in the four regions of the SAB (cruise observations) and from the Gray’s Reef mooring on the inner shelf indicate an increase across the shelf. These data are the observed values, however, the trend lines for each time series are calculated using deseasonalized values using the reference year method.

Analysis of the pCO2 time-series from the Gray’s Reef mooring (using a NOAA Moored Autonomous pCO2 system from July 2006 -July 2015) yielded a rate of increase (3.5 ± 0.9 µatm y-1) that was comparable to the cruise data on the inner shelf (3.7 ± 2.2 and 4.5 ± 0.6 µatm y-1, linear and GAMM methods, respectively). Validation data collected at the mooring suggest that underway data from cruises and the moored data are comparable. Neither thermal processes nor atmospheric dissolution (the primary driver of oceanic acidification) can explain the observed pCO2 increase and concurrent pH decrease across the shelf. Unlike the middle and outer shelves, where an increase in SST could account for up to 1.1 µatm y-1 of the observed pCO2 trend, there is no thermal influence in the coastal zone and inner shelf. While 1.8 µatm y-1 could be attributed to the global average atmospheric increase, the remainder is likely due to transport from coastal marshes and in situ biological processes.  As the authors have shown, the increasing coastal and oceanic trend in pCO2 can lead to a decrease in pH, especially if there is no increase in buffering capacity.  More acidic waters can have a long term affect on coastal ecosystem services and biota.

Also see Eos Editor’s Vox on this research by Peter Brewer https://eos.org/editors-vox/coastal-ocean-warming-adds-to-co2-burden

Authors:

Multidecadal fCO2 Increase Along the United States Southeast Coastal Margin (JGR-Oceans)
Janet J. Reimer (University of Delaware)
Hongjie Wang (Texas A &M University – Corpus Christi)
Rodrigo Vargas (University of Delaware)
Wei-Jun Cai (University of Delaware)

And

Time series pCO2 at a coastal mooring: Internal consistency, seasonal cycles, and interannual variability (Continental Shelf Research)
Janet J. Reimer (University of Delaware)
Wei-Jun Cai (University of Delaware; University of Georgia)
Liang Xue (University of Delaware; First Institute of Oceanography, China)
Rodrigo Vargas (University of Delaware)
Scott Noakes (University of Georgia)
Xinping Hu (Texas A &M University – Corpus Christi)
Sergio R. Signorini (Science Applications International Corporation)
Jeremy T. Mathis (NOAA Arctic Research Program)
Richard A. Feely (NOAA Pacific Marine Environmental Laboratory)
Adrienne J. Sutton (NOAA Pacific Marine Environmental Laboratory; University of Washington)
Christopher Sabine (University of Hawaii Manoa)
Sylvia Musielewicz (NOAA Pacific Marine Environmental Laboratory; University of Washington)
Baoshan Chen (University of Delaware; University of Georgia)
Rik Wanninkhof (NOAA Atlantic Oceanographic and Meteorological Laboratory)

Long-term coastal data sets reveal unifying relationship between oxygen and pH fluctuations

Posted by mmaheigan 
· Thursday, June 7th, 2018 

Coastal habitats are critically important to humans, but without consistent and reliable observations we cannot understand the direction and magnitude of unfolding changes in these habitats. Environmental monitoring is therefore a prescient—yet still undervalued—societal service, and no effort better exemplifies this than the work conducted within the National Estuarine Research Reserve System (NERRS). NERRS is a network of 29 U.S. estuarine sites operated as a partnership between NOAA and the coastal states. NERRS has established a system-wide monitoring program with standardized instrumentation, protocols, and data reporting to guide consistent and comparable data collection across all NERRS sites. This has resulted in high-quality, comparable data on short- to long-term changes in water quality and biological systems to inform effective coastal zone management.

Figure 1: Using dissolved oxygen and salinity, monthly mean pH can be predicted within and across coastal systems due to the unifying metabolic coupling of oxygen and pH.


In a recent study published in Estuaries and Coasts, Baumann and Smith (2017) used a subset of this unique data set to analyze short- and long-term variability in pH and dissolved oxygen (DO) at 16 NERRS sites across the U.S. Atlantic, Caribbean, Gulf of Mexico, and Pacific coasts (> 5 million data points). They observed that large, metabolically driven fluctuations of pH and DO are indeed a unifying feature of nearshore habitats. Furthermore, mean pH or mean diel pH fluctuations can be predicted across habitats simply from salinity and oxygen levels/fluctuations (Fig.1). These results provide strong empirical evidence that common metabolic principles drive diel to seasonal pH and DO variations within and across a diversity of estuarine environments. As expected, the study did not yield interannual, monotonic trends in nearshore pH conditions; rather, interannual fluctuations were of similar magnitude to the pH decrease predicted for the average surface ocean over the next three centuries (Fig.2). Correlations of weekly anomalies of pH, oxygen, and temperature yielded strong empirical support for the hypothesis that coastal acidification—in addition to being driven by eutrophication and atmospheric CO2 increases—is exacerbated by warming, likely via increased community respiration.

Figure 2: Interannual variations in temperature, pH, and dissolved oxygen (DO) anomalies in 16 NERRS sites across the US Atlantic, Gulf of Mexico, Caribbean, and Pacific coasts.

Analyses of these long-term data sets have provided important insights on biogeochemical variability and underlying drivers in nearshore environments, highlighting the value and utility of long-term monitoring efforts like NERRS. Sustained, high-quality data sets in these nearshore environments are essential for the study of environmental change and should be prioritized by funding agencies. The observed metabolically driven pH and DO fluctuations suggest that local measures to reduce nutrient pollution can be an effective management tool in support of healthy coastal environments, a boon for both the habitats and humans.


Authors:
Hannes Baumann (University of Connecticut)
Erik M. Smith (North Inlet-Winyah Bay National Estuarine Research Reserve, University of South Carolina)

Seagrass carbon dynamics: Gulf of Mexico

Posted by mmaheigan 
· Thursday, March 1st, 2018 

Seagrasses have died-off in great numbers, resulting in the release of stored carbon. Seagrasses represent a substantive and relatively unconstrained North American and Caribbean Sea blue carbon sink in the tropical Western Hemisphere. Fine-scale estimates of regional seagrass carbon stocks, as well as carbon fluxes from anthropogenic disturbances and natural processes and gains in sedimentary carbon from seagrass restoration are currently lacking for the bulk of tropical Western Hemisphere seagrass systems.

To address this knowledge gap, in the subtropics and tropics, a recent study yielded estimates of organic carbon (Corg) stocks, losses, and restoration gains from several seagrass beds around the Gulf of Mexico (GoM). GoM-wide seagrass natural Corg stocks were estimated to be ~37.2–37.5Tg Corg. A unique method involving quadruplicate sampling in naturally-occurring, restored, continually-historically barren, and previously-disturbed-now-barren sites provided the first available Corg loss measurements for subtropical-tropical seagrasses. GoM Corg losses were slow, occurring over multiple years, and differed between sites, depending on disturbance type. Mean restored seagrass bed Corg stocks exceeded those of natural seagrass beds, underscoring the importance of seagrass restoration as a viable carbon sequestration strategy. For restored seagrass areas, the older the restoration site, the greater the Corg stock.

Organic carbon stocks for Gulf of Mexico sediments for the top 20 cm of sediment in always barren, impacted barren, natural seagrass, and restored seagrass sites. Natural and restored seagrass beds had significantly higher organic carbon stocks than impacted barren or always barren sediments.

Seagrass restoration appears to be an important tool for climate-change mitigation. In the USA and throughout the tropics and subtropics, restoration could reduce sedimentary carbon leakage and bolster total blue carbon stores, while facilitating increased fisheries and shoreline stability. Although well-planned and executed restoration of seagrass is more difficult than mangroves or marshes, there are >1 million hectares of degraded seagrass habitats that could be restored, which would greatly increase blue carbon sinks and support diverse marine species that rely on seagrass for habitat and food.


Authors:
Anitra Thorhaug (Yale School of Forestry)
Helen M. Poulos (Earth Sci., Wesleyan Univ.)
Jorge López-Portillo (Inecol, Mexico)
Timothy C.W. Ku (Earth Sci., Wesleyan Univ.)
Graeme P. Berlyn (Yale School of Forestry)

Untangling the mystery of domoic acid events: A climate-scale perspective

Posted by mmaheigan 
· Thursday, August 3rd, 2017 

The diatom Pseudo-nitzchia produces a neurotoxin called domoic acid, which in high concentrations affects wildlife ranging from mussels and crabs to seabirds and sea lions, as well as humans. In humans, the effects of domoic acid poisoning can range from gastrointestinal distress to memory loss, and even death. Despite being studied in laboratories since the late 1980s, there is no consensus on the environmental conditions that lead to domoic acid events. These events are most frequent and impactful in eastern boundary current regions such as the California Current System, which is bordered by Washington, Oregon, and California. In Oregon alone, there have been six major domoic acid events: 1996, 1998-1999, 2001, 2002-2006, 2010, 2014-2015. McKibben et al. (2017) investigated the regulation of domoic acid at a climate scale to develop and test an applied risk model for the US West Coast” to read “McKibben et al. (2017) investigated the regulation of domoic acid at regional and decadal scales in order to develop and test an applied risk model for the impact of climate on the US West Coast. They used the PDO and ONI climate variability indices, averages of monthly and 3 month running means of SST anomaly values and variability to look at basin-scale ocean conditions. At a local scale, data were from zooplankton sampling every two to four weeks between 1996 to 2015 at hydrographic station offshore of Newport, OR. Additionally, the NOAA NCDC product “Daily Optimum Interpolation, Advanced Very High Resolution Radiometer Only, Version 2, Final+Preliminary SST” was used to obtain the monthly SST anomaly metric, based on combined in situ and satellite data.


(A) Warm and cool ocean regimes, (B) local SST anomaly, and (C and D) biological response. (A) PDO (red or blue vertical bars) and ONI (black line) indices; strong (S) to moderate (M) El Nino (+1) and La Nina (−1) events are labeled. (B) SST anomaly 20 nm off central OR. (C) The CSR anomaly 5 nm off central OR. (D) Monthly OR coastal maximum DA levels in razor clams (vertical bars); horizontal black line is the 20-ppm closure threshold. Black line in D shows the spring biological transition date (right y axis). At the top of the figure, black boxes indicate the duration of upwelling season each year; red vertical bars indicate the timing of annual DA maxima in relationship to upwelling. Gray shaded regions are warm regimes based on the PDO. Dashed vertical lines indicate onset of the six major DA events. The September 2014 arrival of the NE Pacific Warm Anomaly (colloquially termed “The Blob”) to the OR coastal region is labeled on B. “X” symbols along the x axes indicate that no data were available for that month (B–D).

Their findings show that these events have occurred when there is advection of warmer water masses onto the continental shelf from southern or offshore areas. When the warm phase of the Pacific Decadal Oscillation (PDO) and El Niño coincide, the effect is additive. In the warm regime years, there is a later spring biological transition date, weaker alongshore currents, elevated water temperatures, and plankton communities are dominated by subtropical rather than subarctic species. The authors also note relative differences between the prevalence and phenology of domoic acid events in OR, CA and WA, which warrants further study via regional-scale modeling. Overall, this research shows a clear and enhanced risk of toxicity in shellfish during warm phases of natural climate oscillations. If predictions of more extreme warming come to bear, this would potentially lead to increased DA event intensity and frequency in coastal zones around the globe. This will not only affect wildlife, but may cause significant closures of economically important fisheries (e.g., Dungeness crab, anchovy, mussel, and razor clam), which would impact local communities and native populations.


Authors:
Morgaine McKibben (Oregon State Univ., NOAA Northwest Fisheries Science Center)
William Peterson (NOAA Northwest Fisheries Science Center)
Michelle Wood (Univ. Oregon)
Vera L. Trainer (NOAA Northwest Fisheries Science Center)
Matthew Hunter (Oregon Dept. Fish & Wildlife)
Angelicque E. White (Oregon State Univ.)

Do rivers supply nutrients to the open ocean?

Posted by mmaheigan 
· Wednesday, May 24th, 2017 

Rivers carry large amounts of nutrients (e.g., nitrogen and phosphorus) to the sea, but we do not know how much of that riverine nutrient supply escapes biological and chemical processing in shallow coastal waters to reach the open ocean. Most global ocean biogeochemical models, which are typically unable to resolve coastal processes, assume that either all or none of the riverine nutrients entering coastal waters actually contribute to open ocean processes.

While we know a good deal about the dynamics of individual rivers entering the coastal ocean, studies to date have been limited to a few major river systems, mainly in in developed countries. Globally, there are over 6,000 rivers entering the coastal ocean. In a recent study, Sharples et al (2017) devised a simple approach to obtain a global-scale estimate of riverine nutrient inputs based on the knowledge that low-salinity waters entering the coastal ocean tend to form buoyant plumes that turn under the influence of Earth’s daily rotation to flow along the coastline. Using published data on such flows and incorporating the effect of Earth’s rotation, they obtained estimates of typical cross-shore plume width and compared them to the local width of the continental shelf. This was used to calculate the residence time of riverine nutrients on the shelf, which is the key to estimating how much of a given nutrient is consumed in shelf waters vs. how much is exported to the open ocean.

Global distribution of the amount of riverine dissolved inorganic nitrogen that escapes the continental shelf to reach the open ocean.

The results indicate that, on a global scale, 75% (80%) of the nitrogen (phosphorus) supplied by rivers reaches the open ocean, whereas 25% (20%) of the nitrogen (phosphorus) is consumed on the shelf (e.g., fueling coastal productivity). Limited knowledge of nutrient cycling and consumption in shelf waters represents the primary source of uncertainty in this study. However, well-defined global patterns related to human land use (e.g., agricultural fertilizer use in developed nations) emerged from this analysis, underscoring the need to understand how land-use changes and other human activities will alter nutrient delivery to the coastal ocean in the future.


Authors:
Jonathan Sharples (School of Environmental Sciences, University of Liverpool, UK)
Jack Middelburg (Department of Earth Sciences, Utrecht University, Netherlands)
Katja Fennel (Department of Oceanography, Dalhousie University, Canada)
Tim Jickells (School of Environmental Sciences, University of East Anglia, UK)

« Previous Page
Next Page »

Filter by Keyword

abundance acidification additionality advection africa air-sea air-sea interactions algae alkalinity allometry ammonium AMO AMOC anoxic Antarctic Antarctica anthro impacts anthropogenic carbon anthropogenic impacts appendicularia aquaculture aquatic continuum aragonite saturation arctic Argo argon arsenic artificial seawater AT Atlantic atmospheric CO2 atmospheric nitrogen deposition authigenic carbonates autonomous platforms AUVs bacteria bathypelagic BATS BCG Argo benthic bgc argo bio-go-ship bio-optical bioavailability biogeochemical cycles biogeochemical models biogeochemistry Biological Essential Ocean Variables biological pump biophysics bloom blue carbon bottom water boundary layer buffer capacity C14 CaCO3 calcification calcite carbon carbon-climate feedback carbon-sulfur coupling carbonate carbonate system carbon budget carbon cycle carbon dioxide carbon export carbon fluxes carbon sequestration carbon storage Caribbean CCA CCS changing marine chemistry changing marine ecosystems changing marine environments changing ocean chemistry chemical oceanographic data chemical speciation chemoautotroph chesapeake bay chl a chlorophyll circulation clouds CO2 CO3 coastal and estuarine coastal darkening coastal ocean cobalt Coccolithophores commercial community composition competition conservation cooling effect copepod copepods coral reefs CTD currents cyclone daily cycles data data access data assimilation database data management data product Data standards DCM dead zone decadal trends decomposers decomposition deep convection deep ocean deep sea coral denitrification deoxygenation depth diatoms DIC diel migration diffusion dimethylsulfide dinoflagellate dinoflagellates discrete measurements distribution DOC DOM domoic acid DOP dust DVM ecology economics ecosystem management ecosystems eddy Education EEZ Ekman transport emissions ENSO enzyme equatorial current equatorial regions ESM estuarine and coastal carbon fluxes estuary euphotic zone eutrophication evolution export export fluxes export production extreme events faecal pellets fecal pellets filter feeders filtration rates fire fish Fish carbon fisheries fishing floats fluid dynamics fluorescence food webs forage fish forams freshening freshwater frontal zone functional role future oceans gelatinous zooplankton geochemistry geoengineering geologic time GEOTRACES glaciers gliders global carbon budget global ocean global warming go-ship grazing greenhouse gas greenhouse gases Greenland ground truthing groundwater Gulf of Maine Gulf of Mexico Gulf Stream gyre harmful algal bloom high latitude human food human impact human well-being hurricane hydrogen hydrothermal hypoxia ice age ice cores ice cover industrial onset inland waters in situ inverse circulation ions iron iron fertilization iron limitation isotopes jellies katabatic winds kelvin waves krill kuroshio lab vs field land-ocean continuum larvaceans lateral transport LGM lidar ligands light light attenuation lipids low nutrient machine learning mangroves marine carbon cycle marine heatwave marine particles marine snowfall marshes mCDR mechanisms Mediterranean meltwater mesopelagic mesoscale mesoscale processes metagenome metals methane methods microbes microlayer microorganisms microplankton microscale microzooplankton midwater mitigation mixed layer mixed layers mixing mixotrophs mixotrophy model modeling model validation mode water molecular diffusion MPT MRV multi-decade n2o NAAMES NCP nearshore net community production net primary productivity new ocean state new technology Niskin bottle nitrate nitrogen nitrogen cycle nitrogen fixation nitrous oxide north atlantic north pacific North Sea NPP nuclear war nutricline nutrient budget nutrient cycles nutrient cycling nutrient limitation nutrients OA observations ocean-atmosphere ocean acidification ocean acidification data ocean alkalinity enhancement ocean carbon storage and uptake ocean carbon uptake and storage ocean color ocean modeling ocean observatories ocean warming ODZ oligotrophic omics OMZ open ocean optics organic particles oscillation outwelling overturning circulation oxygen pacific paleoceanography PAR parameter optimization parasite particle flux particles partnerships pCO2 PDO peat pelagic PETM pH phenology phosphate phosphorus photosynthesis physical processes physiology phytoplankton PIC piezophilic piezotolerant plankton POC polar polar regions policy pollutants precipitation predation predator-prey prediction pressure primary productivity Prochlorococcus productivity prokaryotes proteins pteropods pycnocline radioisotopes remineralization remote sensing repeat hydrography residence time resource management respiration resuspension rivers rocky shore Rossby waves Ross Sea ROV salinity salt marsh satellite scale seafloor seagrass sea ice sea level rise seasonal seasonality seasonal patterns seasonal trends sea spray seawater collection seaweed secchi sediments sensors sequestration shelf ocean shelf system shells ship-based observations shorelines siderophore silica silicate silicon cycle sinking sinking particles size SOCCOM soil carbon southern ocean south pacific spatial covariations speciation SST state estimation stoichiometry subduction submesoscale subpolar subtropical sulfate surf surface surface ocean Synechococcus technology teleconnections temperate temperature temporal covariations thermocline thermodynamics thermohaline thorium tidal time-series time of emergence titration top predators total alkalinity trace elements trace metals trait-based transfer efficiency transient features trawling Tris trophic transfer tropical turbulence twilight zone upper ocean upper water column upwelling US CLIVAR validation velocity gradient ventilation vertical flux vertical migration vertical transport warming water clarity water mass water quality waves weathering western boundary currents wetlands winter mixing zooplankton

Copyright © 2025 - OCB Project Office, Woods Hole Oceanographic Institution, 266 Woods Hole Rd, MS #25, Woods Hole, MA 02543 USA Phone: 508-289-2838  •  Fax: 508-457-2193  •  Email: ocb_news@us-ocb.org

link to nsflink to noaalink to WHOI

Funding for the Ocean Carbon & Biogeochemistry Project Office is provided by the National Science Foundation (NSF) and the National Aeronautics and Space Administration (NASA). The OCB Project Office is housed at the Woods Hole Oceanographic Institution.