Ocean Carbon & Biogeochemistry
Studying marine ecosystems and biogeochemical cycles in the face of environmental change
  • Home
  • About OCB
    • About Us
    • Scientific Breadth
      • Biological Pump
      • Changing Marine Ecosystems
      • Changing Ocean Chemistry
      • Estuarine and Coastal Carbon Fluxes
      • Ocean Carbon Uptake and Storage
      • Ocean Observatories
    • Code of Conduct
    • Get Involved
    • Project Office
    • Scientific Steering Committee
    • OCB committees
      • Ocean Time-series
      • US Biogeochemical-Argo
      • Ocean-Atmosphere Interaction
  • Activities
    • Summer Workshop
    • OCB Webinars
    • Guidelines for OCB Workshops & Activities
    • Topical Workshops
      • CMIP6 Models Workshop
      • Coastal BGS Obs with Fisheries
      • C-saw extreme events workshop
      • Expansion of BGC-Argo and Profiling Floats
      • Fish, fisheries and carbon
      • Future BioGeoSCAPES program
      • GO-BCG Scoping Workshop
      • Lateral Carbon Flux in Tidal Wetlands
      • Leaky Deltas Workshop – Spring 2025
      • Marine CDR Workshop
      • Ocean Nucleic Acids ‘Omics
      • Pathways Connecting Climate Changes to the Deep Ocean
    • Small Group Activities
      • Aquatic Continuum OCB-NACP Focus Group
      • Arctic-COLORS Data Synthesis
      • BECS Benthic Ecosystem and Carbon Synthesis WG
      • Carbon Isotopes in the Ocean Workshop
      • CMIP6 WG
      • Filling the gaps air–sea carbon fluxes WG
      • Fish Carbon WG
      • Meta-eukomics WG
      • mCDR
      • Metaproteomic Intercomparison
      • Mixotrophs & Mixotrophy WG
      • N-Fixation WG
      • Ocean Carbonate System Intercomparison Forum
      • Ocean Carbon Uptake WG
      • OOI BGC sensor WG
      • Operational Phytoplankton Observations WG
      • Phytoplankton Taxonomy WG
    • Other Workshops
    • Science Planning
      • Coastal CARbon Synthesis (CCARS)
      • North Atlantic-Arctic
    • Ocean Acidification PI Meetings
    • Training Activities
      • PACE Hackweek 2025
      • PACE Hackweek 2024
      • PACE Training Activity 2022
  • Science Support
    • Data management and archival
    • Early Career
    • Funding Sources
    • Jobs & Postdocs
    • Meeting List
    • OCB Topical Websites
      • Ocean Fertilization
      • Trace gases
      • US IIOE-2
    • Outreach & Education
    • Promoting your science
    • Student Opportunities
    • OCB Activity Proposal Solicitations
      • Guidelines for OCB Workshops & Activities
    • Travel Support
  • Publications
    • OCB Workshop Reports
    • Science Planning and Policy
    • Newsletter Archive
  • Science Highlights
  • News

Archive for ESM

Quantifying uncertainties in future projections of Chesapeake Bay Hypoxia

Posted by mmaheigan 
· Wednesday, December 4th, 2024 

Climate change is expected to especially impact coastal zones, worsening deoxygenation in the Chesapeake Bay by reducing oxygen solubility and increasing remineralization rates of organic matter. However, simulated responses of this often fail to account for uncertainties embedded within the application of future climate scenarios.

Recent research published in Biogeosciences and in Scientific Reports sought to tackle multiple sources of uncertainty in future impacts to dissolved oxygen levels by simulating multiple climate scenarios within the Chesapeake Bay region using a coupled hydrodynamic-biogeochemical model. In Hinson et al. (2023), researchers showed that a multitude of climate scenarios projected a slight increase in hypoxia levels due solely to watershed impacts, although the choice of global earth system model, downscaling methodology, and watershed model equally contributed to the relative uncertainty in future hypoxia estimates. In Hinson et al. (2024), researchers also found that the application of climate change scenario forcings itself can have an outsized impact on Chesapeake Bay hypoxia projections. Despite using the same inputs for a set of three experiments (continuous, time slice, and delta), the more commonly applied delta method projected an increase in levels of hypoxia nearly double that of the other experiments. The findings demonstrate the importance of ecosystem model memory, and fundamental limitations of the delta approach in capturing long-term changes to both the watershed and estuary. Together these multiple sources of uncertainty interact in unanticipated ways to alter estimates of future discharge and nutrient loadings to the coastal environment.
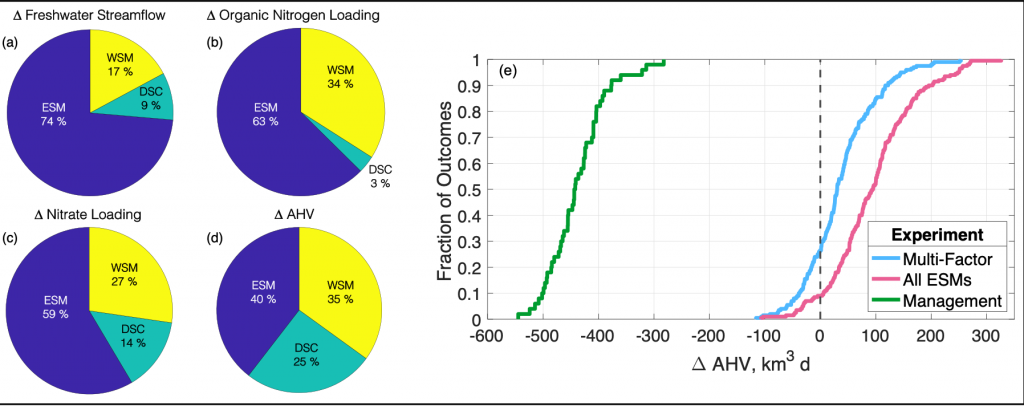
Figure 1: Chesapeake Bay hypoxia is sensitive to multiple sources of uncertainty related to the type of climate projection applied and the effect of management actions. Percent contribution to uncertainty from Earth System Model (ESM), downscaling methodology (DSC), and watershed model (WSM) for estimates of (a) freshwater streamflow, (b) organic nitrogen loading, (c) nitrate loading, and (d) change in annual hypoxic volume (ΔAHV). (e) Summary of all experiment results for ΔAHV, expressed as a cumulative distribution function. The Multi-Factor experiment (blue line) used a combination of multiple ESMs, DSCs, and WSMs, the All ESMs experiment (pink line) simulated 20 ESMs while holding the DSC and WSM constant, and the Management experiment (green line) only simulated 5 ESMs with a single DSC and WSM but incorporated reductions in nutrient inputs to the watershed. The vertical dashed black line marks no change in AHV.

Understanding the relative sources of uncertainty and impacts of environmental management actions can improve our confidence in mitigating negative climate impacts on coastal ecosystems. Better quantifying contributions of model uncertainty, that is often unaccounted for in projections, can constrain the range of outcomes and improve confidence in future simulations for environmental managers.
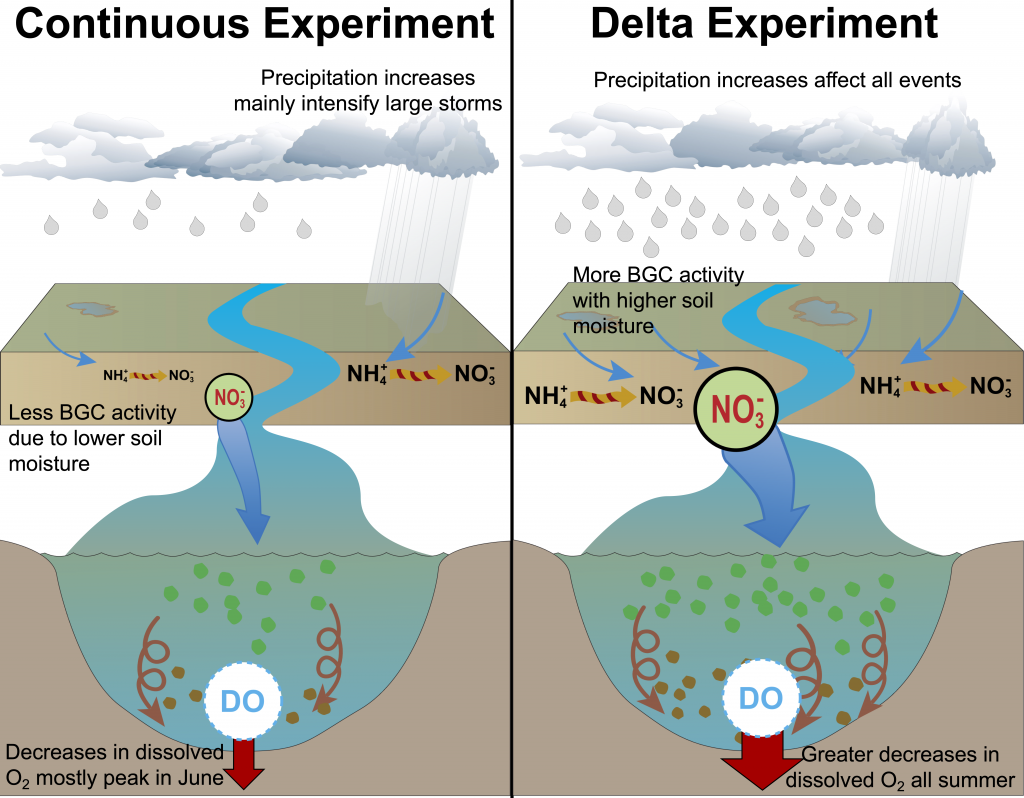
Figure 2: A schematic of differences between the Continuous and Delta experiments. In the Delta experiment a combination of altered distributions in future precipitation and changes to long-term soil nitrogen stores eventually result in increased levels of hypoxia (right panel).


Authors
Kyle E. Hinson (Virginia Institute of Marine Science, William & Mary)
Marjorie A. M. Friedrichs (Virginia Institute of Marine Science, William & Mary)
Raymond G. Najjar (The Pennsylvania State University)
Maria Herrmann (The Pennsylvania State University)
Zihao Bian (Auburn University)
Gopal Bhatt (The Pennsylvania State University, USEPA Chesapeake Bay Program Office)
Pierre St-Laurent (Virginia Institute of Marine Science, William & Mary)
Hanqin Tian (Boston College)
Gary Shenk (USGS Virginia/West Virginia Water Science Center)

Unveiling the Past and Future of Ocean Acidification: A Novel Data Product covering 10 Global Surface OA Indicators

Posted by mmaheigan 
· Wednesday, August 23rd, 2023 

Accurately predicting future ocean acidification (OA) conditions is crucial for advancing research at regional and global scales, and guiding society’s mitigation and adaptation efforts.

As an update to Jiang et al. 2019, this new model-data fusion product:
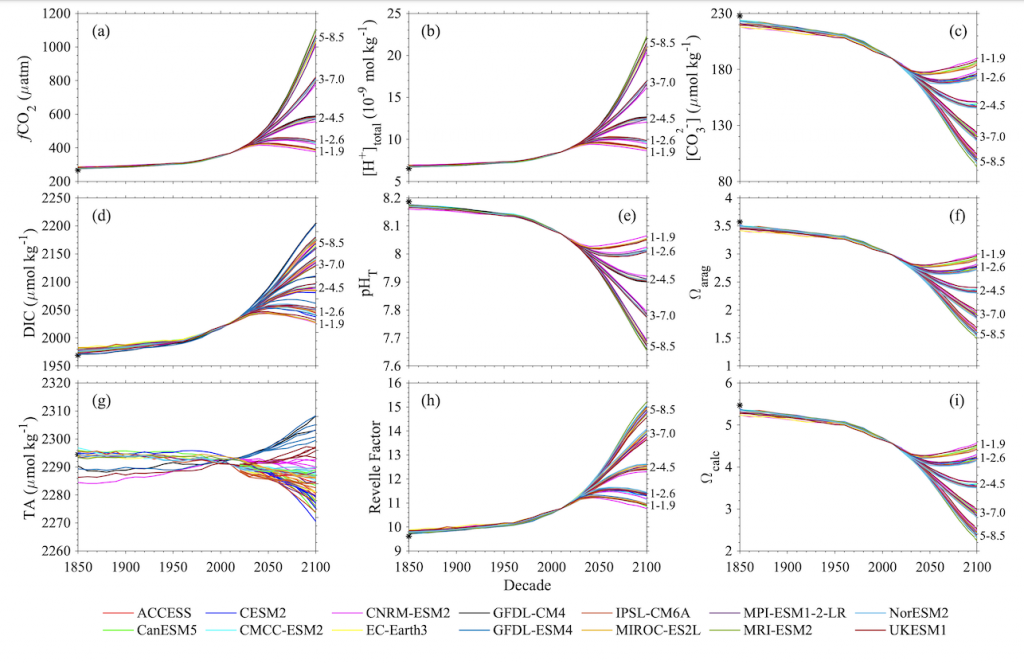
1. Utilizes an ensemble of 14 distinct Earth System Models from the Coupled Model Intercomparison Project Phase 6 (CMIP6) along with three recent observational ocean carbon data products –>instead of relying on just one model (i.e., the GFDL-ESM2M) this approach reduces potential projection biases in OA indicators.
2. Eliminates model biases using observational data, and model drift with pre-Industrial controls.
3. Covers 10 OA indicators, an expansion from the usual pH, acidity, and buffer capacity.
4. Incorporates the new Shared Socioeconomic Pathways (SSPs).

The use of the most recent observational datasets and a large Earth System Model ensemble is a major step forward in the projection of future surface ocean OA indicators and provides critical information to guide OA mitigation and adaptation efforts.

Figure X. Temporal changes of global average surface ocean OA indicators as reconstructed and projected from 14 CMIP6 Earth System Models after applying adjustments with observational data: (a) fugacity of carbon dioxide (fCO2), (b) total hydrogen ion content ([H+]total), (c) carbonate ion content ([CO32-]), (d) total dissolved inorganic carbon content (DIC), (e) pH on total scale (pHT), (f) aragonite saturation state (Ωarag), (g) total alkalinity content (TA), (h) Revelle Factor (RF), and (i) calcite saturation state (Ωcalc). The asterisk signs on the left-side y-axes show the values in 1750. The numbers along right-side y-axes, i.e., 1-1.9, 1-2.6, 2-4.5, 3-7.0, and 5-8.5, indicate the shared socioeconomic pathway SSP1-1.9, SSP1-2.6, SSP2-4.5, SSP3-7.0, and SSP5-8.5, respectively. These are missing from panel g because the trajectories were more dependent on the model than the SSP.

Authors
Li-Qing Jiang (University Maryland)
John Dunne (NOAA/Geophysical Fluid Dynamics Laboratory)
Brendan R. Carter (University of Washington)
Jerry F. Tjiputra (NORCE Norwegian Research Centre Bjerknes)
Jens Terhaar (Woods Hole Oceanographic Institution)
Jonathan D. Sharp (University of Washington)
Are Olsen (University of Bergen and Bjerknes Centre for Climate Research)
Simone Alin (NOAA/Pacific Marine Environmental Laboratory)
Dorothee C. E. Bakker (University of East Anglia)
Richard A. Feely (NOAA/Pacific Marine Environmental Laboratory)
Jean-Pierre Gattuso (Sorbonne Université)
Patrick Hogan (NOAA/National Centers for Environmental Information)
Tatiana Ilyina (Max Planck Institute for Meteorology)
Nico Lange (GEOMAR Helmholtz Centre for Ocean Research)
Siv K. Lauvset (NORCE Norwegian Research Centre)
Ernie R. Lewis (Brookhaven National Laboratory)
Tomas Lovato (Fondazione Centro Euro-Mediterraneo sui Cambiamenti Climatici)
Julien Palmieri (National Oceanography Centre)
Yeray Santana-Falcón (Université de Toulouse)
Jörg Schwinger (NORCE Norwegian Research Centre)
Roland Séférian (Université de Toulouse)
Gary Strand (US National Center for Atmospheric Research)
Neil Swart (Canadian Centre for Climate Modelling and Analysis)
Toste Tanhua (GEOMAR Helmholtz Centre for Ocean Research)
Hiroyuki Tsujino (JMA Meteorological Research Institute)
Rik Wanninkhof (NOAA/Atlantic Oceanographic Meteorological Laboratory)
Michio Watanabe (Japan Agency for Marine-Earth Science and Technology)
Akitomo Yamamoto (Japan Agency for Marine-Earth Science and Technology)
Tilo Ziehn (CSIRO Oceans and Atmosphere)

Twitter:
@JiangLiqing, @JensTerhaar, @jpGattuso, @j_d_sharp, @AreOlsen, @SimoneAlin, @Dorothee_Bakker, @RFeely, @ilitat, @sivlauvset, @yeraysf, @TosteTanhua,

Adaptive emission pathways to stabilize global temperatures

Posted by mmaheigan 
· Thursday, May 11th, 2023 

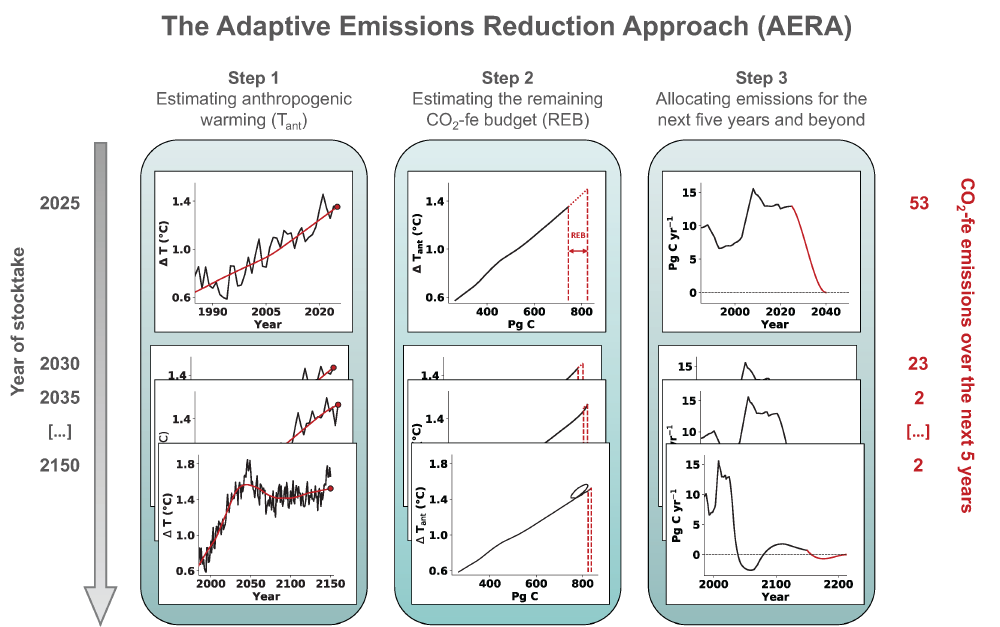
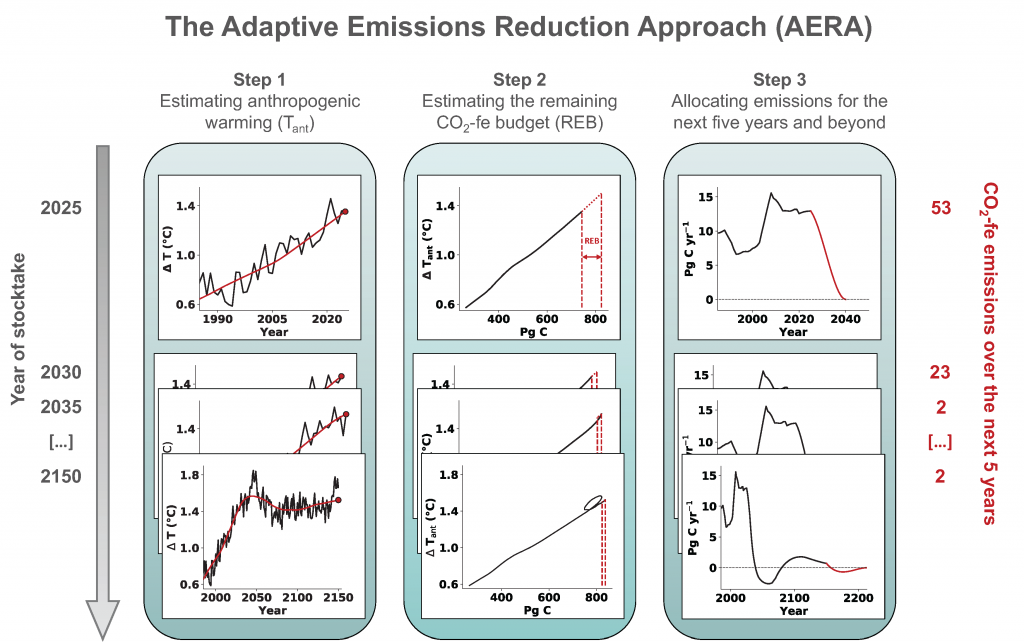
Around the world, countries have agreed in the Paris Agreement to limit global warming well below 2°C and to pursue efforts to reduce global warming to 1.5°C. However, large uncertainties remain about which emission pathways will allow us to reach this goal. A recent paper presents a new adaptive approach to create emission pathways and estimate the necessary emission reductions every five years, following the stocktake process of the Paris Agreement. This Adaptive Emissions Reduction Approach (AERA) is solely based on past warming rates, and emissions of CO2 and non-CO2 radiative agents, and explicitly does not rely on projections by Earth System Models. Updating the emission pathways every five years, circumvents uncertainties in the climate system and its transient response to cumulative emissions (TCRE). Testing with the Bern3D-LPX Earth System Model of Intermediate Complexity shows that the approach works robustly across a wide range of TCREs, avoids large overshoots, and only small changes to the emission pathways are necessary every five years. This approach will allow policymakers to estimate emission pathways and create a base for international negotiations. Furthermore, it allows simulations with Earth System Models that all converge to the same temperature target to compare the climate at stabilized warming levels.

Figure caption: The three steps of the Adaptive Emission Reduction Approach: 1) Estimating the past anthropogenic warming, 2) estimating the remaining emission budget, and 3) redistributing it over the future years.


Authors
Jens Terhaar (University of Bern, now Woods Hole Oceanographic Institution)
Thomas L Frölicher (University of Bern)
Mathias T Aschwanden (University of Bern)
Pierre Friedlingstein (University of Exeter, Ecole Normale Superieure)
Fortunat Joos (University of Bern)


Twitter @JensTerhaar @froeltho @PFriedling @unibern @snsf_ch @4C_H2020 @ExeterUniMaths @Geosciences_ENS @IPSL_outreach

The ephemeral and elusive COVID blip in ocean carbon

Posted by mmaheigan 
· Monday, September 20th, 2021 

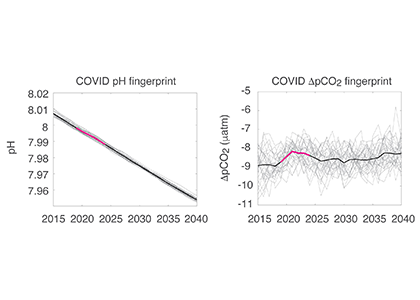
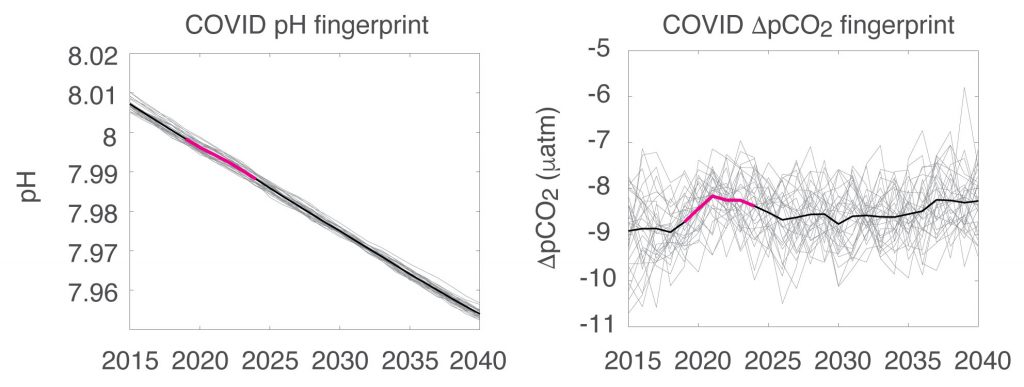
The global pandemic of the last nearly two years has affected all of us on a daily and long-term basis. Our planet is not exempt from these impacts. Can we see a signal of COVID-related CO2 emissions reductions in the ocean? In a recent study, Lovenduski et al. apply detection and attribution analysis to output from an ensemble of COVID-like simulations of an Earth system model to answer this question. While it is nearly impossible to detect a COVID-related change in ocean pH, the model produces a unique fingerprint in air-sea DpCO2 that is attributable to COVID. Challengingly, the large interannual variability in the climate system  makes this fingerprint  difficult to detect at open ocean buoy sites.

This study highlights the challenges associated with detecting statistically meaningful changes in ocean carbon and acidity following CO2 emissions reductions, and reminds the reader that it may be difficult to observe intentional emissions reductions — such as those that we may enact to meet the Paris Climate Agreement – in the ocean carbon system.

Figure caption: The fingerprint (pink line) of COVID-related CO2 emissions reductions in global-mean surface ocean pH and air-sea DpCO2, as estimated by an ensemble of COVID-like simulations in an Earth system model.   While the pH fingerprint is not particularly exciting, the air-sea DpCO2 fingerprint displays a temporary weakening of the ocean carbon sink in 2021 due to COVID emissions reductions.


Authors:
Nikki Lovenduski (University of Colorado Boulder)
Neil Swart (Canadian Centre for Climate Modeling and Analysis)
Adrienne Sutton (NOAA Pacific Marine Environmental Laboratory)
John Fyfe (Canadian Centre for Climate Modeling and Analysis)
Galen McKinley (Columbia University and Lamont Doherty Earth Observatory)
Chris Sabine (University of Hawai’i at Manoa)
Nancy Williams (University of South Florida)

A new Regional Earth System Model of the Mediterranean Sea biogeochemical dynamics

Posted by mmaheigan 
· Thursday, November 19th, 2020 

The Mediterranean Sea is a semi-enclosed mid-latitude oligotrophic basin with a lower net primary production than the global ocean. A west-east productivity trophic gradient results from the superposition of biogeochemical and physical processes, including the biological pump and associated carbon and nutrient (nitrogen, phosphorus) fluxes, the spatial asymmetric distribution of nutrient sources (rivers, atmospheric deposition, coastal upwelling, etc.), the estuarine inverse circulation associated with the inflow of Atlantic water through the Gibraltar Strait. The complex and highly variable interface between land and sea throughout this basin add a further layer of complexity in the Mediterranean oceanic and atmospheric circulation and on the associated biogeochemistry dynamics, emphasizing the need for high-resolution truly integrated Regional Earth System Models to track and understand fine-scale processes and ecosystem dynamics.

In a recent paper published in the Journal of Advances in Modeling Earth System, the authors introduced a new version of the Regional Earth System model RegCM-ES and evaluated its performance in the Mediterranean region. RegCM-ES fully integrates the regional climate model RegCM4, the land surface scheme CLM4.5 (Community Land Model), the river routing model HD (Hydrological Discharge Model), the ocean model MITgcm (MIT General Circulation model) and the Biogeochemical Flux Model BFM.

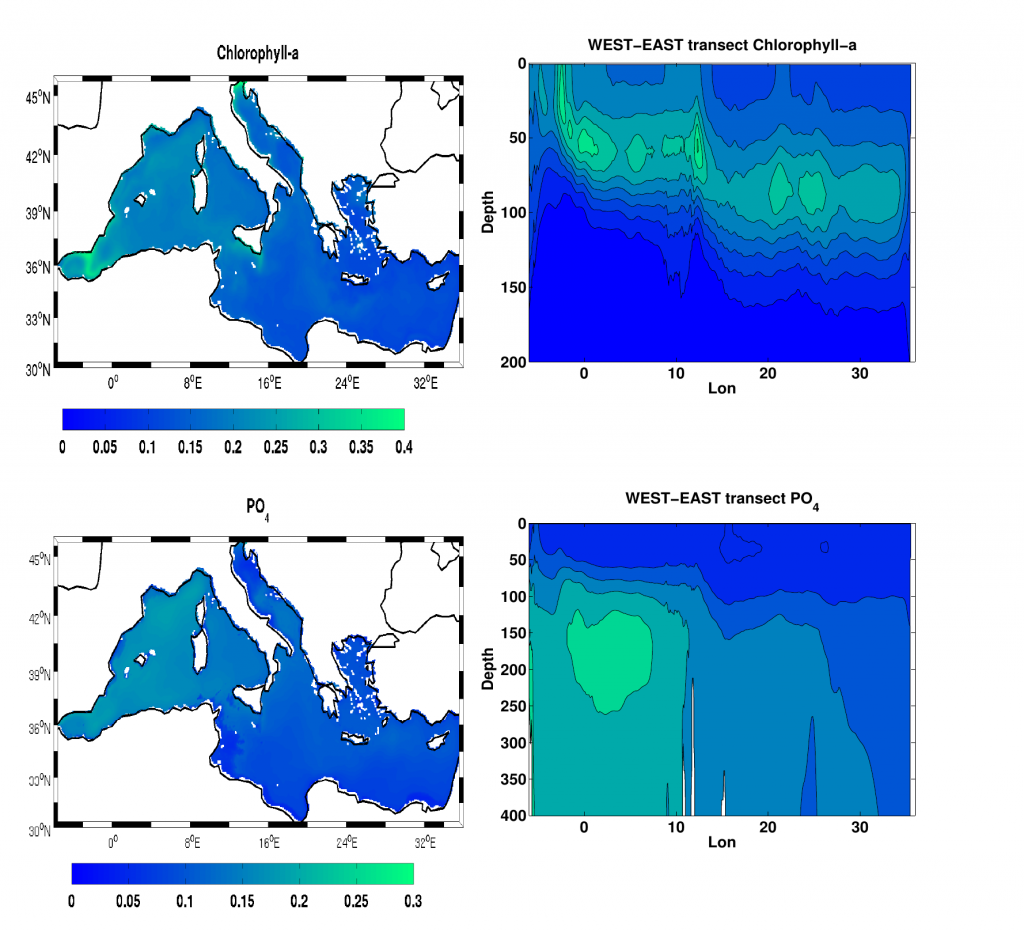
A comparison with available observations has shown that RegCM-ES was able to capture the mean climate of the region and to reproduce horizontal and vertical patterns of chlorophyll-a and PO4 (the limiting nutrient in the basin) (Figure 1). The same comparison revealed a systematic underestimation of simulated dissolved oxygen (which will be fixed by the use of a new parametrization of oxygen solubility), and an overestimation of NO3, possibly due to uncertainties in initial and boundary conditions (mostly traced to river and Dardanelles nutrient discharges) and an overly vigorous vertical mixing simulated by the ocean model in some parts of the Basin.

Figure.1 Distributions of chlorophyll-a mg/m3 (top) and PO4 mmol/m3 (bottom) in the Mediterranean Sea as simulated by RegCM-ES.

Overall, this analysis has demonstrated that RegCM-ES has the capabilities required to become a powerful tool for studying regional dynamics and impacts of climate change on the Mediterranean Sea and other ocean basins around the world.


Authors:
Marco Reale (Abdus Salam International Centre for theoretical physics-ICTP, National Institute of Oceanography and Experimental Geophysics-OGS)
Filippo Giorgi (Abdus Salam International Centre for theoretical physics-ICTP)
Cosimo Solidoro (National Institute of Oceanography and Experimental Geophysics-OGS)
Valeria Di Biagio (National Institute of Oceanography and Experimental Geophysics-OGS)
Fabio Di Sante (Abdus Salam International Centre for theoretical physics-ICTP)
Laura Mariotti (National Institute of Oceanography and Experimental Geophysics-OGS)
Riccardo Farneti (Abdus Salam International Centre for theoretical physics-ICTP)
Gianmaria Sannino (Italian National Agency for New Technologies, Energy and Sustainable Economic Development-ENEA)

Multiyear predictions of ocean acidification in the California Current System

Posted by mmaheigan 
· Thursday, August 20th, 2020 

The California Current System is a highly productive coastal upwelling region that supports commercial fisheries valued at $6 billion/year. These fisheries are supported by upwelled waters, which are rich in nutrients and serve as a natural fertilizer for phytoplankton. Due to remineralization of organic matter at depth, these upwelled waters also contain large amounts of dissolved inorganic carbon, causing local conditions to be more acidic than the open ocean. This natural acidity, compounded by the dissolution of anthropogenic CO2 into coastal waters, creates corrosive conditions for shell-forming organisms, including commercial fishery species.

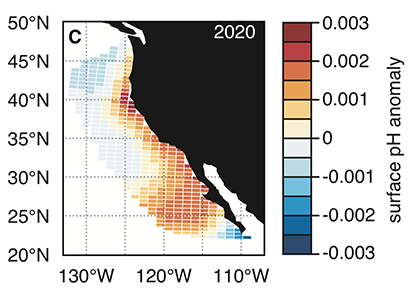
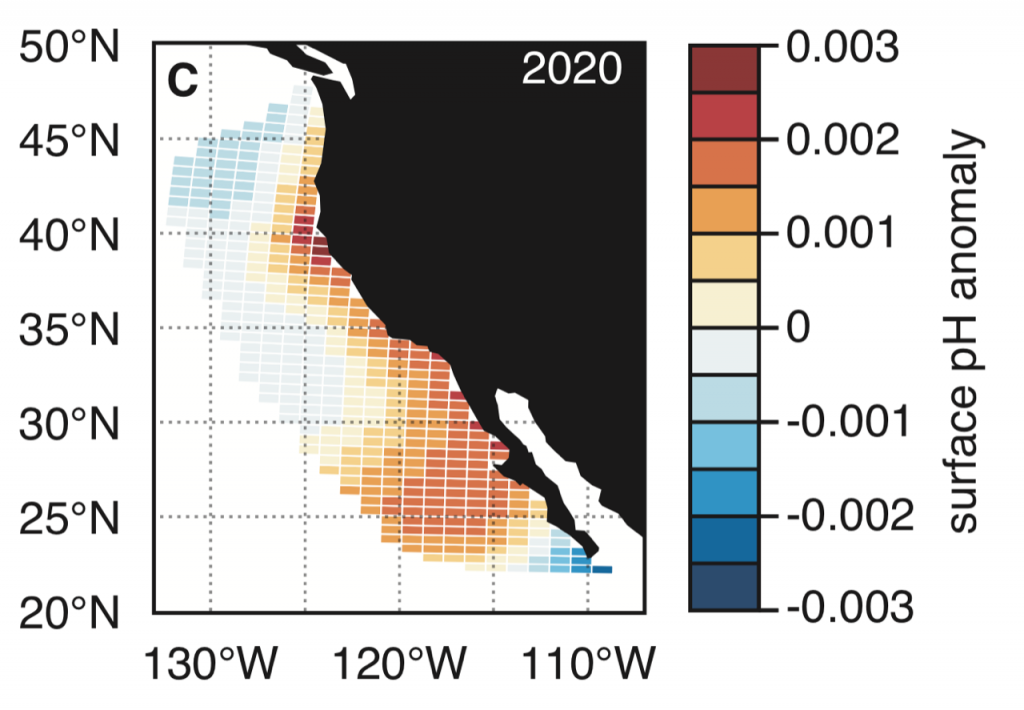
A recent study in Nature Communications showcases the potential for climate models to skillfully predict variations in surface pH—thus ocean acidification—in the California Current System. The authors evaluate retrospective predictions of ocean acidity made by a global Earth System Model set up similarly to a weather forecasting system. The forecasting system can already predict variations in observed surface pH fourteen months in advance, but has the potential to predict surface pH up to five years in advance with better initializations of dissolved inorganic carbon (Figure 1). Skillful predictions are mostly driven by the model’s initialization and subsequent transport of dissolved inorganic carbon throughout the North Pacific basin.

Figure 1. Forecast of annual surface pH anomalies in the California Current Large Marine Ecosystem for 2020. Red colors denote anomalously basic conditions for the given location and blue colors indicate anomalously acidic conditions.

These results demonstrate, for the first time, the feasibility of using climate models to make multiyear predictions of surface pH in the California Current. Output from this global prediction system could serve as boundary conditions for high-resolution models of the California Current to improve prediction time scale and ultimately help inform management decisions for vulnerable and valuable shellfisheries.


Authors:
Riley X. Brady (University of Colorado Boulder)
Nicole S. Lovenduski (University of Colorado Boulder)
Stephen G. Yeager (National Center for Atmospheric Research)
Matthew C. Long (National Center for Atmospheric Research)
Keith Lindsay (National Center for Atmospheric Research)

Predicting marine ecosystem futures

Posted by mmaheigan 
· Wednesday, September 4th, 2019 

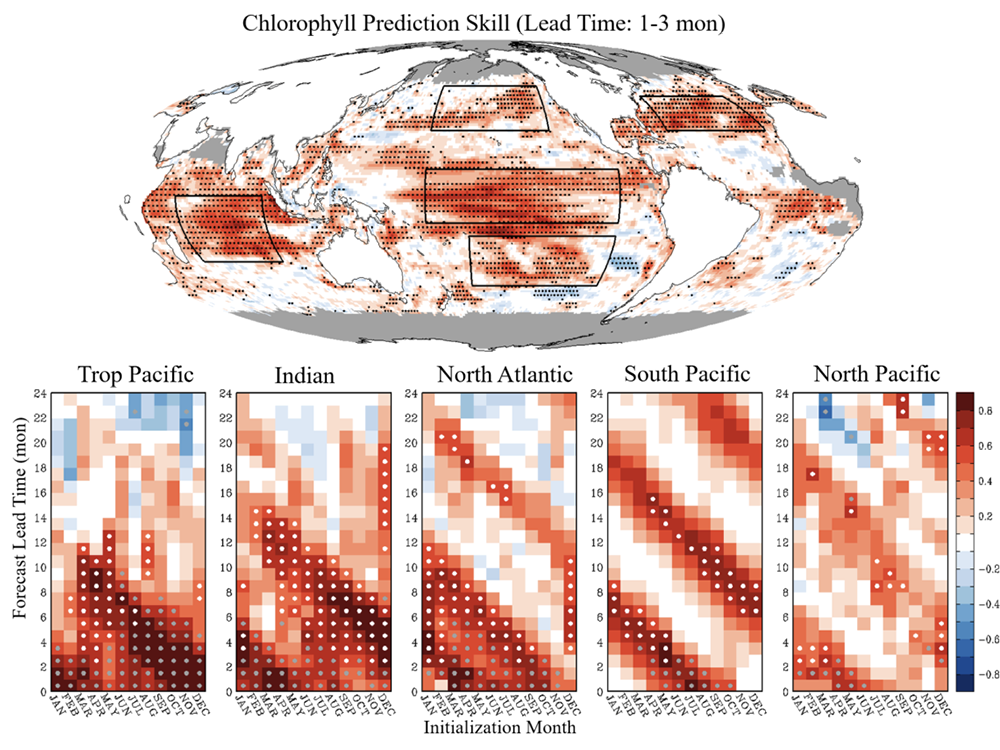
Earth System Models (ESMs) are powerful and effective tools for exploring and predicting marine ecosystem response to environmental change, including biogeochemical processes that underlie threats to ocean health such as ocean acidification, deoxygenation, and changes in productivity. Seasonal to interannual marine biogeochemical predictions with ESMs hold great promise for exploring links between climate and marine resources such as fisheries but have thus far been challenged by limitations associated with observational initialization, model structure, and computational availability. In a recent study published in Science, authors integrated the Geophysical Fluid Dynamics Laboratory’s (GFDL) COBALT (Carbon, Ocean Biogeochemistry and Lower Trophics) marine biogeochemical model with seasonal to multi-annual climate predictions from GFDL’s CM2.1 climate model to examine marine ecosystem futures on these shorter time scales. The global biogeochemical forecasts were initialized on the first of each month between 1991 and 2017 with 12 ensemble members in each prediction, creating a database of nearly 4000 forecasts and 8000 simulation years. The model skillfully predicted seasonal to multi-annual chlorophyll fluctuations in many ocean regions (Figure 1).


Figure 1: Prediction skill in reproducing observed variations of monthly chlorophyll anomaly. (Top) Correlation coefficient between predicted and observed chlorophyll at 1-3 month lead time during the period 1997-2017. Stippled areas indicate that the correlation is significantly greater than 0 with 95% confidence. Areas with less than 80% satellite chlorophyll coverage are masked in grey. (Lower panels) Correlation coefficient between predicted and observed chlorophyll as a function of forecast initialization month (x-axis) and lead time (y-axis) in tropical Pacific, Indian, North Atlantic, North Pacific, and South Pacific oceans. In all panels, the darker the red, the higher the correlation up to a perfect correlation of 1.0. White indicates no correlation, while blue indicates negative correlation.

These results suggest that annual fish catches in selected large marine ecosystems can be predicted from chlorophyll and sea surface temperature anomalies up to 2-3 years in advance. Given that fisheries predictions sometimes failed to the point of commercial stock collapse in the past, this prediction capacity could be vital for fisheries managers. Biogeochemical prediction systems can extend beyond sea surface temperature and chlorophyll to include other potential drivers (e.g., oxygen, acidity, net primary production, zooplankton, etc.) as highly valuable tools for marine resource managers of dynamic and changing ecosystems.

Authors:
Jong-Yeon Park (Princeton Univ, NOAA GDFL, Chonbuk National Univ., Korea)
Charles A. Stock, John P. Dunne, Xiaosong Yang, and Anthony Rosati (NOAA GFDL)

The causes of the 90-ppm glacial atmospheric CO2 drawdown still strongly debated

Posted by mmaheigan 
· Tuesday, July 9th, 2019 

Joint feature with GEOTRACES

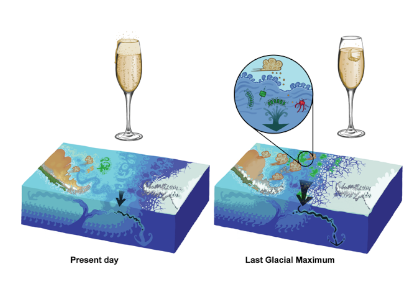
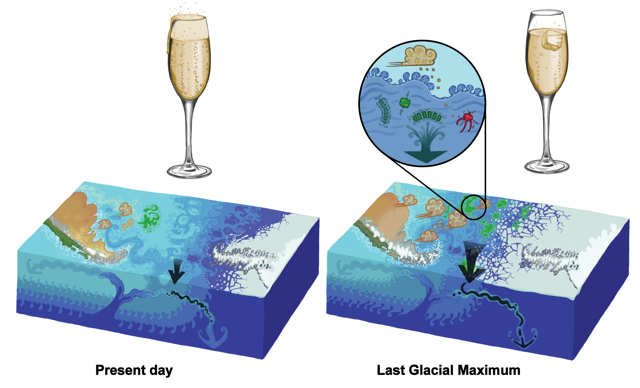
Figure: Illustration of the two main mechanisms identified by this study to explain lower atmospheric CO2 during glacial periods. Left: present-day conditions; right: conditions around 19,000 years ago during the Last Glacial Maximum. The obvious explanation for lower CO2 during glacial periods – cooler ocean temperatures (darker blue shade) making CO2 more soluble, much as a glass of sparkling wine will remain fizzier for longer when it is colder – has long been dismissed as not being a significant factor. However, previous calculations assumed that the ocean cooled uniformly and was saturated in dissolved CO2. The model, consistent with reconstructions of sea surface temperature, predicts more cooling at mid latitudes compared with polar regions and also accounts for undersaturation. This nearly doubles the effect of temperature change and accounts for almost half the 90 ppm glacial-interglacial atmospheric CO2 difference. Another quarter is explained in this model by increased growth of marine algae (green blobs and inset) in the waters off Antarctica. Algae absorb CO2 from the atmosphere during photosynthesis and “pump” it into the deep ocean when they die and sink. But their growth in the present-day ocean, especially the waters off Antarctica, is limited by the availability of iron, an essential micronutrient primarily supplied by wind-borne dust. In our model an increased supply of iron to the Southern Ocean, likely originating from Patagonia, Australia and New Zealand, enhances their growth and sucks CO2 out of the atmosphere. This “fertilization” effect was greatly underestimated by previous studies. The study also finds that, contrary to the current consensus, a large expansion of sea ice off Antarctica and reconfiguration of ocean circulation may have played only a minor role in glacial-interglacial CO2 changes. Credit: Illustration by Andrew Orkney, University of Oxford.

Using an observationally constrained earth system model, S. Khatiwala and co-workers compare different processes that could lead to the 90-ppm glacial atmospheric CO2 drawdown, with an important improvement on the deep carbon storage quantification (i.e. Biological Carbon Pump efficiency). They demonstrate that circulation and sea ice changes had only a modest net effect on glacial ocean carbon storage and atmospheric CO2, whereas temperature and iron input effects were more important than previously thought due to their effects on disequilibrium carbon storage.

Authors:
Samar Khatiwala (University of Oxford, UK)
Andreas Schmittner and Juan Muglia (Oregon State University)

Forecasting air-sea CO2 flux variations several years in advance

Posted by mmaheigan 
· Tuesday, July 9th, 2019 

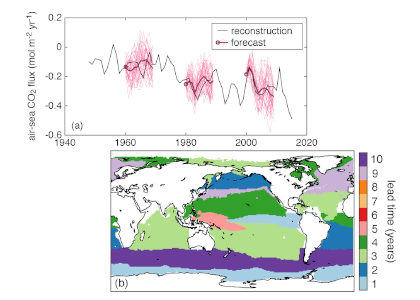
Year-to-year changes in the flux of CO2 between the atmosphere and the ocean impact the global carbon cycle and climate system, and challenge our ability to verify fossil fuel CO2 emissions. A new study published in Earth System Dynamics suggests that these air-sea CO2 flux variations are predictable several years in advance.

A novel set of initialized forecasts of past air-sea CO2 flux from an Earth system model (Figure 1a) confidently predicts year-to-year variations in the globally-integrated flux up to two years in advance. At regional scales, the forecast lead time increases. The predictability of CO2 flux from the initialized forecast system exceeds that obtained solely from foreknowledge of variations in external forcing (e.g., volcanic eruptions) or a simple persistence forecast (e.g., CO2 flux this year will be the same as next year). The longest-lasting forecast enhancements are in the subantarctic Southern Ocean and the northern North Atlantic (Figure 1b).

Figure 1: (a) Forecasts of the past evolution of air-sea CO2 flux in the South Pacific using an Earth System model indicate the potential to predict the future evolution of this quantity. (b) In each biome, the maximum forecast lead time in which the initialized forecast of air-sea CO2 flux beats out other forecast methods.

These results are particularly meaningful for those forecasting year-to-year changes in the global carbon budget, especially as these forecasting efforts are blind to the externally-forced variability in advance (i.e., the external forcing of the future is unknown).  In this way, forecasts of air-sea CO2 flux variations can help to inform future predictions of land-air CO2 flux and atmospheric CO2 concentration.

Authors:
Nicole Lovenduski (University of Colorado Boulder)
Stephen G. Yeager (National Center for Atmospheric Research)
Keith Lindsay (National Center for Atmospheric Research)
Matthew C. Long (National Center for Atmospheric Research)

See also the OCB Ocean-Atmosphere Interactions: Scoping directions for U.S. research Workshop to be held in October 1-3, 2019

Suddenly shallow: A new aragonite saturation horizon will soon emerge in the Southern Ocean

Posted by mmaheigan 
· Monday, May 27th, 2019 

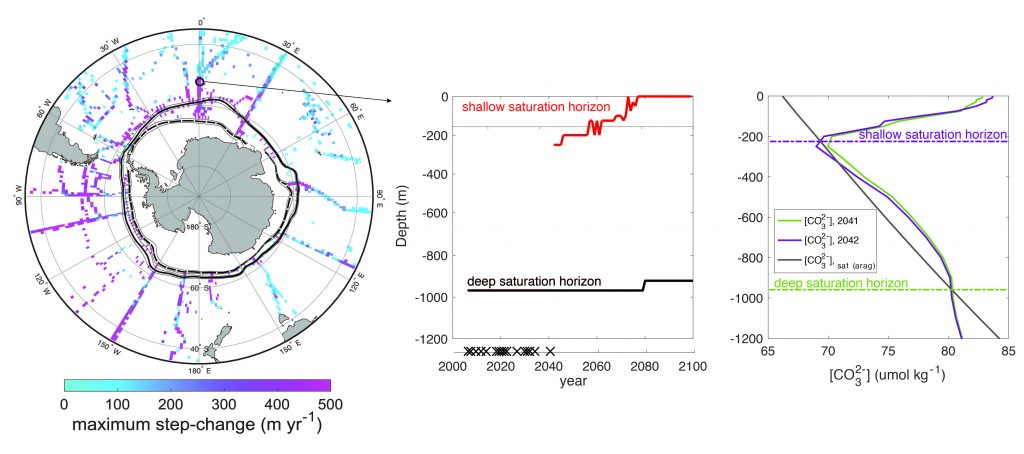
Earth System Models (ESMs) project that by the end of this century, the aragonite saturation horizon (the boundary between shallower, saturated waters and deeper, undersaturated waters that are corrosive to aragonitic shells) will shoal all the way to the surface in the Southern Ocean, yet the temporal evolution of the horizon has not been studied in much detail. Rather than a gradual shoaling, a new shallow aragonite saturation horizon emerges suddenly across many locations in the Southern Ocean between now and the end of the century (Figure 1, left), as detailed in a new study published in Nature Climate Change.

Figure 1: Maximum step-change in the depth of the aragonite saturation horizon (left), timing of the step-change (center), and cause of the change (right). Xs on the time axis (center) indicate when the shallow horizon emerges in each ensemble member. (click image to enlarge)


The emergence of the shallow aragonite saturation horizon is apparent in each member of an ensemble of climate projections from an ESM, but the step change occurs during different years (Figure 1, center). The shoaling is driven by the gradual accumulation of anthropogenic CO2 in the Southern Ocean thermocline, where the carbonate ion concentration exhibits a local minimum and approaches undersaturation (Figure 1, right).

The abrupt shoaling of the Southern Ocean aragonite saturation horizon occurs under both business-as-usual and emission-stabilizing scenarios, indicating an inevitable and sudden decrease in the volume of suitable habitat for aragonitic organisms such as shelled pteropods, foraminifers, cold-water corals, sea urchins, molluscs, and coralline algae. Widespread reductions in these habitats may have far-reaching consequences for fisheries, economies, and livelihoods.

Authors:
Gabriela Negrete-García (Scripps Institution of Oceanography)
Nicole Lovenduski (University of Colorado Boulder)


See also OCB2019 plenary session: Carbon cycle feedbacks from the seafloor (Wednesday, June 26, 2019)

Next Page »

Filter by Keyword

abundance acidification additionality advection africa air-sea air-sea interactions algae alkalinity allometry ammonium AMO AMOC anoxic Antarctic Antarctica anthro impacts anthropogenic carbon anthropogenic impacts appendicularia aquaculture aquatic continuum aragonite saturation arctic Argo argon arsenic artificial seawater Atlantic atmospheric CO2 atmospheric nitrogen deposition authigenic carbonates autonomous platforms bacteria bathypelagic BATS BCG Argo benthic bgc argo bio-go-ship bio-optical bioavailability biogeochemical cycles biogeochemical models biogeochemistry Biological Essential Ocean Variables biological pump biophysics bloom blue carbon bottom water boundary layer buffer capacity C14 CaCO3 calcification calcite carbon carbon-climate feedback carbon-sulfur coupling carbonate carbonate system carbon budget carbon cycle carbon dioxide carbon export carbon fluxes carbon sequestration carbon storage Caribbean CCA CCS changing marine chemistry changing marine ecosystems changing marine environments changing ocean chemistry chemical oceanographic data chemical speciation chemoautotroph chesapeake bay chl a chlorophyll circulation CO2 coastal and estuarine coastal darkening coastal ocean cobalt Coccolithophores commercial community composition competition conservation cooling effect copepod copepods coral reefs CTD currents cyclone daily cycles data data access data assimilation database data management data product Data standards DCM dead zone decadal trends decomposers decomposition deep convection deep ocean deep sea coral denitrification deoxygenation depth diatoms DIC diel migration diffusion dimethylsulfide dinoflagellate dinoflagellates discrete measurements distribution DOC DOM domoic acid DOP dust DVM ecology economics ecosystem management ecosystems eddy Education EEZ Ekman transport emissions ENSO enzyme equatorial current equatorial regions ESM estuarine and coastal carbon fluxes estuary euphotic zone eutrophication evolution export export fluxes export production extreme events faecal pellets fecal pellets filter feeders filtration rates fire fish Fish carbon fisheries fishing floats fluid dynamics fluorescence food webs forage fish forams freshening freshwater frontal zone functional role future oceans gelatinous zooplankton geochemistry geoengineering geologic time GEOTRACES glaciers gliders global carbon budget global ocean global warming go-ship grazing greenhouse gas greenhouse gases Greenland ground truthing groundwater Gulf of Maine Gulf of Mexico Gulf Stream gyre harmful algal bloom high latitude human food human impact human well-being hurricane hydrogen hydrothermal hypoxia ice age ice cores ice cover industrial onset inland waters in situ inverse circulation ions iron iron fertilization iron limitation isotopes jellies katabatic winds kelvin waves krill kuroshio lab vs field land-ocean continuum larvaceans lateral transport LGM lidar ligands light light attenuation lipids low nutrient machine learning mangroves marine carbon cycle marine heatwave marine particles marine snowfall marshes mCDR mechanisms Mediterranean meltwater mesopelagic mesoscale mesoscale processes metagenome metals methane methods microbes microlayer microorganisms microplankton microscale microzooplankton midwater mitigation mixed layer mixed layers mixing mixotrophs mixotrophy model modeling model validation mode water molecular diffusion MPT MRV multi-decade n2o NAAMES NCP nearshore net community production net primary productivity new ocean state new technology Niskin bottle nitrate nitrogen nitrogen cycle nitrogen fixation nitrous oxide north atlantic north pacific North Sea nuclear war nutricline nutrient budget nutrient cycles nutrient cycling nutrient limitation nutrients OA observations ocean-atmosphere ocean acidification ocean acidification data ocean alkalinity enhancement ocean carbon storage and uptake ocean carbon uptake and storage ocean color ocean modeling ocean observatories ocean warming ODZ oligotrophic omics OMZ open ocean optics organic particles oscillation outwelling overturning circulation oxygen pacific paleoceanography PAR parameter optimization parasite particle flux particles partnerships pCO2 PDO peat pelagic PETM pH phenology phosphate phosphorus photosynthesis physical processes physiology phytoplankton PIC piezophilic piezotolerant plankton POC polar polar regions policy pollutants precipitation predation predator-prey prediction pressure primary productivity Prochlorococcus productivity prokaryotes proteins pteropods pycnocline radioisotopes remineralization remote sensing repeat hydrography residence time resource management respiration resuspension rivers rocky shore Rossby waves Ross Sea ROV salinity salt marsh satellite scale seafloor seagrass sea ice sea level rise seasonal seasonality seasonal patterns seasonal trends sea spray seawater collection seaweed secchi sediments sensors sequestration shelf ocean shelf system shells ship-based observations shorelines siderophore silica silicate silicon cycle sinking sinking particles size SOCCOM soil carbon southern ocean south pacific spatial covariations speciation SST state estimation stoichiometry subduction submesoscale subpolar subtropical sulfate surf surface surface ocean Synechococcus technology teleconnections temperate temperature temporal covariations thermocline thermodynamics thermohaline thorium tidal time-series time of emergence titration top predators total alkalinity trace elements trace metals trait-based transfer efficiency transient features trawling Tris trophic transfer tropical turbulence twilight zone upper ocean upper water column upwelling US CLIVAR validation velocity gradient ventilation vertical flux vertical migration vertical transport warming water clarity water mass water quality waves weathering western boundary currents wetlands winter mixing zooplankton

Copyright © 2025 - OCB Project Office, Woods Hole Oceanographic Institution, 266 Woods Hole Rd, MS #25, Woods Hole, MA 02543 USA Phone: 508-289-2838  •  Fax: 508-457-2193  •  Email: ocb_news@us-ocb.org

link to nsflink to noaalink to WHOI

Funding for the Ocean Carbon & Biogeochemistry Project Office is provided by the National Science Foundation (NSF) and the National Aeronautics and Space Administration (NASA). The OCB Project Office is housed at the Woods Hole Oceanographic Institution.