
The Lofoten Basin Eddy (LBE) is a unique and persistent anticyclonic feature of the Norwegian Sea that stirs the water column year-round. However, its impact on biogeochemical processes that influence region carbon storage, including carbon fixation, particle aggregation and fragmentation, and remineralization, has remained largely unknown.
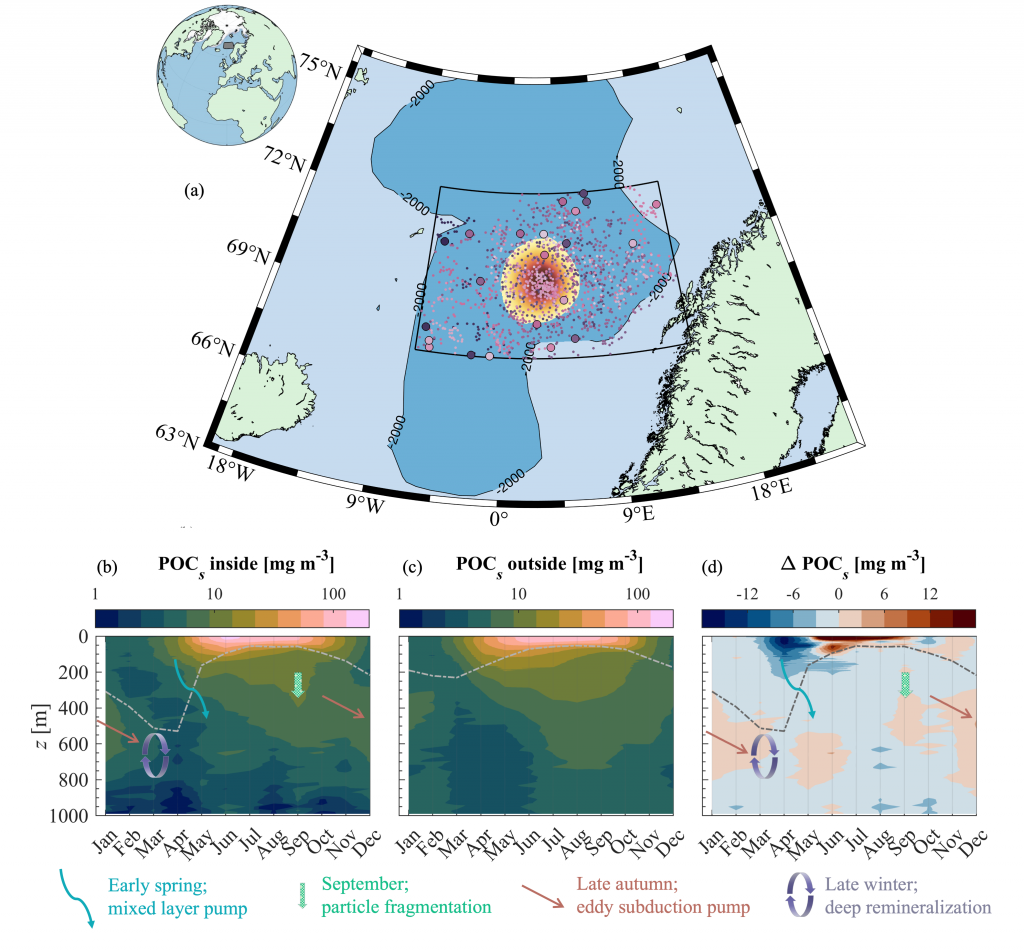
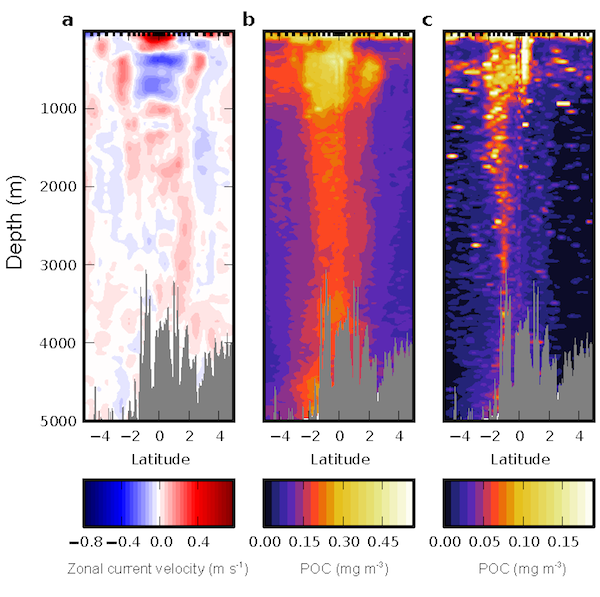
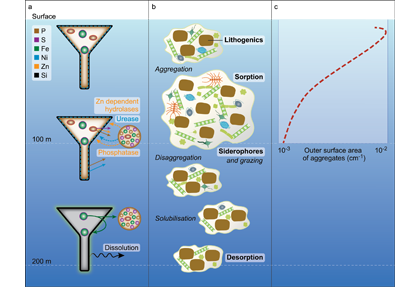
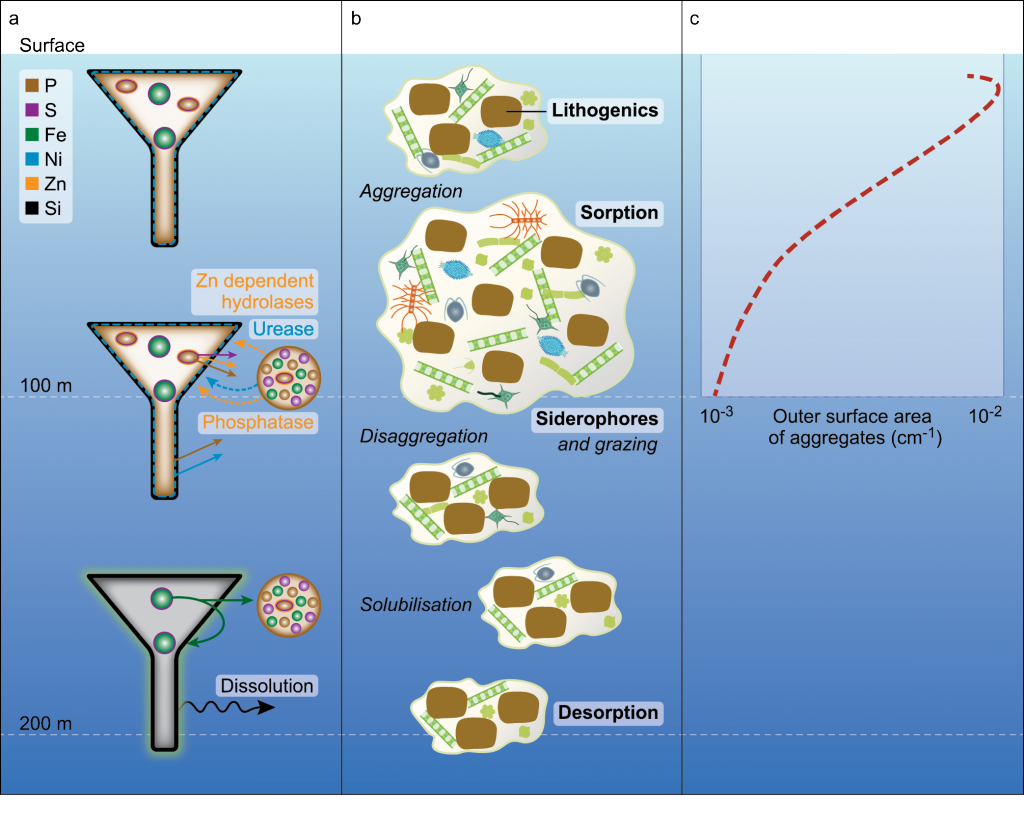
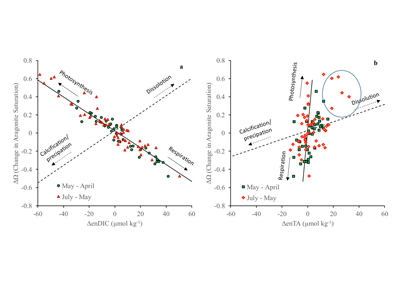
Figure caption: (a) Map of the Lofoten Basin Eddy study region including locations of 1886 profiles from 22 Biogeochemical-Argo floats (2010–2022) and a heatmap showing the relative extent of the LBE influence zone over the timeseries. (b–d) Mean monthly profiles and the difference (Δ) determined as inside minus outside the LBE influence zone of the mass concentration of particulate organic carbon in small particles (POCs). Arrows indicate key mechanisms regulating the regional biological carbon.
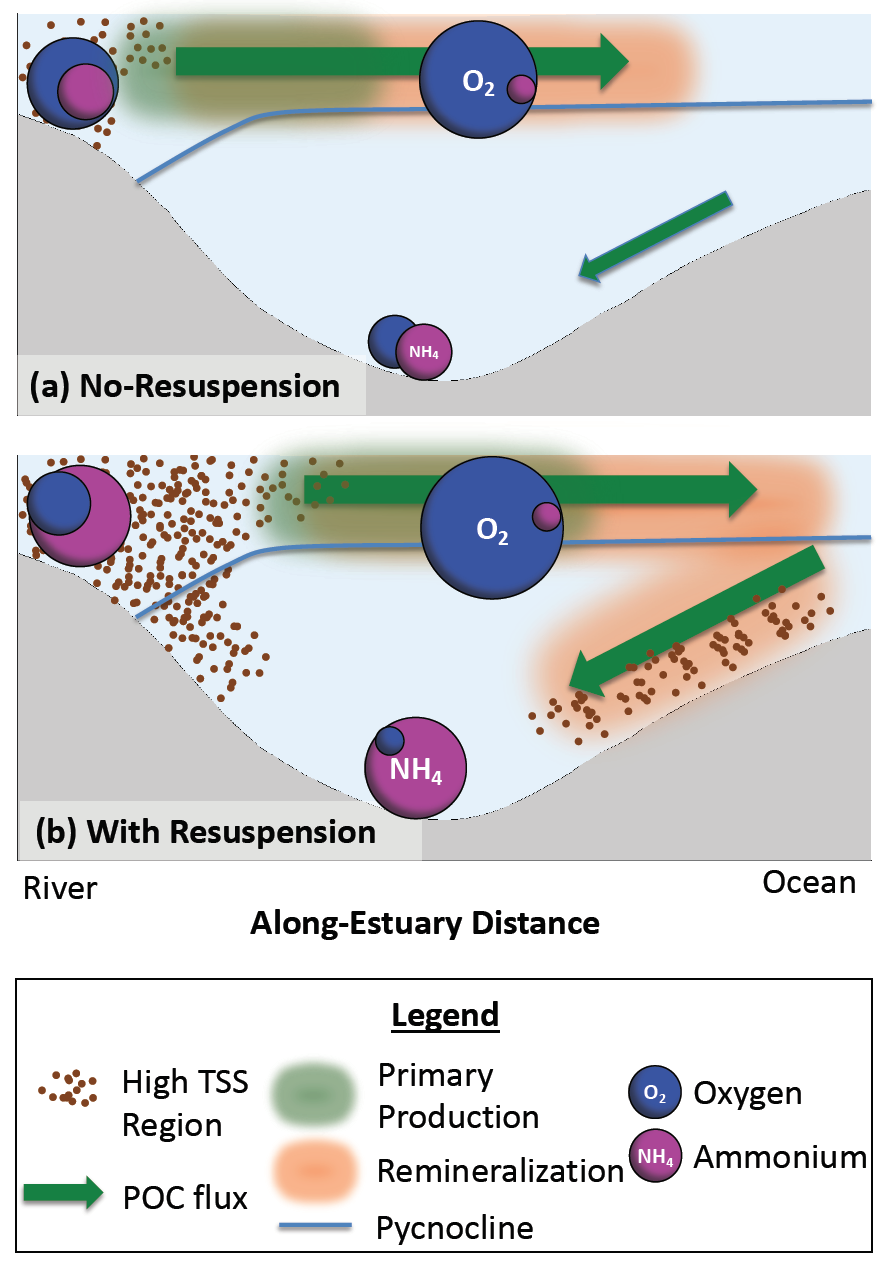
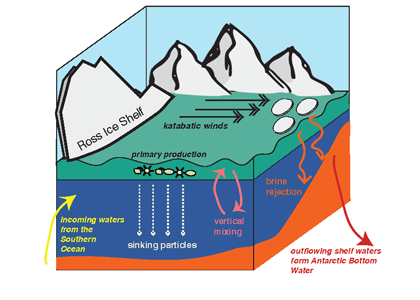
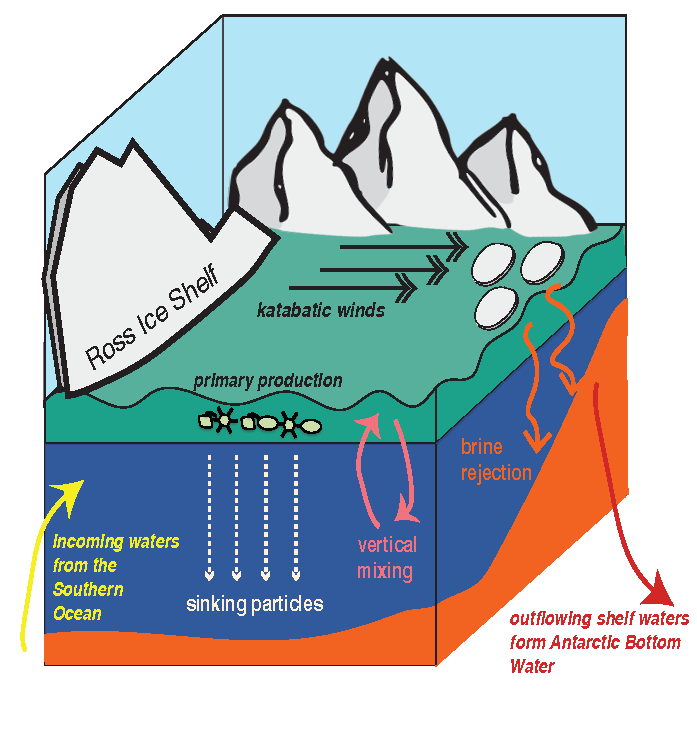
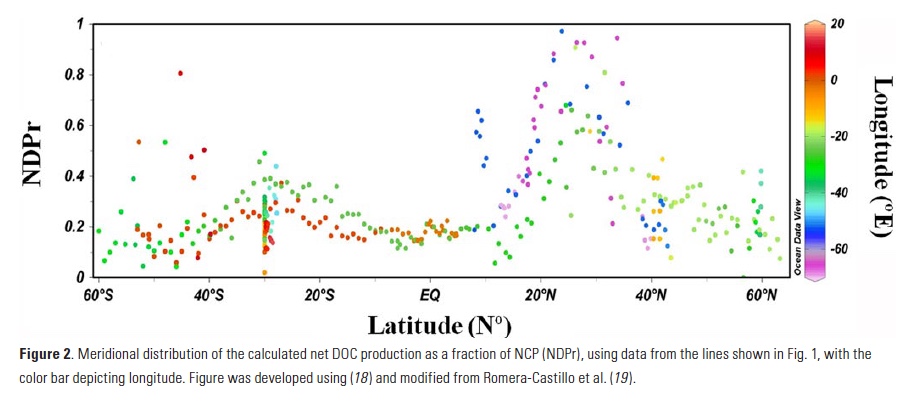
Using 12 years of data from Biogeochemical-Argo floats and satellite altimetry to track eddy movements, Koestner et al. (2025) examined how the LBE influences the seasonal transport of organic carbon from surface waters to the deep ocean. While the LBE can enhance carbon export during certain months, like during spring shoaling and late autumn subduction, it generally reduces the efficiency of the biological carbon pump. Inside the eddy, warmer subsurface waters and slower-sinking particles often lead to more respiration and remineralization, meaning less carbon reached the deep sea.
The LBE’s persistent influence on organic carbon cycling could affect regional climate feedbacks and marine ecosystems, including key fisheries in Norway. Understanding how features like the LBE modulate carbon sequestration is vital for improving climate models and managing ocean resources in a warming Arctic.
Authors
Daniel Koestner (University of Bergen)
Sophie Clayton (National Oceanography Centre)
Paul Lerner (Columbia University)
Alexandra E. Jones-Kellett (MIT & WHOI)
Stevie L. Walker (University of Washington)

