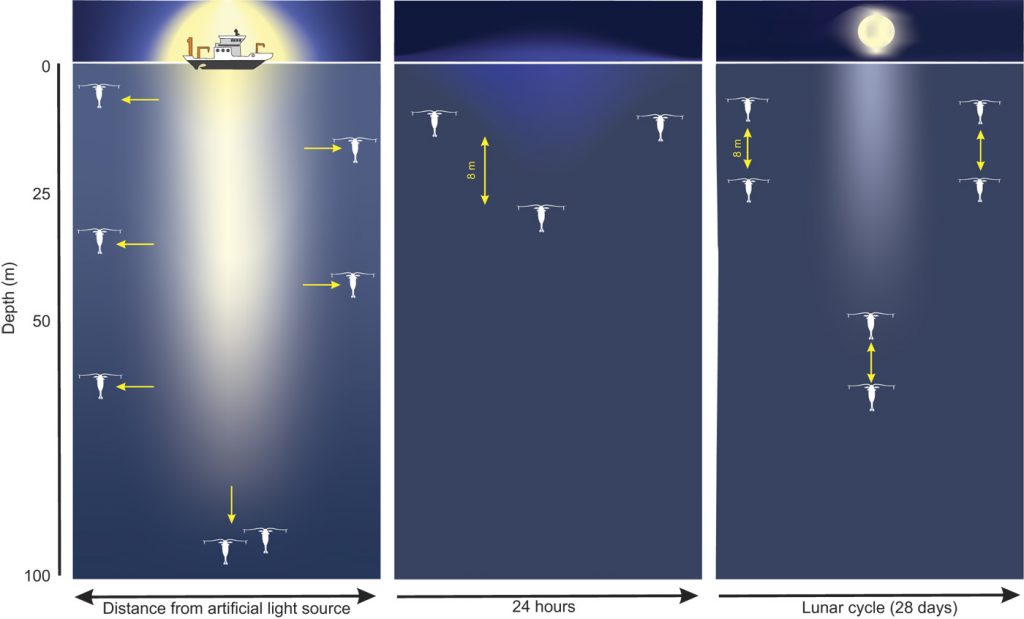
The Southern Ocean is a major player in driving global distributions of heat, carbon dioxide, and nutrients, making it key to ocean chemistry and the earth’s climate system. In the ocean, biological production and export of organic carbon are commonly linked to places with high nutrient availability. A recent paper, published in Global Biogeochemical Cycles, highlighting new observations from robotic profiling floats demonstrates that areas of high carbon export in the Southern Ocean are actually associated with very low concentrations of iron, an important micronutrient for supporting phytoplankton growth. This suggests a decoupling between the production and export of organic carbon in this region.
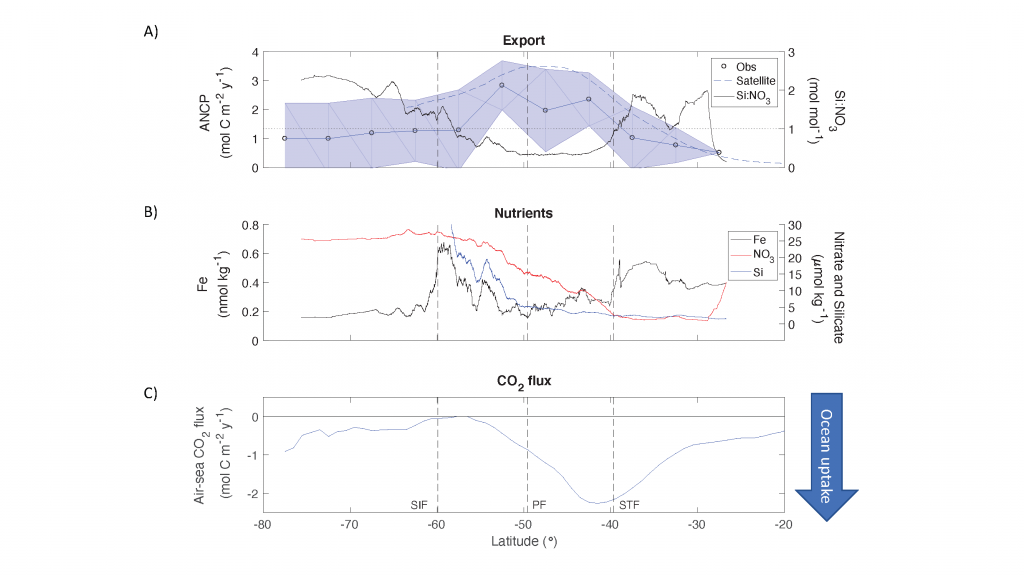
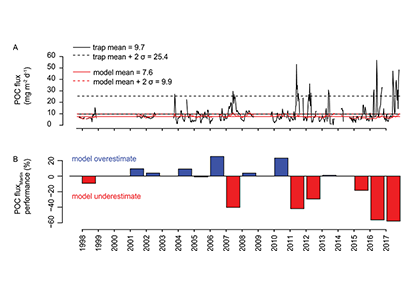
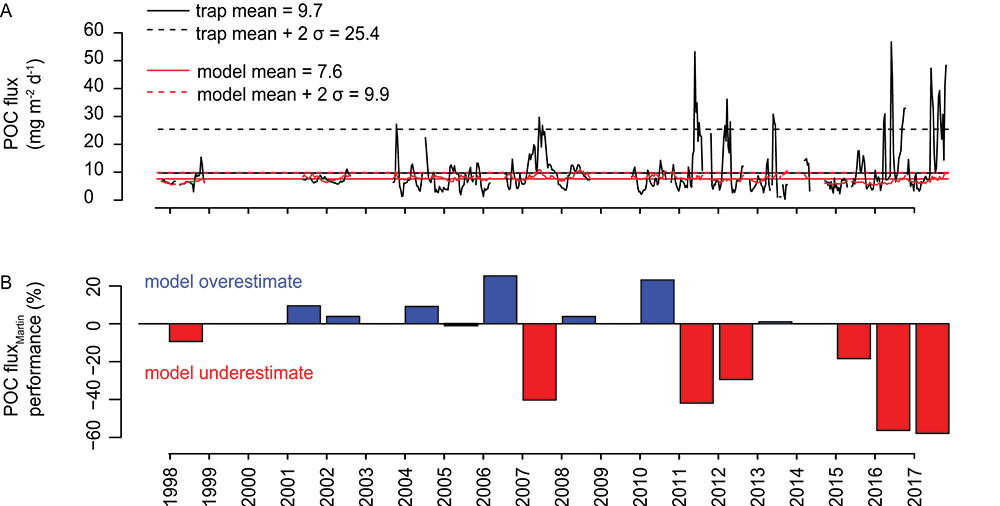
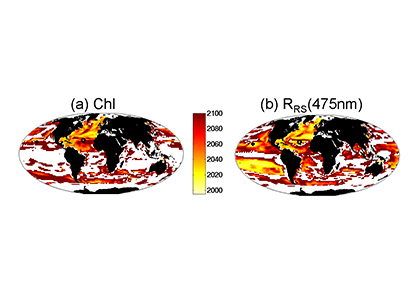
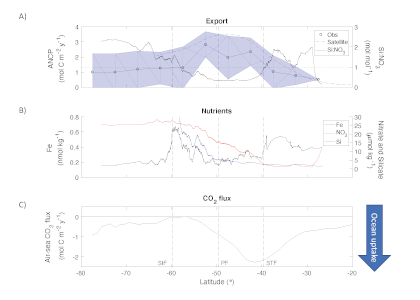
Figure caption: (A) Meridional pattern of Annual Net Community Production (ANCP) (equivalent to carbon export) (± standard deviation) in the Southern Ocean (blue line with circles and shaded area), carbon export estimates from previous satellite-based analyses (blue dashed line), and silicate to nitrate (Si:NO3) ratio of the surface water (black continuous line). Grey dotted line shows a Si:NO3 = 1 mol mol−1, characteristic of nutrient-replete diatoms. (B) Meridional pattern of Southern Ocean nutrient concentrations, including dissolved iron (Fe) concentration (black line), nitrate (red line), and silicate (blue line). (C) Mean 2014–2015 annual zonally averaged air-sea flux of CO2 computed using neural network interpolation method. STF = Subtropical Front, PF = Antarctic Polar Front, SIF = Seasonal Ice Front.
Using observations of nutrient and oxygen drawdown from a regional network of profiling Biogeochemical-Argo floats deployed as part of the Southern Ocean Carbon and Climate Observations and Modeling project (SOCCOM), the authors calculated estimates of Southern Ocean carbon export. A meridional pattern in biological carbon export emerged, showing peak export near the Antarctic Polar Front (PF) associated with minima in surface iron concentrations and dissolved silicate to nitrate ratios. Previous studies have shown that under iron-limiting conditions, diatoms increase their uptake ratio of silicate with respect to other nutrients (e.g., nitrogen), resulting in silicification. Here, the authors hypothesize that iron limitation promotes silicification in Southern Ocean diatoms, as evidenced by the low silicate to nitrate ratio of surface waters around the Antarctic Polar Front. High diatom silicification increases ballasting of particulate organic carbon and hence overall carbon export in this region. The resulting meridional pattern of organic carbon export is similar to that of the air-sea flux of carbon dioxide in the Southern Ocean, underscoring the importance of the biological carbon pump in controlling the spatial pattern of oceanic carbon uptake in this region.
Authors:
Lionel A. Arteaga (Princeton University)
Markus Pahlow (Helmholtz Centre for Ocean Research Kiel, GEOMAR)
Seth M. Bushinsky (University of Hawaii)
Jorge L. Sarmiento (Princeton University)