Ocean Carbon & Biogeochemistry
Studying marine ecosystems and biogeochemical cycles in the face of environmental change
  • Home
  • About OCB
    • About Us
    • Scientific Breadth
      • Biological Pump
      • Changing Marine Ecosystems
      • Changing Ocean Chemistry
      • Estuarine and Coastal Carbon Fluxes
      • Ocean Carbon Uptake and Storage
      • Ocean Observatories
    • Code of Conduct
    • Get Involved
    • Project Office
    • Scientific Steering Committee
    • OCB committees
      • OCSIF – Ocean Carbonate System Intercomparison
      • Ocean-Atmosphere Interaction
      • Ocean Time-series
      • US Biogeochemical-Argo
  • Activities
    • 20 years of OCB Symposium – 18 November 2026
    • OCB Webinars
    • Summer Workshop
    • Guidelines for OCB Workshops & Activities
    • Topical Workshops
      • 7th DMS(P) Symposium
      • Marine Virus Workshop
      • Completed
        • CMIP6 Models Workshop
        • Coastal BGS Obs with Fisheries
        • C-saw extreme events workshop
        • Expansion of BGC-Argo and Profiling Floats
        • Fish, fisheries and carbon
        • Future BioGeoSCAPES program
        • GO-BCG Scoping Workshop
        • Lateral Carbon Flux in Tidal Wetlands
        • Leaky Deltas Workshop
        • Marine CDR Workshop
        • Ocean Nucleic Acids ‘Omics
        • Pathways Connecting Climate Changes to the Deep Ocean
    • Small Group Activities
      • BECS Benthic Ecosystem and Carbon Synthesis WG
      • Metabarcoding intercal WG
      • Meta-eukomics WG
      • Metaproteomic Intercomparison
      • SedMIP
      • Recently completed
        • Aquatic Continuum OCB-NACP Focus Group
        • Arctic-COLORS Data Synthesis
        • Carbon Isotopes in the Ocean Workshop
        • CMIP6 WG
        • Filling the gaps air–sea carbon fluxes WG
        • Fish Carbon WG
        • mCDR
        • Mixotrophs & Mixotrophy WG
        • N-Fixation WG
        • Ocean Carbonate System Intercomparison Forum
        • Ocean Carbon Uptake WG
        • OOI BGC sensor WG
        • Operational Phytoplankton Observations WG
        • Phytoplankton Taxonomy WG
    • Other Workshops
    • Science Planning
      • Coastal CARbon Synthesis (CCARS)
      • North Atlantic-Arctic
    • Ocean Acidification PI Meetings
    • Training Activities
      • PACE Hackweek 2025
      • PACE Hackweek 2024
      • PACE Training Activity 2022
  • Science Support
    • OCB Activity Proposal Solicitation
    • Guidelines for OCB Workshops & Activities
    • Data management and archival
    • Early Career
    • Funding Sources
    • Jobs & Postdocs
    • Meeting List
    • OCB Topical Websites
      • Ocean Fertilization
      • Trace gases
      • US IIOE-2
    • Outreach & Education
    • Promoting your science
    • Student Opportunities
    • Travel Support
  • Publications
    • OCB Workshop Reports
    • Science Planning and Policy
    • Newsletter Archive
  • Science Highlights
  • News

Archive for ocean carbon uptake and storage – Page 7

Regional circulation changes and a growing atmospheric CO2 concentration drive accelerated anthropogenic carbon uptake in the South Pacific

Posted by mmaheigan 
· Tuesday, August 6th, 2019 

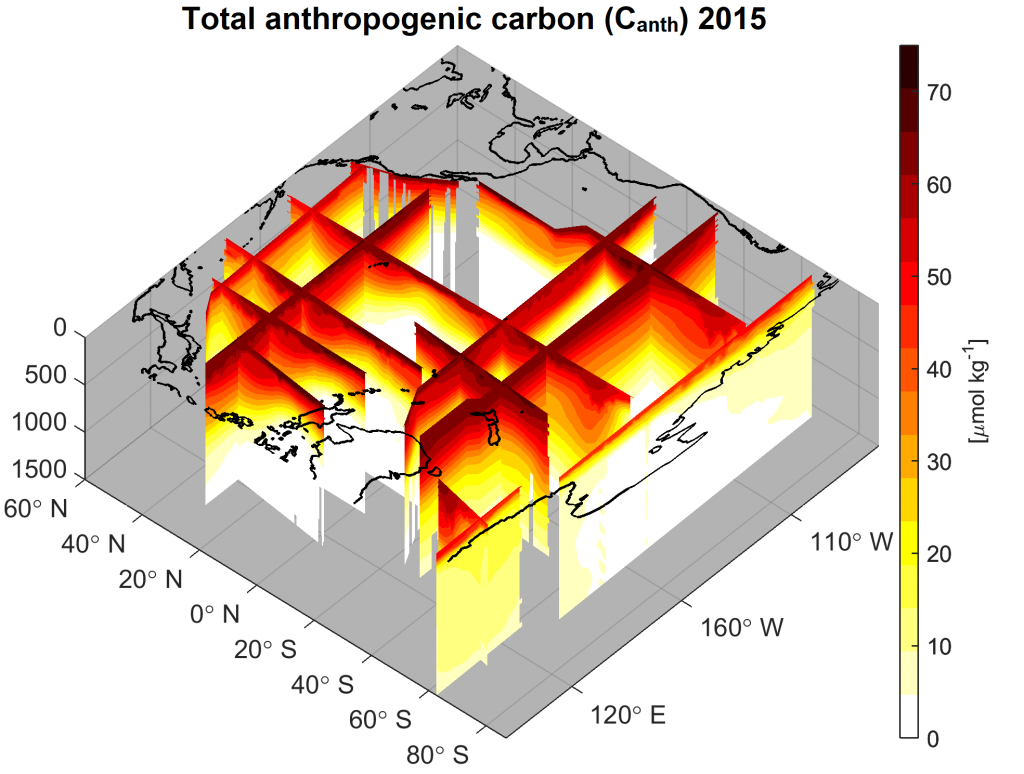
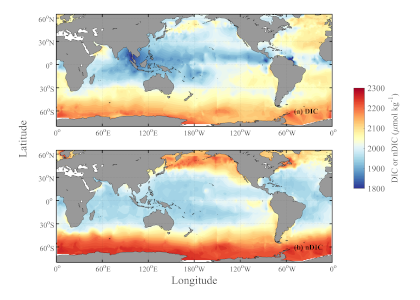
About one tenth of human CO2 emissions are currently being taken up by the Pacific Ocean, which makes the seawater more corrosive to the calcium carbonate shells and skeletons of the plants and animals that live there. Now, thanks to hard work by international teams of scientists from the Global Ocean Ship-based Hydrographic Investigations Program (GO-SHIP), there are decades of data, enough to test how much this anthropogenic CO2 accumulation varies throughout the Pacific Ocean and regionally on the timescales of decades.


Figure caption: Map of the concentration of human-emitted CO2 along the sections where data were available from more than one decade, estimated for the year 2015.

Using a new take on an old technique, along with a wide variety of repeat biogeochemical measurements, a study in Biogeochemical Cycles revealed that Pacific anthropogenic CO2 accumulation increased from the 1995-2005 decade to the 2005-2015 decade. While the magnitude of the decadal increase was consistent with increases in human CO2 emissions over this period for most of the Pacific, the rate of change was greater than expected in the South Pacific subtropical gyre. The authors suggest that recent increases in circulation in the gyre region could have delivered an unexpectedly large amount of anthropogenic CO2-laden seawater from the surface to the ocean interior. Programs like GO-SHIP will continue to be critical for tracking the fate of human CO2 emissions and associated feedbacks on climate and marine ecosystems.


Authors:
B. R. Carter (Univ. Washington and PMEL)
R. A. Feely, G. C. Johnson, J. L. Bullister (PMEL)
R. Wanninkhof (NOAA AOML)
S. Kouketsu, A. Murata (JAMSTEC
R. E. Sonnerup, S. Mecking (Univ. Washington)
P. C. Pardo (Univ. Tasmania)
C. L. Sabine (Univ. Hawai‘i, Mānoa)
B. M. Sloyan, B. Tilbrook (CSIRO, Australia)
K. Speer (Florida State University
L. D. Talley (Scripps Institution of Oceanography)
F. J. Millero (Univ. Miami)
S. E. Wijffels (CSIRO and WHOI)
A. M. Macdonald (WHOI)
N. Gruber (ETH Zurich)

A new era of observing the ocean carbonate system

Posted by mmaheigan 
· Tuesday, August 6th, 2019 

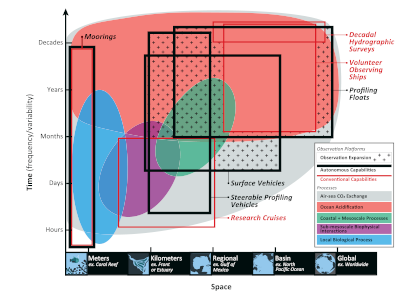
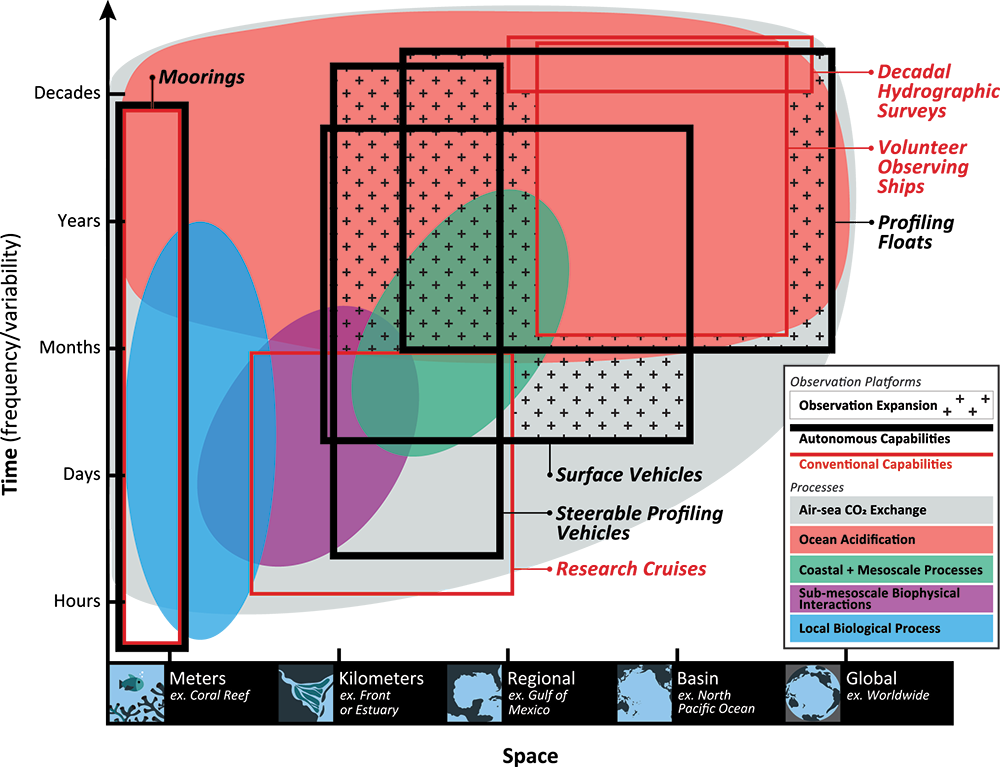
Amidst a backdrop of natural variability, the ocean carbonate system is undergoing a massive anthropogenic change. To capture this anthropogenic signal and differentiate it from natural variability, carbonate observations are needed across a range of spatial and temporal scales (Figure 1), many of which are not captured by traditional oceanographic platforms. A new review of autonomous carbonate observations published in Current Climate Change Reports highlights the development and deployment of pH sensors capable of in situ measurements on autonomous platforms, which represents a major step forward in observing the ocean carbonate system. These sensors have been rigorously field-tested via large-scale deployments on profiling floats in the Southern Ocean (Southern Ocean Carbon and Climate Observations and Modeling, SOCCOM), providing an unprecedented wealth of year-round data that have demonstrated the importance of wintertime outgassing of carbon dioxide in the Southern Ocean.

Figure 1: Observational capabilities and carbonate system processes as a function of time and space. Ocean processes that affect the carbonate system (solid color shapes—labeled in the legend) are depicted as a function of the temporal and spatial scales over which they must be observed to capture important variability and/or long-term change.

Most current autonomous platforms routinely measure only a single carbonate parameter, which then requires an algorithm to estimate a second parameter so that the rest of the carbonate system can be calculated. However, the ongoing development of sensors and systems to measure, rather than estimate, other carbonate parameters may greatly reduce uncertainty in constraining the full carbonate system. It is critical that the community continue to develop and adhere to best practices for calibration and data handling as existing sensors are deployed in increasing numbers and new sensors become available. Expanding autonomous carbonate measurements will increase our understanding of how anthropogenic change impacts natural variability and will provide a means to monitor carbon uptake by the ocean in real-time at high spatial and temporal resolution. This will not only help to understand the mechanisms driving changes in the ocean carbonate system, but will allow new insights in the role of mesoscale processes in regional and global biogeochemical cycles.


Authors:
Seth M. Bushinsky (Princeton University/University of Hawai’i Mānoa)
Yuichiro Takeshita (Monterey Bay Aquarium Research Institute)
Nancy L. Williams (Pacific Marine Environmental Laboratory – NOAA / University of South Florida)

Deep ocean carbon reconstruction helps decipher a million-year-old climate mystery

Posted by mmaheigan 
· Tuesday, July 23rd, 2019 

Approximately one million years ago, Earth’s periodic ice ages increased in strength and duration, shifting from a 41,000-year pacing to a 100,000-year pacing, both linked to Earth’s orbital variations. The causes of this climate shift known as the mid-Pleistocene transition (MPT) have been debated for decades.

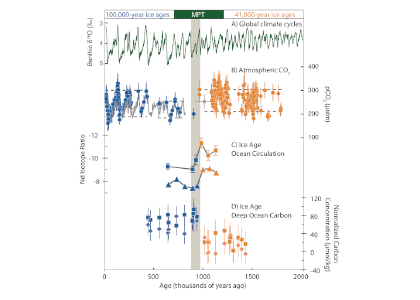
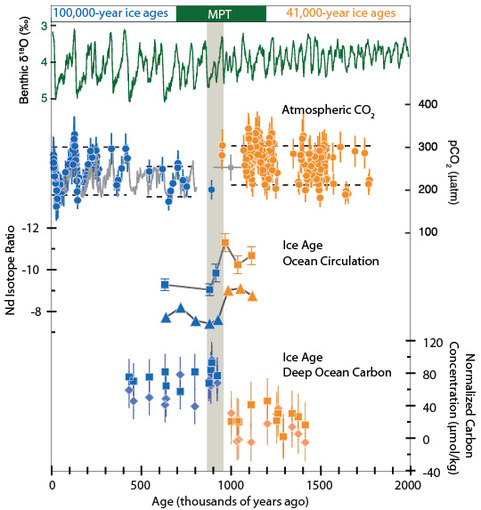
A recent study in Nature Geoscience addresses how the ocean carbon cycle contributed to the MPT by quantifying the carbon inventory of the deep Atlantic Ocean during this time. Using trace element and isotope ratios of fossil marine foraminifera, the authors demonstrate that an abrupt weakening of deep ocean overturning circulation between 950,000 and 900,000 years ago occurred alongside a pronounced increase in carbon content of the deep Atlantic Ocean. This study revealed significantly higher carbon concentrations in the deep North and South Atlantic basins during the post-MPT 100,000-year ice ages relative to the 41,000-year ice ages prior to the MPT (Figure 1).

Figure 1 caption: The last two million years of glacial cycles, with present day on left and age increasing from left to right. Orange data are from 41,000-year ice ages; blue data are from,100,000-year ice ages. (A) Glacial-interglacial cycles demonstrated in benthic oxygen isotopes (green), with warmer interglacials up and peak ice ages downward. (B) Atmospheric CO2 from ice core measurements (gray lines) and reconstructed from boron isotopes (circles) (C), Peak ice age neodymium isotope ratios indicating strength of density-driven deep ocean circulation (squares and triangles indicate two different sediment cores). (D) Peak ice age deep ocean carbon content (squares and diamonds indicate two independent reconstructions from the same South Atlantic sediment core).

These data indicate that since 950,000 years ago, the deep Atlantic Ocean has stored an extra 50 billion tons of carbon during peak ice ages. This study hypothesizes that this extra carbon was sequestered from the atmosphere via a feedback between Antarctic ice sheet extent and the efficiency of air-sea carbon exchange in the Southern Ocean. The authors propose that intensification of ice ages one million years ago was closely linked to enhanced ocean carbon storage and resultant lowering of atmospheric CO2 levels.

While paleoclimatologists consider the MPT to be the most recent major climate transition, the magnitude of carbon perturbation at the MPT pales in comparison to today’s human emissions. Today, humans produce 50 billion tons of carbon in only five years. Studies of the carbon cycle across past climate transitions like the MPT provide key insights on how future climate may respond to today’s carbon cycle disruption.


Authors
Jesse Farmer (LDEO Columbia University; now at Princeton University and Max Planck Institute for Chemistry)
Bärbel Hönisch, Laura Haynes, Maureen Raymo, Steven Goldstein, Maayan Yehudai, Joohee Kim (LDEO Columbia University)
Heather Ford (Queen Mary University of London)
Dick Kroon, Simon Jung, Dave Bell (University of Edinburgh)
Maria Jaume-Seguí, Leopoldo Pena (University of Barcelona)


See this related popular article and video in the Washington Post.

The causes of the 90-ppm glacial atmospheric CO2 drawdown still strongly debated

Posted by mmaheigan 
· Tuesday, July 9th, 2019 

Joint feature with GEOTRACES

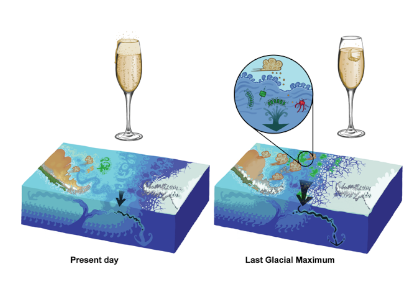
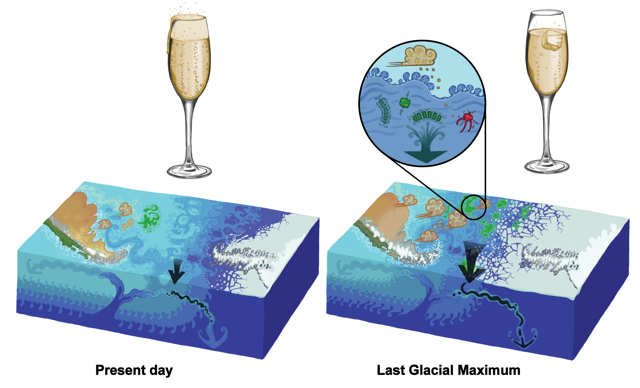
Figure: Illustration of the two main mechanisms identified by this study to explain lower atmospheric CO2 during glacial periods. Left: present-day conditions; right: conditions around 19,000 years ago during the Last Glacial Maximum. The obvious explanation for lower CO2 during glacial periods – cooler ocean temperatures (darker blue shade) making CO2 more soluble, much as a glass of sparkling wine will remain fizzier for longer when it is colder – has long been dismissed as not being a significant factor. However, previous calculations assumed that the ocean cooled uniformly and was saturated in dissolved CO2. The model, consistent with reconstructions of sea surface temperature, predicts more cooling at mid latitudes compared with polar regions and also accounts for undersaturation. This nearly doubles the effect of temperature change and accounts for almost half the 90 ppm glacial-interglacial atmospheric CO2 difference. Another quarter is explained in this model by increased growth of marine algae (green blobs and inset) in the waters off Antarctica. Algae absorb CO2 from the atmosphere during photosynthesis and “pump” it into the deep ocean when they die and sink. But their growth in the present-day ocean, especially the waters off Antarctica, is limited by the availability of iron, an essential micronutrient primarily supplied by wind-borne dust. In our model an increased supply of iron to the Southern Ocean, likely originating from Patagonia, Australia and New Zealand, enhances their growth and sucks CO2 out of the atmosphere. This “fertilization” effect was greatly underestimated by previous studies. The study also finds that, contrary to the current consensus, a large expansion of sea ice off Antarctica and reconfiguration of ocean circulation may have played only a minor role in glacial-interglacial CO2 changes. Credit: Illustration by Andrew Orkney, University of Oxford.

Using an observationally constrained earth system model, S. Khatiwala and co-workers compare different processes that could lead to the 90-ppm glacial atmospheric CO2 drawdown, with an important improvement on the deep carbon storage quantification (i.e. Biological Carbon Pump efficiency). They demonstrate that circulation and sea ice changes had only a modest net effect on glacial ocean carbon storage and atmospheric CO2, whereas temperature and iron input effects were more important than previously thought due to their effects on disequilibrium carbon storage.

Authors:
Samar Khatiwala (University of Oxford, UK)
Andreas Schmittner and Juan Muglia (Oregon State University)

Zooplankton-fueled carbon export is changing in the North Atlantic Ocean

Posted by mmaheigan 
· Monday, June 10th, 2019 

Zooplankton-mediated carbon export is an important, but variable and relatively unconstrained part of the biological carbon pump—the processes that fix atmospheric carbon dioxide in organic material and transport it from the upper sunlit ocean to depth. Changes in the biological pump impact the climate system, but are challenging to quantify because such analyses require spatially and temporally explicit information about biological, chemical, and physical properties of the ocean, where empirical observations are in short supply.

A recent study in Nature, Ecology and Evolution focused on copepods in the northern half of the North Atlantic Ocean, where the Continuous Plankton Recorder (CPR) time series program has documented surface plankton abundance and taxonomic composition for nearly six decades. Copepods transport carbon passively by producing sinking fecal pellets while feeding near the sea surface, and actively via daily and seasonal migrations to deeper waters where carbon is released through respiration, defecation, and mortality. Using allometry, metabolic theory, and an optimal behavior model, the authors examined patterns of passive and active carbon transport from 1960 to 2014 and sensitivity of carbon export to different model inputs.

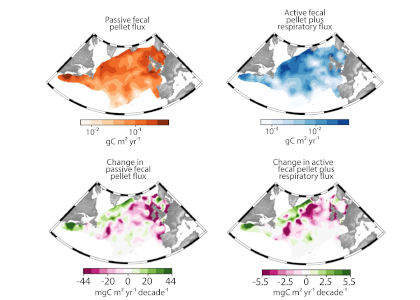
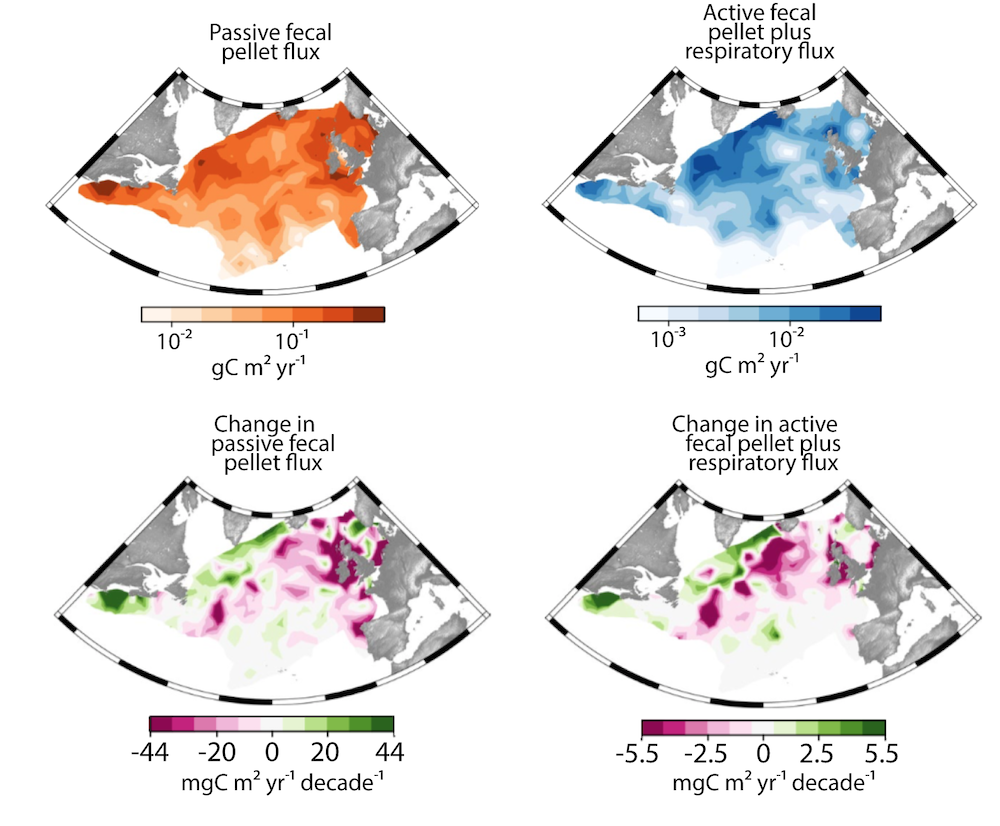
Figure caption: Spatial distribution and change, from 1960 to 2014, of modeled copepod-mediated carbon flux: top left – mean passive carbon flux (sinking fecal pellets), bottom left – change in passive carbon flux, top right – mean active carbon flux (respiration plus fecal pellets produced during diel vertical migration), bottom right – change in active carbon flux.

The authors observed that from southern Iceland to the Gulf of Maine, copepod-mediated carbon transport has increased over the last six decades, with the highest rates around 30 mgC m-2 y-1 each decade for passive flux, and 4 mgC m-2 y-1 each decade for active flux. Meanwhile, it has decreased across much of the more temperate central northern North Atlantic with highest rates around 69 mgC m-2 y-1 each decade for passive flux and 8 mgC m-2 y-1 each decade for active flux. This pattern is largely driven by changes in copepod population distributions and community structure, specifically the distributions of large and abundant species (e.g. Calanus spp.). These results suggest that shifts in species distributions driven by a changing global climate are already impacting ecosystem function across the northern North Atlantic Ocean. These shifts are not latitudinally uniform, thus highlighting the complexity of marine ecosystems. This study demonstrates the importance of these sustained plankton measurements and how plankton-mediated carbon fluxes can be mechanistically implemented in next-generation biogeochemical models.

Authors:
Philipp Brun (Technical University of Denmark and Swiss Federal Research Institute)
Karen Stamieszkin (University of Maine, Bigelow Lab and Virginia Institute of Marine Science)
Andre W. Visser (Technical University of Denmark)
Priscilla Licandro (Sir Alister Hardy Foundation for Ocean Science, Plymouth Marine Laboratory, and Stazione Zoologica Anton Dohrn, Italy)
Mark R. Payne (Technical University of Denmark)
Thomas Kiørboe (Technical University of Denmark)


Also see OCB2019 plenary session: The effect of size on ocean processes (allometry) and implications for export (Thursday, June 27, 2019)

South Pacific particulate organic carbon fate challenges Martin’s Law

Posted by mmaheigan 
· Tuesday, May 14th, 2019 

Joint science highlight with GEOTRACES

Carbon storage in the ocean is sensitive to the depths at which particulate organic carbon (POC) is respired back to CO2 within the twilight zone (100-1000m). For decades, it has been an oceanographic priority to determine the depth scale of this regeneration process. To investigate this, GEOTRACES scientists are deploying new isotopic tools that provide a high-resolution snapshot of POC flux and regeneration across steep biogeochemical gradients in the South Pacific Ocean.

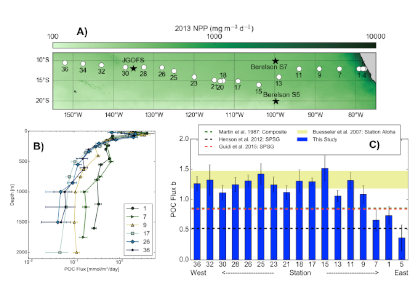
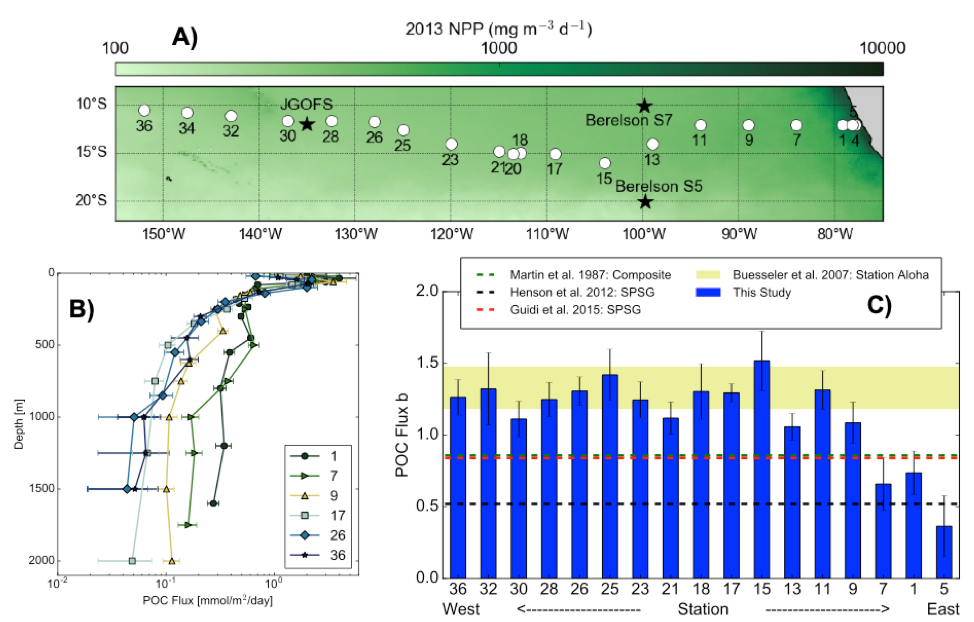
A recent paper in PNAS reported on particulate organic carbon (POC) fluxes throughout the water column (focusing on the upper 1000 m) along the GP16 GEOTRACES section between Peru and Tahiti (Figure 1A).  POC fluxes (Figure 1B) were derived by normalizing concentrations of POC to 230Th following analysis of samples collected by in situ filtration. This work builds on a research theme initiated at the GEOTRACES-OCB synthesis workshop held at Lamont-Doherty Earth Observatory in 2016.

Figure caption: Site map and POC flux characteristics from GEOTRACES GP16 section. Plot A) shows the GP16 station locations as white circles, with nearby sediment trap deployments as black stars, with 2013 MODIS satellite-derived net primary productivity in the background. Plot B) shows POC fluxes from particulate 230Th-normalization from selected stations spanning the zonal extent of the GP16 section. Plot C) shows power law exponent b values for each GP16 station (blue), compared to estimates from bottom-moored sediment traps in the South Pacific (black and red dashed lines), a compilation of sediment traps in the North Pacific (green dashed line), and neutrally buoyant sediment traps in the subtropical North Pacific (yellow shaded band). GP16 regeneration length scales from 230Th-normalization agree most closely with the estimates from neutrally buoyant sediment traps.

The study results show that POC regeneration depth is shallower than anticipated, especially in warm stratified waters of the subtropical gyre. Regeneration depth—expressed in terms of the Martin-curve power-law exponent “b” (Figure 1C)—is shown to be greater than previous estimates (horizontal dashed lines), but similar to values obtained using neutrally buoyant sediment traps at the Hawaii Ocean Time-series Station Aloha. In contrast to the rapid regeneration of POC in warm stratified waters, POC regeneration within the ODZ is below our detection limits. Models have shown that shallower regeneration of POC leads to less efficient carbon storage in the ocean, making the authors speculate that global warming, yielding expanded and more stratified gyres, may induce a reduction of the ocean’s efficacy for carbon storage via the biological pump.


Authors:
Frank J. Pavia, Robert F. Anderson, Sebastian M. Vivancos, Martin Q. Fleisher (Columbia University)
Phoebe J. Lam (University of California Santa Cruz)
B.B. Cael (now at University of Hawai’i Manoa, formerly at MIT)
Yanbin Lu, Pu Zhang, R. Lawrence Edwards (University of Minnesota)
Hai Cheng (University of Minnesota and Xi’an Jiaotong University)

Nutrient and carbon limitation drive broad-scale patterns of mixotrophy in the ocean

Posted by mmaheigan 
· Tuesday, May 14th, 2019 

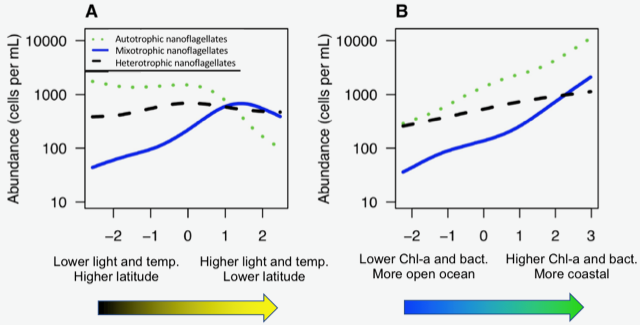
In the ocean, unicellular eukaryotes are often mixotrophic, which means they photosynthesize and also consume prey. In recent decades, it has become clear that mixotrophs are ubiquitous in sunlit ocean habitats. Additionally, models predict that mixotrophs have important impacts on productivity, nutrient cycling, carbon export, and food web structure. However, there is little understanding of the environmental conditions that select for a mixotrophic lifestyle, and it is unclear how mixotrophs succeed in competition with autotrophic and heterotrophic specialists. A recent study in PNAS that synthesized measurements of mixotrophic nanoflagellates showed that mixotrophs are more abundant in stratified, well-lit, low latitude environments (Figure 1A). They are also more abundant, relative to pure heterotrophs, in productive coastal environments (Figure 1B). A trait-based model analysis revealed that the success of mixotrophs depends on the fact that they are less nutrient-limited than autotrophs (due to prey-derived nutrients) and less carbon-limited than heterotrophs (due to photosynthesis). This synergy requires sufficient light, leading to success in low latitude environments. Similarly, a greater supply of dissolved nutrients relative to prey, as commonly observed in coastal environments, favors mixotrophs relative to heterotrophs. One implication of these results is that carbon fixation at lower latitudes may be enhanced by mixotrophy, while limiting nutrients may be more efficiently transferred to higher trophic levels.

Figure 1. Estimated abundance of autotrophic, mixotrophic, and heterotrophic nanoflagellates across environmental gradients in the ocean.


Author:
Kyle Edwards (Univ. Hawaii at Manoa)

A synthesis of North American coastal carbon fluxes

Posted by mmaheigan 
· Tuesday, April 30th, 2019 

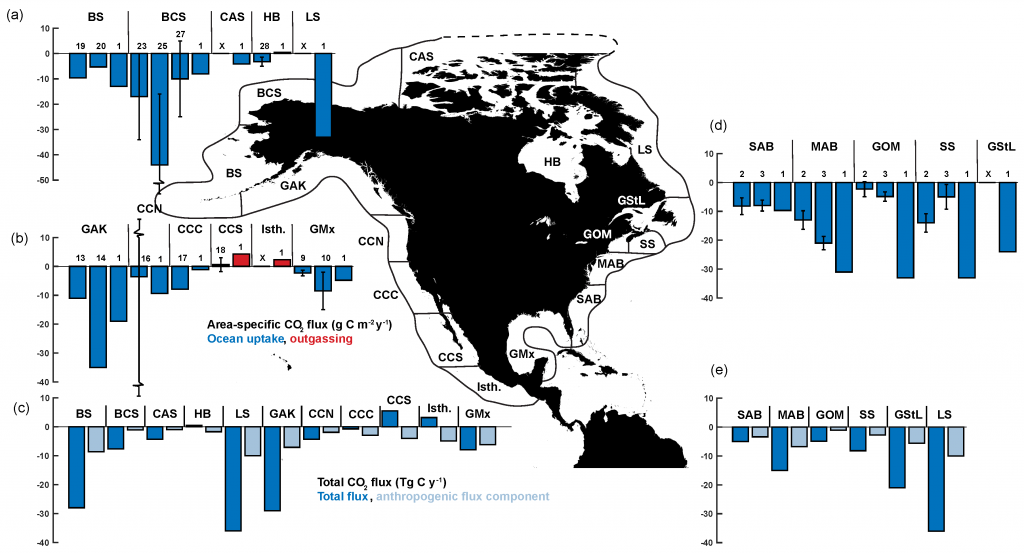
Carbon fluxes in the coastal ocean and across its boundaries with the atmosphere, land, and the open ocean are an important but poorly constrained component of the global carbon budget. By synthesizing available observations and model simulations, a recent study aims to answer 1) whether the coastal ocean of North America takes up atmospheric CO2 and exports carbon to the open ocean; and 2) if so, how much? The authors estimate a net carbon sink of 160±80 Tg C yr−1 in the North American Exclusive Economic Zone (EEZ) with the Arctic, sub-Arctic and mid-latitude Atlantic EEZ regions as the major contributors.

Portion of EEZ Tg C yr−1 % of the total area
Arctic and sub-Arctic 104 51%
Mid-latitude Atlantic 62 25%
Mid-latitude Pacific -3.7 24%

Table 1: Regional breakdown of estimated carbon sink in the North Atlantic EEZ (negative values imply a carbon source).


Combining the net uptake with an estimate of carbon input from land of minus estimates of burial and accumulation of dissolved carbon in EEZ waters as follows implies a carbon export of 151±105 Tg C yr−1 to the open ocean.

160±80 

Tg C yr−1

+

106±30 

Tg C yr−1

–

65±55 

Tg C yr−1

–

50±25 

Tg C yr−1

=

151±105 

Tg C yr−1

Net uptake


Carbon input from land Estimated burial Estimated accumulation DOC in EEZ waters Carbon export to open ocean (estimated C export to open ocean)


The estimated uptake of atmospheric carbon in the North American EEZ amounts to 6.4% of the global ocean uptake of atmospheric CO2 (est. 2,500 Tg C yr−1). The North American EEZ only represents ~4% of the global ocean surface area, thus the CO2 uptake is about 50% more efficient in the North American EEZ than the global average. Given the importance of coastal margins, both in contributing to carbon budgets and in the societal benefits they provide, further efforts to improve assessments of the carbon cycle in these regions are paramount. It is critical to maintain and expand existing coastal observing programs, continue national and international coordination and integration of observations, modeling capabilities, and stakeholder needs.


Figure: Area-specific carbon fluxes for North American coastal regions (a, b and d) and total fluxes for a decomposition of the EEZ (c, e).


Authors:
Katja Fennel, Timothée Bourgeois (Dalhousie University, Canada)
Simone Alin, Richard A. Feely, Adrienne Sutton (NOAA Pacific Marine Environmental Laboratory)
Leticia Barbero (NOAA Atlantic Oceanographic and Meteorological Laboratory)
Wiley Evans (Hakai Institute, Canada)
Sarah Cooley (Ocean Conservancy)
John Dunne (NOAA Geophysical Fluid Dynamics Laboratory)
Jose Martin Hernandez-Ayon (Autonomous University of Baja California, Mexico)
Xinping Hu (Texas A&M University)
Steven Lohrenz (University of Massachusetts, Dartmouth)
Frank Muller-Karger, Lisa Robbins (University of South Florida)
Raymond Najjar (Pennsylvania State University)
Elizabeth Shadwick (CSIRO, Australia)
Samantha Siedlecki, Penny Vlahos (University of Connecticut)
Nadja Steiner (Department of Fisheries and Oceans Canada)
Daniela Turk (Lamont-Doherty Earth Observatory)
Zhaohui Aleck Wang (Woods Hole Oceanographic Institution)

Northeast Pacific time-series reveals episodic events as major player in carbon export

Posted by mmaheigan 
· Tuesday, April 16th, 2019 

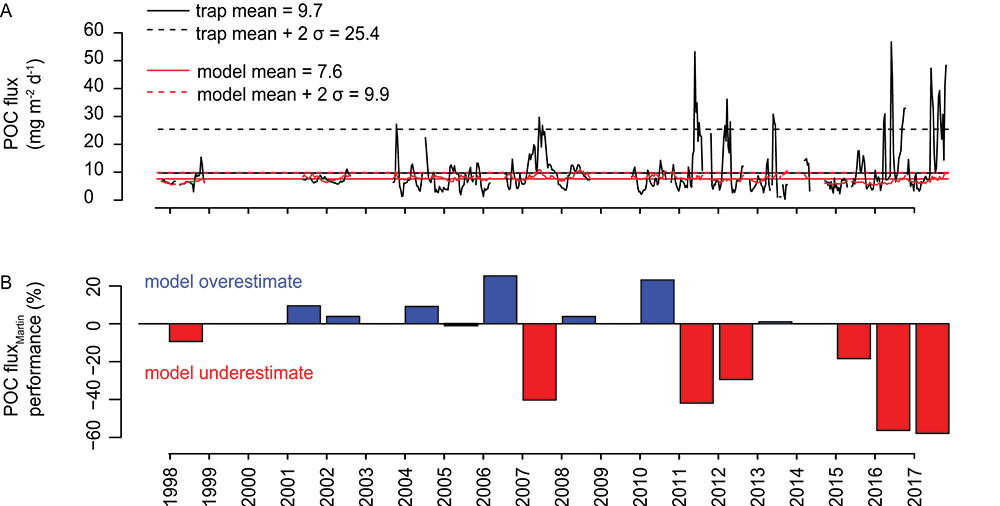
Temporal fluctuations in the oceanic carbon budget play an important role in the cycling of organic matter from production in surface waters to consumption and sequestration in the deep ocean. A 29-year time-series (1989-2017) of particulate organic carbon (POC) fluxes and seafloor measurements of oxygen consumption in the abyssal northeast Pacific (Sta. M, 4,000 m depth) recently revealed an increasing proportional contribution from episodic events over the past seven years. From 2011 to 2017, 43% of POC flux arrived during high-magnitude (≥ mean + 2 σ) episodic events. Time lags between changes in satellite-estimated export flux (EF), POC flux to the seafloor, and seafloor oxygen consumption varied from 0 to 70 days among six flux events, which could be attributed to variable remineralization rates and/or particle sinking speeds. The Martin equation, a commonly used model to estimate carbon flux, predicted background fluxes well but missed episodic fluxes, subsequently underestimating the measured fluxes by almost 50% (Figure 1). This study reveals the potential importance of episodic POC pulses into the deep sea in the oceanic carbon budget, which has implications for observing infrastructure, model development, and field campaigns focused on quantifying carbon export.

Figure Caption: (A) Station M POC flux measured from sediment traps compared to Martin model estimates, from 1989 to 2017. (B) Model performance for years with >50% sampling coverage: (POC fluxMartin − POC fluxtrap)/POC fluxtrap 100.


Authors:
Kenneth Smith (MBARI)
Henry Ruhl (MBARI, NOC)
Christine Huffard (MBARI)
Monique Messié (MBARI, Aix Marseille Université)
Mati Kahru (Scripps)


See also https://www.mbari.org/carbon-pulses-climate-models/

Ocean color offers early warning signal of climate change’s impact on marine phytoplankton

Posted by mmaheigan 
· Monday, April 15th, 2019 

Marine phytoplankton form the foundation of the marine food web and play a crucial role in the earth’s carbon cycle. Typically, satellite-derived Chlorophyll a (Chl a) is used to evaluate trends in phytoplankton. However, it may be many decades (or longer) before we see a statistically significant signature of climate change in Chl a due to its inherently large natural variability. In a recent study in Nature Communications, authors explored how other metrics, in particular the color of the ocean, may show earlier and stronger signals of climate change at the base of the marine food web.

Figure 1. Computer model results indicating the year in which the signature of climate change impact is larger than the natural variability for (a) Chl a, and (b) remotely sensed reflectance in the blue-green waveband. White areas indicate where there is not a statistically significant change by 2100, or for regions that are currently ice-covered.


In this study, the authors use a unique marine physical-biogeochemical and ecosystem model that also captures how light penetrates the ocean and is reflected upward. The model shows that over the course of the 21st century, remote sensing reflectance (RRS, the ratio of upwelling radiance to the downwelling irradiance at the ocean’s surface) in the blue-green portions of the light spectrum is likely to have an earlier, more spatially extensive climate change-driven signal than Chl a (Figure 1). This is because RRS integrates not only changes to Chl a, but also alterations in other optically important water constituents. In particular, RRS also captures changes in phytoplankton community structure, which strongly affects ocean optics and is likely to be altered over the 21st century. Monitoring the response of marine phytoplankton to climate change is important for predicting changes at higher trophic levels, including commercial fisheries. Our study emphasizes the importance of 1) maintaining ocean color sensor compatibility and long-term stability, particularly in the blue-green wavebands; 2) maintaining long-term in situ time-series of plankton communities – e.g., the Continuous Plankton Recorder survey and repeat stations (e.g., HOT, BATS); and 3) reducing uncertainties in satellite-derived phytoplankton community structure estimates.


Authors:
Stephanie Dutkiewicz, Oliver Jahn (Massachusetts Institute of Technology)
Anna E. Hickman (University of Southampton)
Stephanie Henson (National Oceanography Centre Southampton)
Claudie Beaulieu (University of California, Santa Cruz)
Erwan Monier (University of California, Davis)

« Previous Page
Next Page »

FilterbyKeyword

abundance acidification additionality advection africa air-sea air-sea interactions albedo algae alkalinity allometry amendments ammonium AMO AMOC anoxic Antarctic Antarctica anthro impacts anthropogenic carbon anthropogenic impacts appendicularia aquaculture aquatic continuum aragonite saturation arctic Argo argon arsenic artificial seawater assumptions AT Atlantic atmospheric CO2 atmospheric nitrogen deposition authigenic carbonates autonomous platforms AUVs awb bacteria bathypelagic BATS BCG Argo benthic bgc argo bias bio-go-ship bio-optical bioavailability biogeochemical biogeochemical cycles biogeochemical models biogeochemistry Biological Essential Ocean Variables biological pump biomass biophysics bloom blue carbon bottom water boundary layer buffer capacity C14 CaCO3 calcification calcite carbon carbon-climate feedback carbon-sulfur coupling carbon 14 carbonate carbonate chemistry carbonate chemistry OAE carbonate system carbon budget carbon cycle carbon cycling carbon dioxide carbon export carbon fluxes carbon removal carbon sequestration carbon storage Caribbean CCA CCS changing marine chemistry changing marine ecosystems changing marine environments changing ocean chemistry chemical oceanographic data chemical speciation chemoautotroph chesapeake bay chl a chlorophyll circulation climate clouds CO2 CO3 coastal and estuarine coastal darkening coastal ocean cobalt Coccolithophores commercial community community composition competition conservation cooling effect copepod copepods coral reefs cruise CTD currents cyclone daily cycles data data access data assimilation database data management data product data sets Data standards DCM dead zone decadal trends decomposers decomposition deep convection deep ocean deep sea coral deep water deepwater horizon denitrification dense water deoxygenation depth diatoms DIC diel migration diffusion dimethylsulfide dinoflagellate dinoflagellates discrete measurements disequilibrium distribution DOC DOM domoic acid DOP dust DVM earth system ecological feedbacks ecology economics ecosystem management ecosystems eddy Education EEZ Ekman transport emissions ENSO enzyme equatorial current equatorial regions ESM estuarine and coastal carbon fluxes estuary euphotic zone eutrophication evolution export export fluxes export production extreme events faecal pellets fecal pellets filter feeders filtration rates fire fish Fish carbon fisheries fishing float floats fluid dynamics fluorescence food webs forage fish forams framework freshening freshwater frontal zone fronts functional role future oceans gelatinous zooplankton gene transfer geochemistry geoengineering geologic time GEOTRACES glaciers gliders global carbon budget global oceam global ocean global ocean models global overturning circulation global warming go-ship gradient grazing greenhouse gas greenhouse gases Greenland ground truthing groundwater Gulf of Maine Gulf of Mexico Gulf Stream gyre harmful algal bloom heat waves high latitude human food human impact human well-being hurricane hydrogen hydrothermal hypoxia ice age iceberg ice cores ice cover industrial onset inland waters in situ inverse circulation ions iron iron fertilization iron limitation isotopes jellies katabatic winds kelvin waves krill kuroshio lab vs field lagoon land land-ocean continuum larvaceans lateral transport LGM lidar ligands light light attenuation lineage lipids low nutrient machine learning mangroves marine carbon cycle marine heatwave marine particles marine snow marine snowfall marshes mCDR mechanisms Mediterranean meltwater mesocosm mesopelagic mesoscale mesoscale processes metagenome metals methane methods microbes microlayer microorganisms microplankton microplastics microscale microzooplankton midwater migration minerals mitigation mixed layer mixed layers mixing mixotrophs mixotrophy model modeling modeling atmosphere model validation mode water molecular diffusion MPT MRV multi-decade N2 n2o NAAMES NCP nearshore net community production net primary productivity new ocean state new technology Niskin bottle nitrate nitrogen nitrogen cycle nitrogen fixation nitrous oxide north atlantic north pacific North Sea NPP nuclear war nutricline nutrient budget nutrient cycles nutrient cycling nutrient limitation nutrients OA observations ocean-atmosphere ocean acidification ocean acidification data ocean alkalinity enhancement ocean carbon uptake & storage ocean carbon uptake and storage ocean color ocean interior ocean modeling ocean observatories ocean warming ODZ oil oligotrophic omics OMZ open ocean optics organic carbon organic particles oscillation outwelling overturning circulation oxidizing oxygen oxygen-deficient pacific paleoceanography PAR parameter optimization parasite particle flux particles partnerships pCO2 PDO peat pelagic perturbation PETM pH phenology phosphate phosphorus photosynthesis physical processes physiology phytoplankton PIC piezophilic piezotolerant plankton POC polar polar regions policy pollutants precipitation predation predator-prey predators prediction pressure primary productivity Prochlorococcus productivity prokaryotes proteins pteropods pycnocline python radioisotopes redox remineralization remote sensing repeat hydrography residence time resource management respiration resuspension rivers rocky shore Rossby waves Ross Sea ROV salinity salt marsh satellite scale seafloor seagrass sea ice sea level rise seasonal seasonal effects seasonality seasonal patterns seasonal trends sea spray sea surface seawater collection seaweed secchi sediments sensor sensors sequestration shelf ocean shelf system shells ship-based obs ship-based observations shorelines siderophore silica silicate silicon cycle sink sinking sinking particles size SOCCOM soil carbon solubility pump southern ocean south pacific spatial covariations speciation spring mixing SST state estimation stoichiometry stratification subduction submesoscale subpolar subtropical sulfate surf surface surface ocean surface water surface waters Synechococcus technology teleconnections temperate temperature temporal covariations thermocline thermodynamics thermohaline thorium tidal time time-series time of emergence titration top predators total alkalinity trace elements trace metals trait-based transfer efficiency transient features trawling Tris trophic interactions trophic transfer tropical turbulence twilight zone upper ocean upper water column upwelling US CLIVAR validation velocity gradient ventilation vertical flux vertical migration vertical transport viruses warming water clarity water column water mass water quality waves weathering western boundary currents wetlands winter mixing zooplankton

Copyright © 2026 - OCB Project Office, Woods Hole Oceanographic Institution, 266 Woods Hole Rd, MS #25, Woods Hole, MA 02543 USA Phone: 508-289-2838  •  Fax: 508-457-2193  •  Email: ocb_news@us-ocb.org

link to nsflink to noaalink to WHOI

Funding for the Ocean Carbon & Biogeochemistry Project Office is provided by the National Science Foundation (NSF) and the National Aeronautics and Space Administration (NASA). The OCB Project Office is housed at the Woods Hole Oceanographic Institution.